“You have a pair of pants. In the left pocket, you have $100. You take $1 out of the left pocket and put in the right pocket. You now have $101. There is no diminution of dollars in your left pocket. That is one magic pair of pants.”

Category: MP Market Reviews

MP Market Review – August 18, 2023

Last updated by BM on August 21, 2023

Summary 

  • This is a weekly installment of our MP Market Review series, which provides updates on the financial markets and Canadian dividend growth companies we monitor on ‘The List’.
  • Last week, ‘The List’ was down with a YTD price return of +1.8% (capital). Dividend growth remained the same and is now at +8.4% YTD, highlighting growth in income over the past year.
  • Last week, no dividend increases from companies on ‘The List’.
  • Last week, no earnings reports from companies on ‘The List’.
  • Two companies on ‘The List’ are due to report earnings this week.
  • If you’re interested in creating your own dividend growth income portfolio, consider subscribing to our premium service, which grants you access to the MP Wealth-Builder Model Portfolio (CDN) and exclusive subscriber-only content.  Learn More         

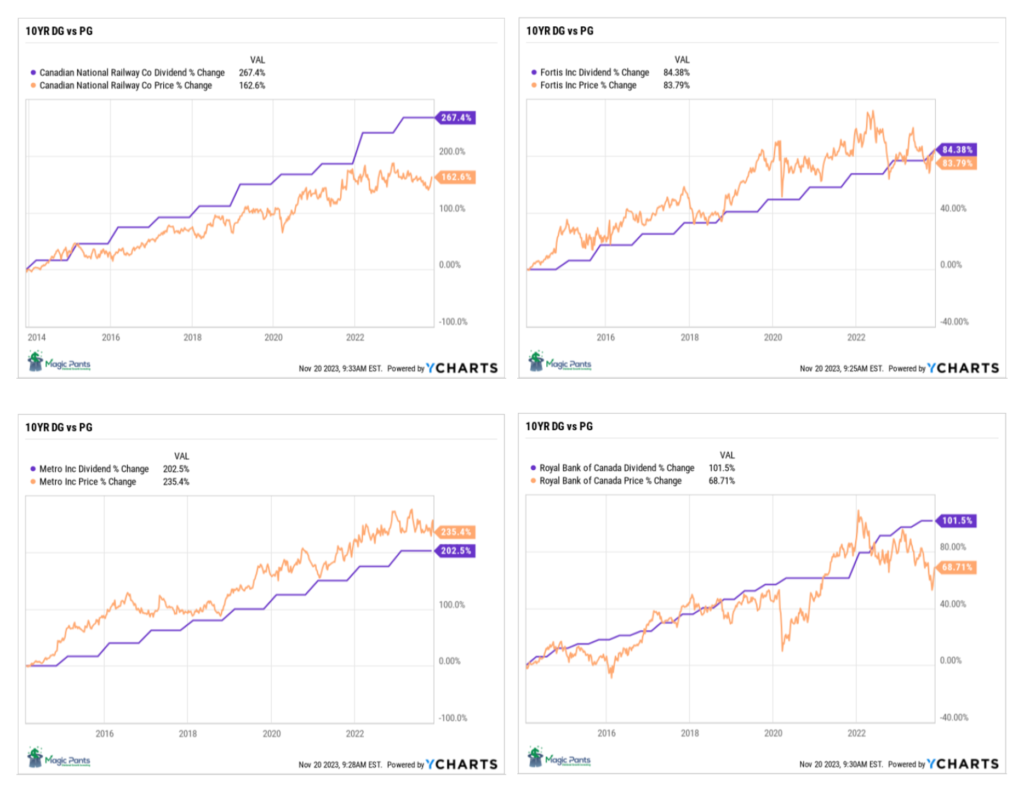
Identifying companies whose dividend growth aligns closely with price growth can considerably enhance the predictability of future returns. Dividend growth investors know that the dividend drives the price in a predictable way, not the other way around. Metro Inc. (MRU-T) is another company on ‘The List’ that follows this dividend growth principle.

Introduction

“You have a pair of pants. In the left pocket, you have $100. You take $1 out of the left pocket and put it in the right pocket. You now have $101. There is no diminution of dollars in your left pocket. That is one magic pair of pants.”

This ‘magic pants’ analogy was from a Seeking Alpha article on dividend investing I read about a decade ago and was one of the catalysts for me to take a closer look at this type of investing and see if it truly was magical. 

After conducting additional research, I have shifted towards utilizing a dividend growth investing (DGI) strategy as my primary investment approach. While I maintain portfolios consisting of high-quality dividend growers from both the United States and Canada, I have opted to concentrate on Canadian (CDN) dividend growth companies in this blog. This is due to several reasons, including a smaller pool of DGI companies to track, a lack of coverage for the DGI strategy by the North American investment media, and a tendency for those who do cover DGI to narrowly focus on only a handful of sectors (Energy and Financials).

While ‘The List’ is not a portfolio in itself, it serves as an excellent initial reference for individuals seeking to diversify their investments and attain higher returns in the Canadian stock market. Through our blog, we provide weekly updates on ‘The List’ and offer valuable perspectives and real-life examples of the dividend growth investing strategy in practice. This helps readers gain a deeper understanding of how to implement and benefit from this investment approach.


DGI Thoughts

“Owning dividend growth stocks in retirement is like having an employer who offers generous wage increases every year.”

– Rob Carrick, Personal Finance Columnist

One of our mentors, Tom Connolly, had an article published in the Globe & Mail this week touting the advantages of dividend growth investing for retirees. His analysis showed how much a portfolio of dividend growth companies produced in income over a ten-year period.

Here is ‘The List’ from our blog, sorted by income generated, over a ten-year period for comparison:

10YR_DIV_PAID-2022-CAGR

Some takeaways from the data:

  • The average income generated over the decade returns ~45% of your original investment back to you in the form of dividends alone.
  • The dividend growth (10Y DG) average of ‘The List’ drives price growth (10Y PG) at about the same rate (10.0% vs 10.3%).
  • The average annual total return (10Y TR) generated from ‘The List’ was 12.4%. This outperforms the TSX Composite index, and all other Canadian dividend growth mutual fund returns by almost 40% over the same time frame!
  • High dividend growers, near bottom of the list also tend to be higher capital growers (CAGR 10Y PG).
  • Dividend growth of 10% (10Y DG) surpasses inflation by a considerable margin meaning your purchasing power is never impacted.
  • Both income and capital are still growing (unlike bonds, GICs and other fixed income investments).
  • Starting yield is much higher now than in 2013 (3.4% vs 2.7%).

If you have not yet joined as a paid subscriber of the blog to receive DGI Alerts on the activity and content related to our model portfolio, it’s not too late. Click Here. 

Recent News 

Want to grow your retirement income every year? Dividend growth stocks like these deliver. (Globe & Mail)

https://www.theglobeandmail.com/investing/markets/inside-the-market/article-want-to-grow-your-retirement-income-every-year-dividend-growth-stocks/

“A general rule from Mr. Connolly: share price growth tracks a company’s dividend growth rate. Not in lockstep, but there is a strong correlation.”

Good article on income generation from a list of dividend growth stocks, over a ten-year period, by one of my mentors, Tom Connolly.

“Whether it happens at some point in 2024 or beyond, interest rates will start to fall and dividend stocks will become more appealing to investors. Buying now puts you in a position to benefit from high yields in 2023, dividend growth in the future and the potential for capital gains.”

 We agree with the author on this point. The recent yields of good dividend growers are now ~25% higher than in 2013.

Dividend stocks are a better investment than income properties: BMO economist. (Globe & Mail)

https://www.theglobeandmail.com/investing/markets/inside-the-market/article-dividend-stocks-are-a-better-investment-than-income-properties-bmo/

The author correctly points out many parallels between real estate investing and dividend growth investing. Both provide growing income and as the income goes up, so does the underlying asset’s price. A few of the differences are highlighted in this article which moves the needle towards dividend growth investing as our preferred choice.

As a real estate investor early in my career, I found out the hard way that the time I spent on real estate investing could have been better spent focusing on my career and building a dividend growth portfolio of quality companies in tandem.

The List (2023)

Last updated by BM on August 18, 2023

The Magic Pants List contains 27 Canadian dividend growth stocks. ‘The List’ contains Canadian companies that have raised their dividend yearly for at least the last ten years and have a market cap of over a billion dollars. Below is each stock’s symbol, name, current yield, current price, price return year-to-date, current dividend, dividend growth year-to-date and current dividend growth streak. Companies on ‘The List’ are added or subtracted once a year, on January 1. After that, ‘The List’ is set for the next twelve months. Prices and dividends are updated weekly.

SYMBOL COMPANY YLD PRICE YTD % DIV YTD % STREAK
AQN-N Algonquin Power & Utilities 7.0% $7.20 7.0% $0.51 -29.0% 12
ATD-T Alimentation Couche-Tard Inc. 0.8% $69.50 15.6% $0.56 19.1% 13
BCE-T Bell Canada 6.9% $55.14 -8.5% $3.82 5.0% 14
BIP-N Brookfield Infrastructure Partners 4.4% $32.01 5.2% $1.44 6.3% 15
CCL-B-T CCL Industries 1.8% $60.35 4.0% $1.06 10.4% 21
CNR-T Canadian National Railway 2.1% $153.95 -5.5% $3.16 7.8% 27
CTC-A-T Canadian Tire 4.4% $155.57 6.1% $6.90 17.9% 12
CU-T Canadian Utilities Limited 5.6% $32.24 -12.7% $1.79 1.0% 51
DOL-T Dollarama Inc. 0.3% $86.38 8.2% $0.27 23.8% 12
EMA-T Emera 5.4% $51.48 -2.2% $2.76 3.0% 16
ENB-T Enbridge Inc. 7.5% $47.25 -11.4% $3.55 3.2% 27
ENGH-T Enghouse Systems Limited 3.0% $28.02 -21.5% $0.85 18.2% 16
FNV-N Franco Nevada 1.0% $135.57 -1.9% $1.36 6.3% 15
FTS-T Fortis 4.2% $53.71 -2.9% $2.26 4.1% 49
IFC-T Intact Financial 2.3% $195.50 -0.1% $4.40 10.0% 18
L-T Loblaws 1.5% $115.72 -3.8% $1.74 10.3% 11
MGA-N Magna 3.3% $55.64 -3.3% $1.84 2.2% 13
MRU-T Metro 1.7% $70.20 -7.0% $1.21 10.0% 28
RY-T Royal Bank of Canada 4.4% $121.47 -5.1% $5.34 7.7% 12
SJ-T Stella-Jones Inc. 1.4% $64.80 30.7% $0.92 15.0% 18
STN-T Stantec Inc. 0.9% $89.19 36.5% $0.77 8.5% 11
TD-T TD Bank 4.6% $83.93 -4.3% $3.84 7.9% 12
TFII-N TFI International 1.1% $130.03 29.9% $1.40 29.6% 12
TIH-T Toromont Industries 1.5% $110.17 12.8% $1.68 10.5% 33
TRP-T TC Energy Corp. 7.6% $48.44 -9.1% $3.69 3.4% 22
T-T Telus Corp. 6.3% $22.83 -13.3% $1.43 7.4% 19
WCN-N Waste Connections 0.7% $138.00 4.8% $1.02 7.4% 13
Averages 3.4% 1.8% 8.4% 19

Six Canadian stocks on ‘The List’ declare earnings and dividends in US dollars and are inter-listed on a US exchange in US dollars. The simplest way to display dividend and price metrics for these stocks is to show their US exchange symbols along with their US dividends and price. The stocks I am referring to have a -N at the end of their symbols. You can still buy their Canadian counterparts (-T), but your dividends will be converted into CDN dollars and will fluctuate based on the exchange rate.

Note: When the dividend and share price currency match, the calculation is straightforward. But it’s not so simple when the dividend is declared in one currency, and the share price is quoted in another. Dividing the former by the latter would produce a meaningless result because it’s a case of apples and oranges. To calculate the yield properly, you must express the dividend and share price in the same currency.

Performance of ‘The List’

Feel free to click on this link, ‘The List’ for a sortable version from our website.

Last week, ‘The List’ was up with a YTD price return of +1.8% (capital). Dividend growth remained the same and is now at +8.4% YTD, highlighting growth in income over the past year.

The best performers last week on ‘The List’ were Dollarama Inc. (DOL-T), up +0.91%; Canadian Utilities Limited (CU-T), up +0.34%; and Emera (EMA-T), down -0.17%.

Franco Nevada (FNV-N) was the worst performer last week, down -5.09%.


Dividend Increases

“The growth of dividend paying ability is of significance in the determination of a stock’s quality, or general safety…”

– Arnold Bernhard (the founder of Value Line)

“As a dividend increase is a positive sign of a company’s financial strength, the safest purchase, after research, is a stock with a recent dividend increase.”

– Tom Connolly (the founder of dividendgrowth.ca)

Last week, no dividend increases from companies on ‘The List’.


Earnings Releases

Benjamin Graham once remarked that earnings are the principal factor driving stock prices.

Each quarter we will provide readers with weekly earnings updates of stocks on ‘The List’ during the calendar earnings season. 

The updated earnings calendar can be found here.

Earnings growth and dividend growth tend to go hand in hand, so this information can tell us a lot about the future dividend growth of our quality companies. Monitoring our dividend growers periodically is part of the process, and reading the quarterly earnings releases is a good place to start.

Two earnings reports from companies on ‘The List’ this week

Royal Bank of Canada (RY-T) will release its third-quarter fiscal 2023 results on Thursday, August 24, 2023, before markets open.

TD Bank (TD-T) will release its third-quarter fiscal 2023 results on Thursday, August 24, 2023, before markets open.

Last week, no companies on ‘The List’ reported earnings.


MP Market Review – August 11, 2023

Last updated by BM on August 14, 2023

Summary 

  • This is a weekly installment of our MP Market Review series, which provides updates on the financial markets and Canadian dividend growth companies we monitor on ‘The List’.
  • Last week, ‘The List’ was up with a YTD price return of +4.1% (capital). Dividend growth remained the same and is now at +8.4% YTD, highlighting growth in income over the past year.
  • Last week, no dividend increases from companies on ‘The List’.
  • Last week, eight earnings reports from companies on ‘The List’.
  • No companies on ‘The List’ are due to report earnings this week.
  • If you’re interested in creating your own dividend growth income portfolio, consider subscribing to our premium service, which grants you access to the MP Wealth-Builder Model Portfolio (CDN) and exclusive subscriber-only content.  Learn More         

Identifying companies whose dividend growth aligns closely with price growth can considerably enhance the predictability of future returns. Dividend growth investors know that the dividend drives the price in a predictable way, not the other way around. Metro Inc. (MRU-T) is another company on ‘The List’ that follows this dividend growth principle.

Introduction

“You have a pair of pants. In the left pocket, you have $100. You take $1 out of the left pocket and put it in the right pocket. You now have $101. There is no diminution of dollars in your left pocket. That is one magic pair of pants.”

This ‘magic pants’ analogy was from a Seeking Alpha article on dividend investing I read about a decade ago and was one of the catalysts for me to take a closer look at this type of investing and see if it truly was magical. 

After conducting additional research, I have shifted towards utilizing a dividend growth investing (DGI) strategy as my primary investment approach. While I maintain portfolios consisting of high-quality dividend growers from both the United States and Canada, I have opted to concentrate on Canadian (CDN) dividend growth companies in this blog. This is due to several reasons, including a smaller pool of DGI companies to track, a lack of coverage for the DGI strategy by the North American investment media, and a tendency for those who do cover DGI to narrowly focus on only a handful of sectors (Energy and Financials).

While ‘The List’ is not a portfolio in itself, it serves as an excellent initial reference for individuals seeking to diversify their investments and attain higher returns in the Canadian stock market. Through our blog, we provide weekly updates on ‘The List’ and offer valuable perspectives and real-life examples of the dividend growth investing strategy in practice. This helps readers gain a deeper understanding of how to implement and benefit from this investment approach.


DGI Thoughts

“The four most expensive words in the English language are ‘This time it’s different.’”

 – Sir John Templeton

The Q2 Earnings season is over for companies we follow on ‘The List’. Check out the earnings calendar here and see how each company performed against analyst expectations and the same quarter last year.

Over 50% of the companies we follow did not meet their Q2 comparable earnings from 2022! This should be a signal to investors that even the highest-quality companies are seeing the effects of higher interest rates and inflation. The economy is definitely starting to slow down.

On the flip side, some companies are doing quite well. They tend to be non-cyclical in nature and have pricing power built-in to their business models to offset the effects of inflation on the cost side. Think food retail and utilities.

The third quarter should be interesting. We will find out if the central banks will continue their fight against inflation and slow the economy even further or are they done, and earnings will start to recover. Either way, pay attention to the earnings numbers and take a few minutes to read the quarterly earnings releases below, especially the ‘Outlook’ sections. From this you will get a better sense if management is hinting of an earnings contraction in the quarter ahead or ‘will it be different this time’.

If you have not yet joined as a paid subscriber of the blog to receive DGI Alerts on the activity and content related to our model portfolio, it’s not too late. Click Here. 

Recent News 

Why the stellar performance of the magnificent seven makes a case for index investing (Globe & Mail)

https://www.theglobeandmail.com/investing/markets/inside-the-market/article-why-the-stellar-performance-of-the-magnificent-seven-makes-a-case-for/

“The so-called magnificent seven stocks were responsible for practically all of the gains in the S&P 500 index through the first half of the year. Widen the lens out to the entire world, and roughly 70 per cent of the net wealth created by stock markets globally was driven by this handful of tech behemoths.”

“This year makes an unusually strong case for a broad index approach, which may seem counterintuitive. Why would you want to be forced to own legions of losing stocks when the market rally is so heavily concentrated in a small core of elite names?”

Articles like this perpetuate the myth that index investing is the place to be right now. How soon we forget the market indexes in 2022!

Stop your active portfolio manager bashing. Skill does still matter (Globe & Mail)

https://www.theglobeandmail.com/investing/investment-ideas/article-active-investment-strategy-success/

“Funds that invest in concentrated portfolios and/or deviate significantly from benchmarks tend to outperform, according to recent academic studies.”

There is a lot of good information in this article. There is a lot of good information in this article. Dividend growth investing is a ‘value-oriented’ investing strategy as well. We only purchase our quality dividend growers when they are sensibly (value) priced.

Here are a few of my favorite quotes:

“One can earn risk-adjusted returns of up to 9 per cent a year with rudimentary analysis of the most commonly reported accounting information. Such abnormal profits are a result of fundamental analysis and taking advantage of market inefficiencies.”

“The value-investing process involves three steps. Initially, value investors screen stocks and form portfolios based on a number of metrics such as P/E, P/B, market cap, etc. and focus on stocks in the lowest ranked portfolio. This allows them to identify stocks that have desirable characteristics (i.e., low price vs. fundamentals) and, at the same time, reduce the number of stocks they will consider in depth. The stocks selected from the initial step are now valued to determine their intrinsic value using both asset based and cash-flow-based valuation approaches. Finally, they make a decision to invest only in stocks that are truly undervalued, namely stocks that meet the required margin of safety.”

“Slow economic growth around the world, particularly in China, as well as a slowdown in productivity, lower population growth, aging baby boomers, higher taxes, higher inflation/interest rates and lower government spending will lead to an increase in stock-market volatility. An expensive market will also contribute to rising volatility, both realized and expected.

In this environment, active managers, such as value investors, will shine.”

To receive breaking news about companies on ‘The List’ follow us on Twitter @MagicPants_DGI.

The List (2023)

Last updated by BM on August 11, 2023

The Magic Pants List contains 27 Canadian dividend growth stocks. ‘The List’ contains Canadian companies that have raised their dividend yearly for at least the last ten years and have a market cap of over a billion dollars. Below is each stock’s symbol, name, current yield, current price, price return year-to-date, current dividend, dividend growth year-to-date and current dividend growth streak. Companies on ‘The List’ are added or subtracted once a year, on January 1. After that, ‘The List’ is set for the next twelve months. Prices and dividends are updated weekly.

SYMBOL COMPANY YLD PRICE YTD % DIV YTD % STREAK
AQN-N Algonquin Power & Utilities 6.8% $7.48 11.1% $0.51 -29.0% 12
ATD-T Alimentation Couche-Tard Inc. 0.8% $69.73 15.9% $0.56 19.1% 13
BCE-T Bell Canada 6.7% $56.78 -5.7% $3.82 5.0% 14
BIP-N Brookfield Infrastructure Partners 4.4% $33.31 5.2% $1.44 6.3% 15
CCL-B-T CCL Industries 1.7% $61.99 6.8% $1.06 10.4% 21
CNR-T Canadian National Railway 2.0% $157.23 -3.5% $3.16 7.8% 27
CTC-A-T Canadian Tire 4.4% $156.82 7.0% $6.90 17.9% 12
CU-T Canadian Utilities Limited 5.6% $32.13 -13.0% $1.79 1.0% 51
DOL-T Dollarama Inc. 0.3% $85.60 7.2% $0.27 23.8% 12
EMA-T Emera 5.4% $51.57 -2.0% $2.76 3.0% 16
ENB-T Enbridge Inc. 7.2% $49.38 -7.4% $3.55 3.2% 27
ENGH-T Enghouse Systems Limited 3.0% $28.21 -21.0% $0.85 18.2% 16
FNV-N Franco Nevada 1.0% $142.84 3.4% $1.36 6.3% 15
FTS-T Fortis 4.1% $54.53 -1.5% $2.26 4.1% 49
IFC-T Intact Financial 2.2% $200.23 2.3% $4.40 10.0% 18
L-T Loblaws 1.5% $118.01 -1.9% $1.74 10.3% 11
MGA-N Magna 3.2% $57.25 -0.5% $1.84 2.2% 13
MRU-T Metro 1.7% $71.09 -5.8% $1.21 10.0% 28
RY-T Royal Bank of Canada 4.2% $127.57 -0.4% $5.34 7.7% 12
SJ-T Stella-Jones Inc. 1.4% $68.10 37.4% $0.92 15.0% 18
STN-T Stantec Inc. 0.9% $89.69 37.3% $0.77 8.5% 11
TD-T TD Bank 4.5% $86.26 -1.6% $3.84 7.9% 12
TFII-N TFI International 1.1% $132.49 32.3% $1.40 29.6% 12
TIH-T Toromont Industries 1.4% $115.87 18.6% $1.68 10.5% 33
TRP-T TC Energy Corp. 7.5% $49.33 -7.4% $3.69 3.4% 22
T-T Telus Corp. 6.0% $23.78 -9.7% $1.43 7.3% 19
WCN-N Waste Connections 0.7% $140.68 6.8% $1.02 7.4% 13
Averages 3.3% 4.1% 8.4% 19

Six Canadian stocks on ‘The List’ declare earnings and dividends in US dollars and are inter-listed on a US exchange in US dollars. The simplest way to display dividend and price metrics for these stocks is to show their US exchange symbols along with their US dividends and price. The stocks I am referring to have a -N at the end of their symbols. You can still buy their Canadian counterparts (-T), but your dividends will be converted into CDN dollars and will fluctuate based on the exchange rate.

Note: When the dividend and share price currency match, the calculation is straightforward. But it’s not so simple when the dividend is declared in one currency, and the share price is quoted in another. Dividing the former by the latter would produce a meaningless result because it’s a case of apples and oranges. To calculate the yield properly, you must express the dividend and share price in the same currency.

Performance of ‘The List’

Feel free to click on this link, ‘The List’ for a sortable version from our website.

Last week, ‘The List’ was up with a YTD price return of +4.1% (capital). Dividend growth remained the same and is now at +8.4% YTD, highlighting growth in income over the past year.

The best performers last week on ‘The List’ were Alimentation Couche-Tard Inc. (ATD-T), up +5.67%; Telus Corp. (T-T), up +3.53%; and Canadian Utilities Limited (CU-T), up +2.91%.

Canadian Tire (CTC-A-T) was the worst performer last week, down -12.27%.


Dividend Increases

“The growth of dividend paying ability is of significance in the determination of a stock’s quality, or general safety…”

– Arnold Bernhard (the founder of Value Line)

“As a dividend increase is a positive sign of a company’s financial strength, the safest purchase, after research, is a stock with a recent dividend increase.”

– Tom Connolly (the founder of dividendgrowth.ca)

Last week, no dividend increases from companies on ‘The List’.


Earnings Releases

Benjamin Graham once remarked that earnings are the principal factor driving stock prices.

Each quarter we will provide readers with weekly earnings updates of stocks on ‘The List’ during the calendar earnings season. 

The updated earnings calendar can be found here.

Earnings growth and dividend growth tend to go hand in hand, so this information can tell us a lot about the future dividend growth of our quality companies. Monitoring our dividend growers periodically is part of the process, and reading the quarterly earnings releases is a good place to start.

No earnings reports from companies on ‘The List’ this week

Last week, eight companies on ‘The List’ reported earnings.

Franco Nevada (FNV-N) released its second-quarter fiscal 2023 results on Tuesday, August 8, 2023, after markets closed.

“Our portfolio continues to generate strong cash flows and high margins. The second quarter’s results benefited from our core assets returning to normal production and deliveries caught up from the disruptions in Q1. Revenue from our Diversified assets was impacted by lower oil, gas and iron ore prices compared to the relative highs of the prior year period. We expect Total GEOs for the year to be at the low end of our guidance range provided in March this year. We are looking forward to increased contributions from Cobre Panama, where the CP100 Expansion is on-track for year-end, and to contributions from royalties on several new mines. Franco-Nevada is debt-free and is growing its cash balances.”

– Paul Brink, Chief Executive Officer

Highlights:

  • In Q2 2023, we earned $329.9 million in revenue, down 6.4% from Q2 2022, as the impact of lower commodity prices for our Diversified assets more than offset the increase in revenue from our Precious Metal assets. With Cobre Panama and Antapaccay operating at full production levels following the temporary disruptions in early 2023, both assets generated strong deliveries in Q2 2023. Partly offsetting the impact of lower oil and gas prices, during the quarter, we received catch-up royalty payments of approximately $7.0 million related to new wells primarily at our Permian interests, which are not expected to reoccur.
  • Precious Metal revenue accounted for 78.6% of our revenue (64.8% gold, 10.7% silver, 3.1% PGM). Revenue was sourced 88.9% from the Americas (32.1% South America, 26.2% Central America & Mexico, 17.5% U.S. and 13.1% Canada).

Outlook:

Q2 Earnings Conference Call

Question: “Paul as you mentioned, you’re now targeting the lower end of the guidance range. If you kind of answered my question, but I just want to confirm. If I just look at your precious metals guidance, you’re actually tracking pretty well. So the fact that you’re targeting for total GEOs, the lower end. Is that really just due to lower sort of diversified prices, energy prices, iron ore prices? Or is that too simplistic of a way to look at it?

Answer: “You’re essentially correct. It’s — when we did our original guidance, the iron ore price we used was higher than what it’s averaged thus far in 2023 and what we’re using going forward, same with the energy prices. And so the other side, the gold price is higher than what we had in our original guidance. So you get a double impact on converting the non-gold revenue to GEOs, and that’s essentially the reason for guiding to the lower end.”

– Paul Brink, Chief Executive Officer

Source: (FNV-N) Q2-2023 Earnings Release


Metro (MRU-T) released its third-quarter fiscal 2023 results on Wednesday, August 9, 2023, before markets opened.

“We delivered solid results in the third quarter fueled by strong same-store sales and good operating leverage. With persistent food inflation, our teams did an excellent job to offer good value to our customers, resulting in market share gains and tonnage growth, driven by our discount food stores. Our loyalty program MOİ was successfully launched this quarter and we are pleased with the strong customer response so far. This enhanced program provides even more value to customers by offering multiple ways to earn and redeem points on food and pharmacy purchases in Québec. We are clearly disappointed with the current labour dispute in 27 of our Metro stores in the Greater Toronto Area given that we had reached a very good agreement that was unanimously recommended by union representatives. We look forward to a resolution and the re-opening of our stores as soon as possible, while ensuring the long-term competitiveness of our company.”

– Eric La Fleche, President and Chief Executive Officer

Highlights:

  • Sales of $6,427.5 million, up 9.6%
  • Food same-store sales up 9.4%
  • Pharmacy same-store sales up 5.9%
  • Net earnings of $346.7 million, up 26.1%, and adjusted net earnings of $314.8 million, up 10.9%
  • Fully diluted net earnings per share of $1.49, up 30.7%, and adjusted fully diluted net earnings per share of $1.35, up 14.4%

Outlook:

We remain focused on offering quality products at competitive prices as higher than normal inflation and market challenges persist. While we are not able to predict how the current macro-economic environment will evolve, we are seeing some moderation in food inflation, although it is still elevated compared to pre-pandemic levels. With this backdrop, we remain resilient and committed to providing the best value for our customers while delivering on our strategic priorities. In this respect, we look forward to the launch of our state-of-the-art, automated distribution center north of Montreal in the coming weeks.

Source: (MRU-T) Q3-2023 Earnings Release


Stella-Jones Inc. (SJ-T) released its second-quarter fiscal 2023 results on Wednesday, August 9, 2023, before markets opened.

“Stella-Jones is executing on its three-year growth plan with the achievement of another strong performance in the second quarter, reflecting the upward momentum generated by accelerating demand for our infrastructure-related products. Our second quarter results continued to benefit from higher pricing dynamics for utility poles, railway ties and industrial products, while residential lumber delivered sales in line with expectations.”

– Eric Vachon, President and Chief Executive Officer

Highlights:

  • Sales of $972 million, up 7%
  • 10% organic sales growth in infrastructure-related businesses
  • EBITDA of $175 million, or a margin of 18%, up from 17% in Q2 2022
  • Net income of $100 million, or $1.72 per share, up 14% from EPS in Q2 2022
  • Completed acquisitions and projects to seize growing utility pole demand

Outlook:

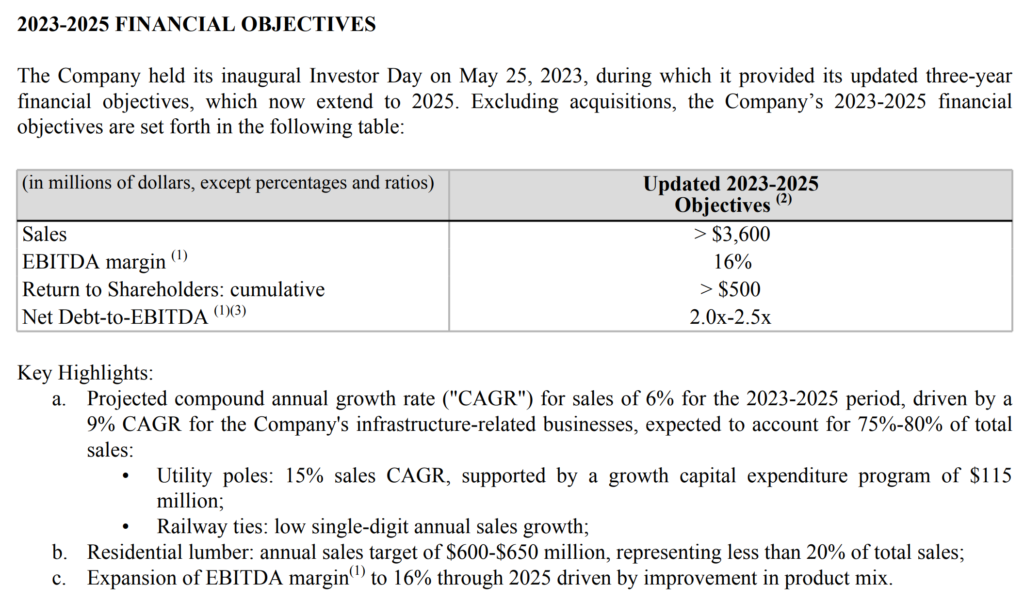
“In the second half of the year, we expect replenished railway tie inventory levels and ongoing capital projects for utility poles to facilitate anticipated volume gains, while our recent acquisitions of Balfour Pole Co. and Baldwin Pole and Pilings’ assets will further broaden the Company’s presence across North America. Our performance so far this year aligns with our plan to continue to grow our infrastructure-related businesses, increase profitability, as evidenced by the strong EBITDA margin generated in the second quarter, and to return capital and drive value for our shareholders. Managing capital projects, acquisitions and strong organic growth requires the resourcefulness and agility of our team of experts, and I am proud to recognize their invaluable contribution to our business.”

– Eric Vachon, President and Chief Executive Officer

Source: (SJ-T) Q2-2023 Earnings Release


Stantec (STN-T) released its second-quarter fiscal 2023 results on Wednesday, August 9, 2023, after markets closed.

“We continue to deliver significant growth in revenue and earnings driven by strong performance across all our regional and business operating units. As a result of our strong year-to-date results and our expectation of continued favorable market fundamentals for the remainder of the year, we are increasing our net revenue and adjusted earnings per share guidance for 2023.”

– Gord Johnston, President and Chief Executive Officer

Highlights:

Q2 2023 compared to Q2 2022

  • Net revenue increased 14.5% or $162.0 million to $1.3 billion, primarily driven by 11.2% organic growth. Double-digit organic growth was achieved in all regions and in Water, Environmental Services, and Energy & Resources businesses.
  • Project margin increased $91.3 million or 15.1% to $694.0 million. As a percentage of net revenue, project margin increased by 30 basis points to 54.3%.
  • Adjusted EBITDA increased $29.3 million or 15.7% to $216.0 million. Adjusted EBITDA margin increased by 20 basis points over Q2 2022 to 16.9%, despite a significant expense related to the revaluation of the Company’s LTIP, primarily due to strong share price appreciation in the quarter. Excluding the revaluation, adjusted EBITDA margin was 17.5%.
  • Net income increased 45.0%, or $27.3 million, to $88.0 million, and diluted EPS increased 43.6%, or $0.24, to $0.79, mainly due to strong net revenue growth, solid project margins, and lower administrative and marketing expenses as a percentage of net revenue.
  • Adjusted net income and adjusted diluted EPS achieved record highs in the quarter. Adjusted net income grew 18.1%, or $16.8 million, to $109.4 million, achieving 8.6% of net revenue (9.0% without the effect of the LTIP revaluation), and adjusted diluted EPS increased 19.3% to $0.99 ($1.04 without the effect of the LTIP revaluation).
  • Contract backlog increased to $6.6 billion at June 30, 2023, a record high reflecting 10.0% organic growth from December 31, 2022—with double-digit organic backlog growth in Stantec’s US and Canada operations as well as in Environmental Services and Water. Contract backlog represents approximately 13 months of work—an increase of one month from December 31, 2022.
  • Operating cash flows increased $35.4 million, with cash inflows of $31.0 million, reflecting strong revenue growth and operational performance. This compares to $4.4 million outflows in the comparative period, which resulted primarily from the Cardno financial system integration.
  • DSO1 was 81 days, consistent with December 31, 2022 and March 31, 2023.
  • On June 30, 2023, Stantec acquired Environmental Systems Design, Inc. (ESD), a 300-person firm headquartered in Chicago that provides building engineering services, specializing in mission critical and data center services.
  • Net debt to adjusted EBITDA (on a trailing twelve-month basis) at June 30, 2023 was 1.8x, remaining within Stantec’s internal target range of 1.0x to 2.0x, and reflecting the impact of funding the ESD acquisition on the last day of the reporting period.
  • On June 27, 2023, Stantec issued $250 million senior unsecured notes due June 27, 2030 that bear interest at a fixed rate of 5.393% per annum. These notes were assigned an investment-grade credit rating of BBB by DBRS Limited. Additionally, the Company entered into and fully drew upon an unsecured bilateral term credit facility of $100 million that matures on June 17, 2024. The proceeds of both the notes and new term facility were used to repay a portion of existing indebtedness on the revolving credit facility.

Outlook:

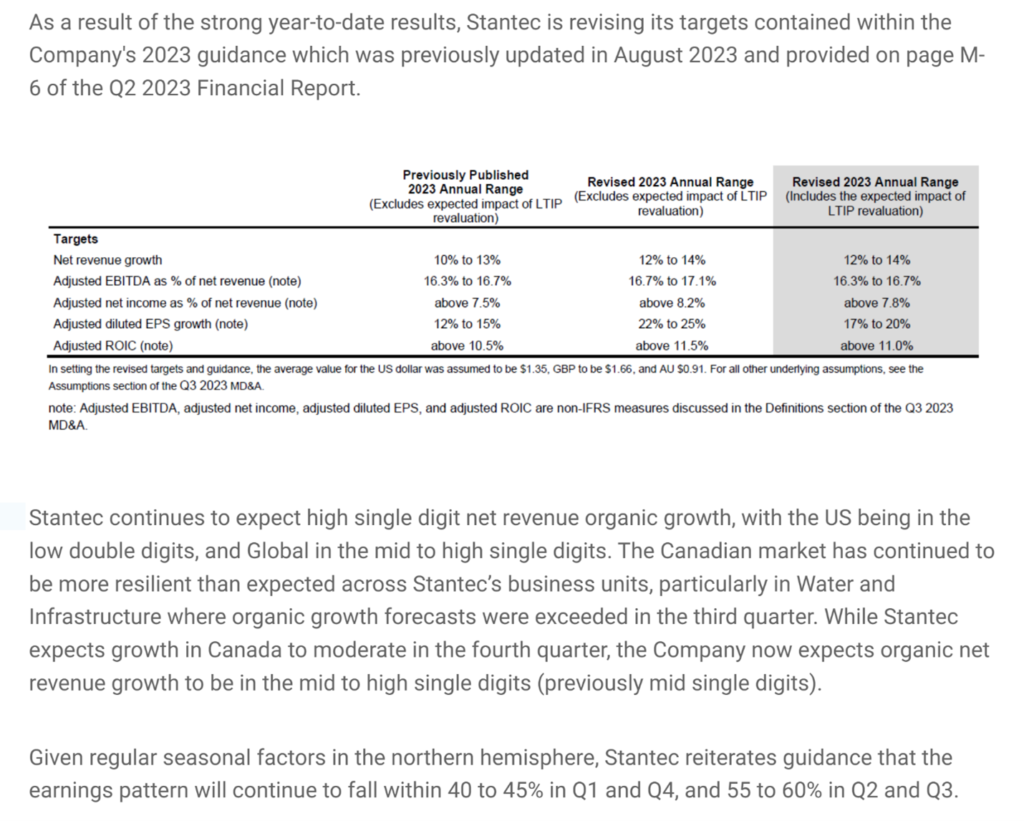
Stantec is revising and increasing certain targets contained within the Company’s 2023 guidance (provided on page M-10 in the 2022 Annual Report) based on the strength of the Company’s financial performance to date and the outlook for the balance of this year.

Stantec is raising its guidance for net revenue and adjusted diluted EPS growth and narrowing the target range for adjusted EBITDA as a percentage of net revenue.

Source: (STN-T) Q2-2023 Earnings Release


CCL Industries (CCL-B-T) released its second-quarter fiscal 2023 results on Wednesday, August 9, 2023, after markets closed.

“Solid second quarter results were held by slowing demand in parts of the economy as higher interest rates took hold impacting consumer spending patterns. Avery and Checkpoint both continued to post organic growth, but more than offset by a modest decline in the CCL Segment and the pass through of energy, freight and raw materials deflation at Innovia.”

– Geoffrey T. Martin, President and Chief Executive Officer

Highlights:

  • Net earnings decreased 4.6% to $155.9 million for the 2023 second quarter compared to $163.4 million for the 2022 second quarter. Basic and adjusted basic earnings per Class B share for the 2023 second quarter were $0.88 and $0.90, respectively, compared to basic and adjusted basic earnings per Class B share of $0.91 and $0.94, respectively, in the prior year second quarter. Foreign currency translation had a positive $0.05 per share impact on earnings.
  • Sales for the second quarter of 2023 increased 1.8% to $1,644.5 million, compared to $1,615.2 million for the second quarter of 2022, with an organic decline of 4.5% offset by acquisition related growth of 1.0% and a 5.3% positive impact from foreign currency translation.
  • Operating income for the second quarter of 2023 was $242.0 million compared to $247.8 million for the comparable quarter of 2022. Operating income for the 2022 second quarter included a $3.5 million non-cash acquisition accounting adjustment related to the acquired inventory from the Adelbras acquisition that was expensed in the Company’s cost of sales in the period. Foreign currency translation had a 5.8% positive impact on operating income for the comparable quarters.
  • The Company recorded an expense for restructuring and other items of $2.9 million, primarily attributable to reorganization charges at CCL Design and transaction costs associated with acquisitions completed in the current year compared to $3.2 million for reorganization costs in the 2022 second quarter.
  • Tax expense for the second quarter of 2023 was $47.7 million compared to $51.7 million in the prior year period. The effective tax rate for the 2023 second quarter was 24.0%, lower than the 24.4% for the 2022 second quarter due to a higher portion of the Company’s taxable income earned in lower tax jurisdictions.

CCL

  • Sales increased 3.1% to $995.5 million on 3.0% organic decline, offset by 0.3% acquisition contribution and 5.8% positive impact from foreign currency translation
  • Regional organic sales growth: low single digit in Europe and Latin America; North America and Asia Pacific declined low single digit and double digit, respectively
  • Operating income $144.0 million, down 7.0%, 14.5% operating margin down 150 bps
  • Label joint ventures added $0.03 earnings per Class B share

Avery

  • Sales increased 13.3% to $268.0 million on 2.6% organic growth, 5.6% acquisition contribution and 5.1% positive impact from foreign currency translation
  • Operating income $50.3 million, up 7.2%, 18.8% operating margin, down 100 bps

Checkpoint

  • Sales increased 6.8% to $210.5 million on organic growth of 3.3% and 3.5% positive impact from foreign currency translation
  • Operating income $28.1 million, up 24.3%, 13.3% operating margin, up 180 bps

Innovia

  • Sales decreased 21.2% to $170.5 million with 26.6% organic decline partially offset by 5.4% postive impact from foreign currency translation
  • Operating income $19.6 million, down 16.2%, 11.5% operating margin, up 70 bps

Outlook:

  • Core CCL business units’ face slower volume at many consumer packaged goods customers
  • CCL Design: expect modest improvement by Q4 as comps ease, computer industry demand slowly recovers and new business wins kick in
  • CCL Secure demand picture unchanged for second half
  • Avery solid, back to school replenishment orders the only unknown
  • Checkpoint: favorable as inflation recovery and RFID strength continue
  • Innovia volume expected to slowly recover in second half, inflation benign
  • FX tailwind to continue at current exchange rates

Source: (CCL-B-T) Q2-2023 Earnings Release


Algonquin Power & Utilities (AQN-T) released its second-quarter fiscal 2023 results on Thursday, August 10, 2023, before markets opened.

“While our second quarter 2023 results were negatively impacted by unfavourable weather, we remain focused on our growth outlook and long-term success.” 

– Chris Huskilson, Interim Chief Executive Officer

Highlights:

  • Revenue of $627.9 million, an increase of 1%;
  • Adjusted EBITDA1 of $277.7 million, a decrease of 4%;
  • Adjusted Net Earnings of $56.2 million, a decrease of 49%; and
  • Adjusted Net Earnings per common share of $0.08, a decrease of 50%, in each case on a year-over-year basis.

Outlook:

Algonquin Brief: Chris Huskilson Appointed Interim CEO, Succeeding Arun Banskota; Board Commencing Search for a Permanent CEO

Following a strategic review, the company determined that focusing on the regulated business and going forward with a sale of the renewable business is the best path forward.

The company expects to sell the renewables business as a whole rather than in parts as management sees significant value in the development pipeline.

“We believe the value of our assets is not fully realized in our current structure. We therefore determined that focusing on our regulated business going forward and pursuing a sale of the renewables business is the best path forward for AQN.”

– Chris Huskilson, Interim Chief Executive Officer

Source: (AQN-N) Q2-2023 Earnings Release


Canadian Tire (CTC-A-T) released its second-quarter fiscal 2023 results on Thursday, August 10, 2023, before markets opened.

“As inflation persisted and rate hikes continued, consumer demand for discretionary goods softened, particularly in the latter half of the quarter, and Canadians shifted to more essentials within our multi-category assortment. Loyalty sales continue to outperform non-member spend, driving an increase in loyalty penetration. During this time of macroeconomic uncertainty, Triangle Rewards remains our most important driver in delivering value for our customers.”

– Greg Hicks, President and Chief Executive Officer

Highlights:

  • Consolidated comparable sales were up 0.1%, following strong growth of 5.0% in Q2 2022
  • Normalized diluted Earnings Per Share (“EPS”) was $3.08, compared to $3.11 in Q2 2022; Diluted EPS was $1.76, compared to $2.43 in Q2 2022
  • Loyalty sales as a percentage of retail sales up 80 bps in the quarter

Outlook:

The current macroeconomic environment and consumer demand differ significantly from the Company’s expectations when it set out its strategy and 2022-2025 financial aspirations (average annual Comparable sales growth, Retail Return on Invested Capital and Diluted EPS) at its Investor Day in March 2022. Since early 2022, the cumulative effect of increasing inflationary pressure and higher interest rates on consumer spend and financing costs, along with higher inventory costs, has significantly impacted the Company’s ability to deliver against its previous expectations. Given the slower pacing of growth, and the noticeable slowdown in retail sales during the second quarter of 2023, the Company is withdrawing its previously disclosed financial aspirations at this time.

Despite the near-term consumer demand environment, the Company remains committed to pursuing the strategic objectives that demonstrate its long-term vision and build on its strong market position. The Company also continues to invest in the strategic initiatives outlined in the Better Connected strategy to grow earnings, and continues to make progress on the key initiatives highlighted above, to solidify CTC’s brand and competitive positioning in Canada over the long-term.

Source: (CTC-A-T) Q2-2023 Earnings Release


Emera Inc. (EMA-T) released its second-quarter fiscal 2023 results on Friday, August 11, 2023, before markets opened.

“Our team continues to execute well on our proven strategy and despite the continued headwinds of high interest rates and overall inflationary pressures, we are driving solid results for customers and shareholders. As economic growth continues in our service territories, we remain focused on meeting growing demand and achieving a balanced energy transition that delivers increasingly clean energy while maintaining grid reliability and continues to consider cost impacts for customers, all while providing predictable, reliable earnings and cash flow growth for our shareholders.”

– Scott Balfour, President and Chief Executive Officer

Highlights:

  • Quarterly adjusted EPS increased $0.01 to $0.60 compared to $0.59 in Q2 2022. Quarterly reported net income per common share increased $0.35 to $0.10 in Q2 2023 compared to a net loss per common share of $(0.25) in Q2 2022 due to lower mark-to-market (“MTM”) losses.
  • Year-to-date, adjusted EPS increased $0.07 or 5% to $1.58 compared to $1.51 in 2022. Year-to-date reported EPS increased by $1.05 to $2.17 from $1.12 in 2022 due to MTM gains in 2023 compared to MTM losses in 2022.
  • Adjusted EPS contributions from our regulated utilities increased 8% for the quarter and 3% year-to-date primarily driven by rate supported capital investments and continued customer growth partially offset by higher interest expense and less favourable weather. On a consolidated basis these increases were partially offset by higher corporate interest expense and lower contributions from Emera Energy Services (“EES”) during the quarter.
  • On track to deploy $2.8 billion in capital in 2023 with $1.4 billion invested in the first half of the year.

Outlook:

There have been no material changes in Emera’s business overview and outlook from the Company’s 2022 annual MD&A other than the updates as disclosed below. Emera’s year-to-date results have been impacted by macroeconomic conditions, specifically higher interest rates as well as other impacts of inflation. These macroeconomic conditions are likely to continue for the near term. For information on general economic risk, including interest rate and inflation risk, refer to the “Enterprise Risk and Risk Management – General Economic Risk” in Emera’s 2022 annual MD&A. For details on Emera’s reportable segments, refer to note 1 of the Q2 2023 unaudited condensed consolidated interim financial statements.

Source: (EMA-T) Q2-2023 Earnings Release


MP Market Review – August 04, 2023

Last updated by BM on August 07, 2023

Summary 

  • This is a weekly installment of our MP Market Review series, which provides updates on the financial markets and Canadian dividend growth companies we monitor on ‘The List’.
  • Last week, ‘The List’ was down with a YTD price return of +3.9% (capital). Dividend growth remained the same and is now at +8.4% YTD, highlighting growth in income over the past year.
  • Last week, no dividend increases from companies on ‘The List’.
  • Last week, nine earnings reports from companies on ‘The List’.
  • Eight companies on ‘The List’ are due to report earnings this week.
  • If you’re interested in creating your own dividend growth income portfolio, consider subscribing to our premium service, which grants you access to the MP Wealth-Builder Model Portfolio (CDN) and exclusive subscriber-only content.  Learn More         

Identifying companies whose dividend growth aligns closely with price growth can considerably enhance the predictability of future returns. Dividend growth investors know that the dividend drives the price in a predictable way, not the other way around. Waste Connections (WCN-T) is another company on ‘The List’ that follows this dividend growth principle.

Introduction

“You have a pair of pants. In the left pocket, you have $100. You take $1 out of the left pocket and put it in the right pocket. You now have $101. There is no diminution of dollars in your left pocket. That is one magic pair of pants.”

This ‘magic pants’ analogy was from a Seeking Alpha article on dividend investing I read about a decade ago and was one of the catalysts for me to take a closer look at this type of investing and see if it truly was magical. 

After conducting additional research, I have shifted towards utilizing a dividend growth investing (DGI) strategy as my primary investment approach. While I maintain portfolios consisting of high-quality dividend growers from both the United States and Canada, I have opted to concentrate on Canadian (CDN) dividend growth companies in this blog. This is due to several reasons, including a smaller pool of DGI companies to track, a lack of coverage for the DGI strategy by the North American investment media, and a tendency for those who do cover DGI to narrowly focus on only a handful of sectors (Energy and Financials).

While ‘The List’ is not a portfolio in itself, it serves as an excellent initial reference for individuals seeking to diversify their investments and attain higher returns in the Canadian stock market. Through our blog, we provide weekly updates on ‘The List’ and offer valuable perspectives and real-life examples of the dividend growth investing strategy in practice. This helps readers gain a deeper understanding of how to implement and benefit from this investment approach.


DGI Thoughts

“I do believe it is possible for a minority of investors to get significantly better results than average. Two conditions are necessary for that. One is that they must follow some sound principles of selection that are related to the value of securities and not to their market price. The other is that their method of operation must be basically different from that of the majority of security buyers. They have to cut themselves off from the general public and put themselves into a different category.”

– Benjamin Graham, The Intelligent Investor, 1949

The above quote is found on our blog’s ‘About’ page, as it is one of the reasons we embraced the dividend growth strategy years ago. By doing so, we were able to “cut ourselves off from the general public and put ourselves into a different category.” It is interesting to find a quote written almost seventy-five years ago still relevant today as per a recent study in the Financial Analysts Journal earlier this year.

This is why stock picking is so hard – and index investing so easy – for favourable returns (Globe & Mail)

https://www.theglobeandmail.com/investing/investment-ideas/article-positive-skewness-shows-how-just-a-few-stocks-enhance-index-returns/

The article referenced in the Globe & Mail, and featured in the most recent issue of the Financial Analysts Journal (Spring 2023) proposes that market index returns are predominantly characterized by positive skewness. The article further emphasizes the high level of risk associated with deviating from the benchmark index weights assigned to individual stocks unless one possesses distinctive proprietary insights.

Graham’s version of ‘proprietary insights’ would be those investors who follow some sound principles of selection that are related to the value of securities and not to their market price and where their method of operation is different from that of the majority of security buyers.

The study goes on to say… “The wealth created by stock markets is largely attributable to large positive outcomes to relatively few stocks. Investors without a comparative advantage in identifying these few stocks are better off in a broad-based index fund.”

In our dividend growth investing strategy, we can identify the few stocks the study speaks of. Quality companies with a dividend growth record of many years skew the probability of a successful outcome in our favour. Owning the few and not the many is how we have outperformed the indexes for many decades.

The study also questions whether you need to pay for an actively managed equity portfolio at all. We tend to agree. Unless your wealth manager can consistently outperform the index (after fees), what is the point.

If you have not yet joined as a paid subscriber of the blog to receive DGI Alerts on the activity and content related to our model portfolio, it’s not too late. Click Here. 

Recent News 

TC Energy has a plan for recovery. Here’s why investors should pay attention (Globe & Mail)

https://www.theglobeandmail.com/investing/markets/inside-the-market/article-tc-energy-has-a-plan-for-recovery-heres-why-investors-should-pay/

According to the author there are at least four reasons to consider buying the stock at its beaten-up lows:

  1. The dividend yield is near the high end of its historical range and appears safe according to its payout ratio. The company also reiterated in its most recent earnings report that it plans to raise the dividend between 3-5 percent through the end of 2026.
  2. The stock is sensibly priced.
  3. All pipelines are going through the same negative sentiment in the media.
  4. The announced spin-off of its oil and natural gas pipelines might actually be a good idea.

We agree and have been buying TC Energy on the way down for our model portfolio. In the short term, we will be happy to collect the above-average and growing dividend.

To receive breaking news about companies on ‘The List’ follow us on Twitter @MagicPants_DGI.

The List (2023)

Last updated by BM on August 04, 2023

The Magic Pants List contains 27 Canadian dividend growth stocks. ‘The List’ contains Canadian companies that have raised their dividend yearly for at least the last ten years and have a market cap of over a billion dollars. Below is each stock’s symbol, name, current yield, current price, price return year-to-date, current dividend, dividend growth year-to-date and current dividend growth streak. Companies on ‘The List’ are added or subtracted once a year, on January 1. After that, ‘The List’ is set for the next twelve months. Prices and dividends are updated weekly.

SYMBOL COMPANY YLD PRICE YTD % DIV YTD % STREAK
AQN-N Algonquin Power & Utilities 6.5% $7.76 15.3% $0.51 -29.0% 12
ATD-T Alimentation Couche-Tard Inc. 0.8% $65.99 9.7% $0.56 19.1% 13
BCE-T Bell Canada 6.8% $56.28 -6.6% $3.82 5.0% 14
BIP-N Brookfield Infrastructure Partners 4.4% $32.75 5.2% $1.44 6.3% 15
CCL-B-T CCL Industries 1.7% $61.85 6.5% $1.06 10.4% 21
CNR-T Canadian National Railway 2.0% $156.45 -3.9% $3.16 7.8% 27
CTC-A-T Canadian Tire 3.9% $178.75 21.9% $6.90 17.9% 12
CU-T Canadian Utilities Limited 5.7% $31.22 -15.5% $1.79 1.0% 51
DOL-T Dollarama Inc. 0.3% $85.54 7.1% $0.27 23.8% 12
EMA-T Emera 5.4% $51.04 -3.0% $2.76 3.0% 16
ENB-T Enbridge Inc. 7.4% $48.08 -9.8% $3.55 3.2% 27
ENGH-T Enghouse Systems Limited 3.0% $28.15 -21.2% $0.85 18.2% 16
FNV-N Franco Nevada 1.0% $139.96 1.3% $1.36 6.3% 15
FTS-T Fortis 4.2% $53.74 -2.9% $2.26 4.1% 49
IFC-T Intact Financial 2.2% $196.70 0.5% $4.40 10.0% 18
L-T Loblaws 1.5% $115.90 -3.7% $1.74 10.3% 11
MGA-N Magna 3.0% $60.90 5.9% $1.84 2.2% 13
MRU-T Metro 1.7% $69.90 -7.4% $1.21 10.0% 28
RY-T Royal Bank of Canada 4.2% $128.25 0.2% $5.34 7.7% 12
SJ-T Stella-Jones Inc. 1.4% $67.05 35.2% $0.92 15.0% 18
STN-T Stantec Inc. 0.8% $90.55 38.6% $0.77 8.5% 11
TD-T TD Bank 4.4% $86.40 -1.4% $3.84 7.9% 12
TFII-N TFI International 1.1% $131.23 31.1% $1.40 29.6% 12
TIH-T Toromont Industries 1.5% $113.00 15.6% $1.68 10.5% 33
TRP-T TC Energy Corp. 7.7% $48.19 -9.6% $3.69 3.4% 22
T-T Telus Corp. 6.2% $22.97 -12.7% $1.43 7.3% 19
WCN-N Waste Connections 0.7% $141.96 7.8% $1.02 7.4% 13
Averages 3.3% 3.9% 8.4% 19

Six Canadian stocks on ‘The List’ declare earnings and dividends in US dollars and are inter-listed on a US exchange in US dollars. The simplest way to display dividend and price metrics for these stocks is to show their US exchange symbols along with their US dividends and price. The stocks I am referring to have a -N at the end of their symbols. You can still buy their Canadian counterparts (-T), but your dividends will be converted into CDN dollars and will fluctuate based on the exchange rate.

Note: When the dividend and share price currency match, the calculation is straightforward. But it’s not so simple when the dividend is declared in one currency, and the share price is quoted in another. Dividing the former by the latter would produce a meaningless result because it’s a case of apples and oranges. To calculate the yield properly, you must express the dividend and share price in the same currency.

Performance of ‘The List’

Feel free to click on this link, ‘The List’ for a sortable version from our website.

Last week, ‘The List’ was down with a YTD price return of +3.9% (capital). Dividend growth remained the same and is now at +8.4% YTD, highlighting growth in income over the past year.

The best performers last week on ‘The List’ were TC Energy Corp. (TRP-T), up +6.50%; TFI International (TFII-N), up +2.93%; and Stantec Inc. (STN-T), up +1.93%.

Brookfield Infrastructure Partners (BIP-N) was the worst performer last week, down -7.17%.


Dividend Increases

“The growth of dividend paying ability is of significance in the determination of a stock’s quality, or general safety…”

– Arnold Bernhard (the founder of Value Line)

“As a dividend increase is a positive sign of a company’s financial strength, the safest purchase, after research, is a stock with a recent dividend increase.”

– Tom Connolly (the founder of dividendgrowth.ca)

Last week, no dividend increases from companies on ‘The List’.


Earnings Releases

Benjamin Graham once remarked that earnings are the principal factor driving stock prices.

Each quarter we will provide readers with weekly earnings updates of stocks on ‘The List’ during the calendar earnings season. 

The updated earnings calendar can be found here.

Earnings growth and dividend growth tend to go hand in hand, so this information can tell us a lot about the future dividend growth of our quality companies. Monitoring our dividend growers periodically is part of the process, and reading the quarterly earnings releases is a good place to start.

Eight earnings reports from companies on ‘The List’ this week

Franco Nevada (FNV-N) will release its second-quarter fiscal 2023 results on Tuesday, August 8, 2023, after markets close.

Metro (MRU-T) will release its third-quarter fiscal 2023 results on Wednesday, August 9, 2023, before markets open.

Stella-Jones Inc. (SJ-T) will release its second-quarter fiscal 2023 results on Wednesday, August 9, 2023, before markets open.

Stantec (STN-T) will release its second-quarter fiscal 2023 results on Wednesday, August 9, 2023, after markets close.

CCL Industries (CCL-B-T) will release its second-quarter fiscal 2023 results on Wednesday, August 9, 2023, after markets close.

Algonquin Power & Utilities (AQN-T) will release its second-quarter fiscal 2023 results on Thursday, August 10, 2023, before markets open.

Canadian Tire (CTC-A-T) will release its second-quarter fiscal 2023 results on Thursday, August 10, 2023, before markets open.

Emera Inc. (EMA-T) will release its second-quarter fiscal 2023 results on Friday, August 11, 2023, before markets open.

Last week, nine companies on ‘The List’ reported earnings.

TFI International (TFII-N) released its second-quarter fiscal 2023 results on Monday, July 31, 2023, after markets closed.

“Despite a difficult freight market and reduced volumes industrywide, our results reflect the quality of our operations and our team’s skill in responding to rapidly changing market conditions. We produced solid operating ratios across all our business segments while again generating more than $200 million in net cash from operating activities. During challenging times for our industry, TFI International’s relentless focus on our longstanding operating principles, our business line diversity and niche positioning, and our ongoing progress on multiple self-help initiatives are what differentiates our performance and future potential. TFI’s strong financial foundation and focus on profitability and cash flow is allowing us to remain strategic in our allocation of capital, remaining active in M&A including seven completed acquisitions year to date, while also returning capital to shareholders through both our dividend, with our Board approving a 30% increase over the past year, and our opportunistic share repurchases. I wish to thank the talented men and women of TFI for their hard work in our continual quest to create shareholder value.”

– Alain Bedard, President and Chief Executive Officer

Highlights:

  • Second quarter operating income of $192.4 million compares to $391.0 million the same quarter last year, primarily reflecting reduced freight volumes, $60.6 million reduction in gains on sale of real estate assets held for sale, $5.8 million of IT systems and related transition expenses in U.S. LTL, $5.3 million unfavorable variance in the MTM of DSUs, $6.1 million unfavorable currency translation impact1 relative to the same period last year and $23.0 million from the divestiture of CFI.
  • Net income of $128.2 million compares to $276.8 million in Q2 2022. Diluted earnings per share (diluted “EPS”) of $1.47 compares to $3.00 in Q2 2022, due in part to the elements discussed above.
  • Adjusted net income , a non-IFRS measure, of $138.9 million compares to $241.1 million in Q2 2022, due in part to the elements discussed above.
  • Adjusted diluted EPS , a non-IFRS measure, of $1.59 compares to $2.61 in Q2 2022, due in part to the elements discussed above.
  • Net cash from operating activities of $200.4 million compares to $247.8 million in Q2 2022.
  • Free cash flow , a non-IFRS measure, of $138.1 million compares to $309.6 million in Q2 2022, with the decrease primarily driven by lower freight volumes and $89.5 million in sales of real estate in the prior year period.
  • The Company’s reportable segments performed as follows:
    • Package and Courier operating income decreased 26% to $27.1 million;
    • Less-Than-Truckload operating income decreased 57% to $80.7 million, driven primarily by weaker volume and a $54.6 million gain on real estate in the prior year quarter;
    • Truckload operating income decreased 48% to $66.2 million, driven partially by the divested CFI operations that had contributed $22.8 million in the prior year quarter, as well as a gain on sale of real estate of $6.2 million in the prior year quarter; and
    • Logistics operating income decreased 22% to $32.9 million.
  • During the quarter, TFI International acquired SM Freight which will operate in the TL segment, Launch Logistics which will operate in the Logistics segment and Placements Jonadagi which will operate in the TL segment. Subsequent to quarter end TFI International completed the acquisition of Siemens Transportation Group which will operate in the LTL segment.

Outlook:

The North American economic growth forecast from leading economists remains subdued and uncertain due to a variety of factors including elevated interest rates, high inflation, labor shortages, global supply chain challenges, and slower growth in many international markets. Despite reduced freight volumes industrywide, TFI International’s diversity across industrial and consumer end markets and across many modes of transportation, along with the Company’s disciplined approach to operations, helped support results during the second quarter. However, macro conditions have slowed and the possibility of economic recession over the coming year remains.

TFI International remains vigilant in its monitoring for new potential risks that could cause further economic disruption, resulting in additional rounds of declining freight volumes and higher costs that could adversely affect TFI’s operating companies and the markets they serve. Lower diesel prices in the months ahead could cause a continued earnings headwind. Other uncertainties include but are not limited to geopolitical risk such as the ongoing war in Ukraine, weakening labor market conditions and reduced consumer sentiment that can affect end market demand, policy changes surrounding international trade, environmental mandates, interest rate policies and changes to the tax code in any jurisdictions in which TFI International operates.

While North American economic uncertainty is likely to continue weighing on freight demand dynamics, management believes the Company is well positioned to navigate these difficult operating conditions, benefiting from its financial foundation and strong cash flow that allows for a strategic approach to the business. The Company strives for a lean cost structure and has a longstanding focus on profitability, efficiency, network density, customer service, optimal pricing, driver retention, and capacity rationalization. TFI also continues to have material synergy opportunities related to the 2021 acquisition of TForce Freight and has opportunities to enhance performance within most of its other operations. Longer term, TFI’s diverse industrial exposure through its specialized TL and LTL segments should continue to benefit from a gradual shift toward domestic manufacturing, while its P&C and Logistics business segments should benefit over the long term from the expansion of e-commerce.

Regardless of the operating environment, management’s goal is to build shareholder value through consistent adherence to its operating principles, including customer focus, an asset-light approach, and continual efforts to enhance efficiencies. In addition, TFI International values free cash flow generation and strong liquidity with a conservative balance sheet that features a high portion of attractive fixed-rate spreads and limited near-term debt maturities. This strong financial footing allows the Company to prudently invest and pursue select, accretive acquisitions while returning excess capital to shareholders.

Source: (TFII-N) Q2-2023 Earnings Release


Fortis (FTS-T) released its second-quarter fiscal 2023 results on Wednesday, August 2, 2023, before markets opened.

“We are pleased to report our second quarter results which reflect the growth of our utilities as they continue to execute the 2023 capital plan. Our strong financial results demonstrate the success of our regulated growth strategy, and the sale of Aitken Creek, expected to close later this year, reflects our focus on that strategy.

From an operational perspective, our systems performed well during the quarter, even when faced with extreme weather events in Western Canada. Our 2023 Sustainability Report, released today, highlights progress on our climate, diversity and other ESG priorities. The foundation of our sustainability strategy is to deliver cleaner energy to our customers by making investments in a safe, reliable energy grid without compromising on affordability.”

– David Hutchens, President and Chief Executive Officer

Highlights:

  • Second quarter net earnings of $294 million or $0.61 per common share, up from $284 million or $0.59 per common share in 2022
  • Adjusted net earnings per common share of $0.62, up from $0.57 in the second quarter of 2022
  • Capital expenditures of $2.0 billion in the first half of 2023; $4.3 billion annual capital plan on track
  • 2023 Sustainability Update Report released highlighting the Corporation’s progress on key sustainability initiatives
  • Tucson Electric Power’s rate application continues to progress with a decision anticipated in Q3

Outlook:

Fortis continues to enhance shareholder value through the execution of its capital plan, the balance and strength of its diversified portfolio of regulated utility businesses, and growth opportunities within and proximate to its service territories. While energy price volatility, global supply chain constraints, increasing interest rates and inflation represent potential concerns, the Corporation does not expect these factors to have a material impact on its operations or financial results in 2023.

Fortis is executing on the transition to a cleaner energy future and is on track to achieve its corporate-wide targets to reduce GHG emissions by 50% by 2030 and 75% by 2035. The Corporation’s additional 2050 net-zero direct GHG emissions target reinforces Fortis’ commitment to further decarbonize over the long-term, while preserving customer reliability and affordability.

The Corporation’s $22.3 billion five-year capital plan is expected to increase midyear rate base from $34.1 billion in 2022 to $46.1 billion by 2027, translating into a five-year compound annual growth rate of 6.2%.

Beyond the five-year capital plan, additional opportunities to expand and extend growth include: further expansion of the electric transmission grid in the U.S. to facilitate the interconnection of cleaner energy, including infrastructure investments associated with the Inflation Reduction Act of 2022 and the Midcontinent Independent System Operator, Inc. long-range transmission plan; climate adaptation and grid resiliency investments; renewable gas solutions and liquefied natural gas infrastructure in British Columbia; and the acceleration of cleaner energy infrastructure investments across our jurisdictions.

Fortis expects its long-term growth in rate base will drive earnings that support dividend growth guidance of 4-6% annually through 2027, and is premised on the assumptions and material factors listed under “Forward-Looking Information”.

Source: (FTS-T) Q2-2023 Quarterly Report


Waste Connections (WCN-N) released its second-quarter fiscal 2023 results on Wednesday, August 2, 2023, after markets closed.

“We are extremely pleased by the strength of operational execution during the quarter for a solid beat on revenue and adjusted EBITDA to deliver margins 30 basis points above our outlook.  Solid waste core pricing growth of 9.8% positioned us to expand underlying solid waste collection, transfer and disposal margins by one hundred basis points in the period, largely overcoming the ongoing headwinds from year-over-year declines in recovered commodity values and continued inflationary pressures during the period.

Our performance in the first half of 2023, along with recent acquisitions and reduced headwinds from fuel and other commodity-related impacts, positions us to increase our full year outlook for adjusted EBITDA to approximately $2.525 billion, expanding our adjusted EBITDA margin to 31.5%, up 40 basis points from our initial outlook and up 70 basis points as compared to the prior year.

The strength of our results reflects our focus on quality of revenue through the shedding of low margin volumes and furthered by strategic acquisitions, including Arrowhead, a $100 million revenue integrated transportation and disposal network with rail access providing enhanced internalization opportunities to our operations across the Northeast.  Already having completed acquisitions with over $160 million in annualized solid waste revenue year to date, we see plenty of runway and opportunity for continued activity throughout the balance of the year.  Most importantly, we are encouraged by improving trends in safety and employee retention, as we double down on human capital in our decentralized operating model, including through the realignment of our organizational structure with the addition of a sixth region and refinements to our corporate operational structure, and we look forward to driving outsized margin expansion in the second half of 2023 and into 2024.””

– Ronald J. Miittelstaedt, President and Chief Executive Officer

Highlights:

  • Top-to-bottom beat led by solid execution in Q2 sets up increases to full year 2023 outlook
  • Revenue of $2.021 billion, above outlook and up 11.3% year over year
  • Net income of $209.2 million, and adjusted EBITDA of $628.9 million, above outlook
  • Adjusted EBITDA margin of 31.1% of revenue, 30bps above outlook
  • Net income of $0.81 per share, and adjusted net income of $1.02 per share
  • Year to date net cash provided by operating activities of $1.017 billion and adjusted free cash flow of $630.0 million, or 16.1% of revenue
  • Year to date closed acquisitions with over $160 million of total annualized revenue, including Arrowhead Environmental Holdings, LLC (“Arrowhead”), the largest integrated waste-to-rail disposal network in the Northeast U.S.
  • Updates full year 2023 outlook to net income of approximately $931 million, increasing adjusted EBITDA to approximately $2.525 billion or 31.5% on revenue of approximately $8.025 billion

Outlook:

Waste Connections also updated its outlook for 2023, which assumes no change in the current economic environment or underlying economic trends.  The Company’s outlook excludes any impact from additional acquisitions that may close during the year, and expensing of transaction-related items.  The outlook provided below is forward looking, and actual results may differ materially depending on risks and uncertainties detailed at the end of this release and in our periodic filings with the U.S. Securities and Exchange Commission and the securities commissions or similar regulatory authorities in Canada. Certain components of the outlook for 2023 are subject to quarterly fluctuations.  See reconciliations in the attached tables.

  • Revenue is estimated to be approximately $8.025 billion, down $25 million from our original outlook to reflect a reduction in fuel and material surcharges of $35 million as a result of lower fuel costs.
  • Net income is estimated to be approximately $931.0 million, and adjusted EBITDA is estimated to be approximately $2.525 billion, or about 31.5% of revenue, as compared to our original outlook for adjusted EBITDA of $2.500 billion or 31.1% of revenue.
  • Capital expenditures are estimated to be approximately $950 million, up $25 million from our original outlook.
  • Net cash provided by operating activities is estimated to be approximately $2.141 billion, and adjusted free cash flow is estimated to be approximately $1.225 billion, or about 15.3% of revenue.

Source: (WCN-N) Q2-2023 Results


Intact Financial (IFC-T) released its second-quarter fiscal 2023 results on Wednesday, August 2, 2023, after markets closed.

“With multiple severe weather events this quarter, our employees were often first on site in affected communities, offering a reassuring presence and support to customers in a time of need. Despite the scale of the fire, flood, and freeze events, we maintained a strong balance sheet and delivered a 13% operating ROE, a testament to the resilience of our operations. We will continue to leverage our experience with natural disasters to collaborate with governments and help communities adapt to climate change.”

– Charles Brindamour, Chief Executive Officer

Highlights:

  • Operating DPW growth of 6% in Q2-2023 driven by rate actions in supportive market conditions
  • Net operating income per share decreased 30% to $2.30, largely due to an increase in catastrophe losses to $421 million, partially offset by higher investment income
  • EPS of $1.30 was lower than last year, which had benefited from the sale of Codan Denmark and large gains on equity investments
  • Combined ratio of 92.2% (96.3% undiscounted) included 8 points of catastrophe losses that were twice as high as expected, while underlying performance was strong in all geographies
  • Personal auto results were strong at a 91.2% combined ratio , reflecting our profitability actions and moderating inflation
  • Operating ROE of 12.8% (and ROE of 9.0%) despite elevated catastrophe losses and $2.5 billion of total capital margin

Outlook:

  • Over the next twelve months, we expect the firm-to-hard insurance market conditions to continue in most lines of business, driven by inflation, natural disasters, and a hard reinsurance market.
  • In Canada, we expect firm-to-hard market conditions in personal lines. Both personal property and auto premiums are expected to grow by high single-digits in response to inflation and evolving driving patterns.
  • In commercial and specialty lines across all geographies, we expect hard market conditions to continue in most lines of business.
  • In the UK&I , the personal property market is firming, with further rate increases expected.

Source: (IFC-T) Q2-2023 Quarterly Results


Brookfield Infrastructure Partners (BIP-N) released its second-quarter fiscal 2023 results on Thursday, August 3, 2023, before markets opened.

“Our business showcased its resilience during the second quarter, providing strong financial and operational results. We have also already accomplished most of our current year strategic initiatives, exceeding our annual deployment target and successfully executing our capital recycling program, with $1.9 billion in asset sales this year.”

– Sam Pollock, Chief Executive Officer

Highlights:

  • Brookfield Infrastructure reported net income of $378 million for the three month period ended June 30, 2023 compared to net income of $176 million in the prior year. Current year results benefited from the contribution associated with recently completed acquisitions, organic growth across our base business and realized gains on each of the six asset sales that closed in the second quarter. These positive impacts were partially offset by higher borrowing costs associated with the financing of our growth initiatives.
  • Funds from operations (FFO) for the second quarter was $552 million, increasing 8% relative to the comparable period. Results were supported by the contribution of approximately $2.1 billion of capital deployed in new acquisitions over the past year, partially offset by the impact of asset sales and borrowing costs associated with financing our new investments. Organic growth was near the high-end of our 6-9% target range, reflecting the benefit of elevated levels of inflation on tariff increases and the commissioning of approximately $1 billion in new capital projects over the last 12 months. Partially offsetting the strong underlying performance of our business was the normalization of market sensitive revenues, as the prior year benefited from elevated commodity prices.

Outlook:

We continue to find good opportunities to invest capital above our targeted return threshold. During the second quarter, we accelerated our global data center growth strategy through the acquisition of two marquee development platforms in Europe and North America, respectively. These investments fill gaps in our existing portfolio, which was regionally focused in South America, Australia and India. We now have an asset footprint in all our core markets and have become one of the largest developers in the world.

Brookfield Infrastructure continues to be successful in converting its advanced pipeline of capital recycling opportunities into completed sales. To date in this calendar year, we have secured $1.9 billion of asset sale proceeds, of which $1.4 billion has already closed. Generally, transactions are taking longer to complete and potential buyers have less access to capital. However, demand for highly contracted and essential infrastructure remains strong and we are focused on preparing for the next round of capital recycling initiatives in 2024.

Source: (BIP-N) Q2-2023 Quarterly Results


Bell Canada (BCE-T) released its second-quarter fiscal 2023 results on Thursday, August 3, 2023, before markets opened.

“Bell’s Q2 results demonstrate that our consistent strong execution and delivering the compelling services that our customers want and value is a winning approach.

Over the past several years, we have been laser focused on building the best networks, investing in growing our fibre footprint and delivering ever-faster mobile and Internet speeds. Bell pure fibre was ranked the fastest Internet in Canada in the Ookla Speedtest Awards report for Q1-Q2 2023, as well as the fastest Wi-Fi. We added 52,148 new net fibre customers in Q2, up 38.2% over last year, and our retail Internet net activations were up 10.2% to 24,934, our best Q2 result in 16 years. We surpassed a milestone of 10 million mobile phone subscribers, with service revenue up 4.4% on our highest Q2 postpaid net activations in 18 years. And we achieved these results against the backdrop of declining prices, demonstrating that our industry is delivering the highest quality services at decreasing prices, despite persistent inflation. Despite the continuing advertising recession across North America, our leading content and digital-first media strategy continues to pay off with Bell Media digital revenue up 20% over last year, and now comprising 33% of total Bell Media revenue.”

– Mirko Bibic, President and Chief Executive Officer

Highlights:

  • 241,516 total wireless mobile phone and mobile connected device, retail Internet and IPTV net activations, up 76.5%
  • 5% consolidated revenue growth delivered 2.1% higher adjusted EBITDA
  • Net earnings of $397 million down 39.3% with net earnings attributable to common shareholders of $329 million, or $0.37 per common share, down 44.8%; adjusted net earnings of $722 million yielded a 9.2% decrease in adjusted EPS to $0.79
  • Cash flows from operating activities down 8.9% to $2,365 million; free cash flow decreased to $1,016 million on timing of working capital and capital expenditures
  • Wireless operating momentum continues: surpassed 10 million mobile phone subscribers; wireless service revenue grew 4.4% on highest Q2 postpaid net activations in 18 years, up 33.8% to 111,282 and 79,537 mobile connected device net activations, up 79,881
  • Best Q2 retail Internet net activations since 2007, up 10.2% to 24,934; 52,148 fibre net activations, up 38.2%, delivered strong 7% residential Internet revenue growth; on pace to complete 85% of planned broadband buildout program by end of 2023
  • Bell Media digital revenue up 20% as total media revenue and adjusted EBITDA declined 1.9% and 5.3% respectively, due to ongoing advertising recession
  • Reconfirming all 2023 financial guidance targets

Outlook:

Source: (BCE-T) Q2-2023 Quarterly Results


Telus Corp. (T-T) released its second-quarter fiscal 2023 results on Friday, August 4, 2023, before markets opened.

“For the second quarter, our TELUS team once again demonstrated execution strength in our TTech business segment, characterized by the potent combination of leading customer growth, complemented by strong operational and financial results. Our robust performance in our core telecom business is underpinned by our globally leading broadband networks and customer-centric culture, which enabled our strongest second quarter on record, with total customer net additions of 293,000, up 19 per cent, year-over-year, driven by strong demand for our leading portfolio across Mobility and Fixed services.

At TELUS International, increasing macroeconomic pressure has temporarily impacted service demand from some of our larger tech clients as they aggressively address their own cost structures, slowing the expected rate of revenue and profit growth for 2023. In response, our TI team has actioned significant incremental cost efficiency efforts, including staff reductions, to address lower service volumes, and is driving additional automation and generative AI-enabled solutions to further optimize its cost structure and go-to-market sales opportunities. Despite these near-term challenges, we remain highly confident in TI’s strategy and investment thesis. This is amplified by meaningful opportunities in respect of digital transformation – particularly with generative AI adoption – and the continuing critical importance of differentiated digital customer experience solutions in the market, which remains a vibrant tailwind for TI’s medium- and long-term growth and profitability.”

– Darren Entwistle, President and Chief Executive Officer

Highlights:

  • Consolidated Operating revenues and other income increased by $545 million in the second quarter of 2023 and $1,227 million in the first six months of 2023.
  • Operating income decreased by $180 million in the second quarter of 2023 and $308 million in the first six months of 2023.
  • Income before income taxes decreased by $406 million in the second quarter of 2023 and $675 million in the first six months of 2023 as a result of higher Financing costs and lower Operating income. The increase in Financing costs largely resulted from greater interest on long-term debt, excluding lease liabilities as well as the impact of virtual power purchase agreements unrealized change in forward element
  • Income tax expense decreased by $104 million in the second quarter of 2023 and $193 million in the first six months of 2023.
  • Net income attributable to Common Shares decreased by $268 million in the second quarter of 2023 and $436 million in the first six months of 2023, reflecting the after-tax impacts of higher Financing costs and lower Operating income.
  • Basic EPS decreased by $0.20 or 58.8% in the second quarter of 2023 and $0.33 or 53.2% in the first six months of 2023, reflecting the after-tax impacts of higher Financing costs and lower Operating income, as well as the effect of a higher number of Common Shares outstanding.
  • During the 12-month period ended on June 30, 2023, our total telecom subscriber connections increased by 1,206,000 or 7.0%. This reflected an increase of 3.9% in mobile phone subscribers, 22.1% in connected device subscribers, 9.3% in internet subscribers, 4.7% in TV subscribers and 9.7% in security subscribers, partly offset by a decline of 2.4% in residential voice subscribers.
  • Free cash flow increased by $74 million in the second quarter of 2023 and $194 million in the first six months of 2023, primarily reflecting lower capital expenditures, partly offset by an increase in cash interest paid.

Outlook:

The assumptions for our 2023 outlook, as described in Section 9 in our 2022 annual MD&A, remain the same, except for the following:

  • Our revised estimates for 2023 economic growth in Canada, B.C., Alberta, Ontario and Quebec are 0.9%, 0.5%, 1.9%, 0.5% and 0.4%, respectively (compared to 0.6%, 0.4%, 1.5%, 0.3% and 0.5%, respectively, as reported in our 2022 annual MD&A).
  • Our revised estimates for 2023 annual inflation rates in Canada, B.C., Alberta and Ontario are 3.6%, 3.6%, 3.4% and 3.5%, respectively (compared to 3.7%, 3.7%, 3.8% and 3.6%, respectively, as reported in our 2022 annual MD&A).
  • Our revised estimates for 2023 annual unemployment rates in Canada, B.C., Alberta, Ontario and Quebec are 5.6%, 5.2%, 6.0%, 5.8% and 4.6%, respectively (compared to 6.1%, 5.6%, 5.9%, 6.6% and 5.5%, respectively, as reported in our 2022 annual MD&A).
  • Our revised estimates for 2023 annual rates of housing starts on an unadjusted basis in Canada, B.C., Alberta, Ontario and Quebec are 225,000 units, 42,000 units, 34,000 units, 80,000 units and 49,000 units, respectively (compared to 212,000 units, 34,000 units, 31,000 units, 71,000 units and 50,000 units, respectively, as reported in our 2022 annual MD&A).

Source: (T-T) Q2-2023 Quarterly Results


Enbridge Inc. (ENB-T) released its second-quarter fiscal 2023 results on Friday, August 4, 2023, before markets opened.

“Continuing our strong start to the year, Enbridge’s four businesses delivered another solid quarter of financial performance. Our first-choice customer service offering and operating reliability continue to result in high utilization across our systems. We continue to execute on our strategic priorities and are on track to achieve our full-year EBITDA and DCF per share guidance.”

– Greg Ebel, President and Chief Executive Officer

Highlights:

  • Second quarter GAAP earnings of $1.8 billion or $0.91 per common share, compared with GAAP earnings of $0.5 billion or $0.22 per common share in 2022
  • Adjusted earnings of $1.4 billion or $0.68 per common share, compared with $1.4 billion or $0.67 per common share in 2022
  • Adjusted earnings before interest, income taxes and depreciation and amortization (EBITDA) of $4.0 billion, an increase of 8%, compared with $3.7 billion in 2022
  • Cash provided by operating activities of $3.4 billion, compared with $2.5 billion in 2022
  • Distributable cash flow (DCF) of $2.8 billion, an increase of 1%, compared with $2.7 billion in 2022
  • Reaffirmed 2023 full year financial guidance for EBITDA and DCF and medium-term outlook
  • Planning construction of the first phase of the Rio Bravo Pipeline which will transport 2.6 bcf per day of natural gas feedstock to supply Rio Grande LNG
  • Extended and upsized the Flanagan South Pipeline (FSP) binding open season for US Gulf Coast delivery service
  • Issued $0.4 billion aggregate amount of sustainability-linked bonds (SLB) in Canada, further strengthening Enbridge’s commitment to its emissions reduction goals
  • Issued 22nd Sustainability Report, demonstrating the Company’s ongoing progress towards goals set in November 2020
  • On track to achieve Debt-to-EBITDA in the lower half of the target range by year end, providing financial flexibility and demonstrating commitment to our equity-self funding model

Outlook:

The Company reaffirms its 2023 financial guidance for EBITDA and DCF. Results for the first six months of 2023 are in line with the Company’s expectations and the Company anticipates that its businesses will continue to experience strong capacity utilization and operating performance through the balance of the year with normal course seasonality.

Strong operational performance in the first half of the year is expected to be offset by higher financing costs, due to increased interest rates, and a lower toll on the Mainline.

Source: (ENB-T) Q2-2023 Earnings Presentation


Magna (MGA-N) released its second-quarter fiscal 2023 results on Friday, August 4, 2023, before markets opened.

“I am pleased with our second quarter operating performance, which reflects continued strong execution on higher organic sales and cost reduction actions being taken across the company. We remain highly focused on executing our strategy and remain confident in our ability to meet our short- and long-term growth and margin outlooks.

With the closing of the Veoneer Active Safety acquisition, we have hit the ground running on integration plans and delivering synergies from the combined business.”

– Swamy Kotagiri, Chief Executive Officer

Highlights:

  • Sales of $11.0 billion for the second quarter of 2023, an increase of 17% from the second quarter of 2022, which compares to a 15% increase in global light vehicle production, including 14%, 13% and 21% higher production in North America, Europe and China, respectively. In addition to higher global production, our sales benefitted from the launch of new programs and higher sales in our Complete Vehicles segment, while the net weakening of foreign currencies against the U.S. dollar negatively impacted sales.
  • Adjusted EBIT increased to $603 million in the second quarter of 2023 compared to $358 million in the second quarter of 2022. Our focus on operational excellence and cost initiatives helped drive strong earnings on higher sales. In addition, the EBIT increase reflects losses in our Russian facilities during the second quarter of 2022, and commercial items in the second quarter of 2023 and 2022, which had a net favourable impact on a year over year basis. These were partially offset by higher production input costs net of customer recoveries, higher engineering, launch and other costs, including for new vehicle assembly business, and acquisitions, net of divestitures subsequent to the second quarter of 2022.
  • Income from operations before income taxes was $483 million for the second quarter of 2023 compared to a loss of $88 million in the second quarter of 2022, which includes Other expense, net(2) of $86 million and $426 million in the second quarters of 2023 and 2022, respectively. Excluding Other expense, net from both periods, income from operations before income taxes increased $231 million in the second quarter of 2023 compared to the second quarter of 2022.
  • Net income attributable to Magna International Inc. was $339 million for the second quarter of 2023 compared to a loss of $156 million in the second quarter of 2022, which includes Other expense, net(2), after tax of $91 million and $399 million in the second quarters of 2023 and 2022, respectively. Excluding Other expense, net, after tax from both periods, net income attributable to Magna International Inc. increased $187 million in the second quarter of 2023 compared to the second quarter of 2022.
  • Diluted earnings per share increased to $1.18 in the second quarter of 2023, compared to a loss of $0.54 in the second quarter of 2022, and Adjusted diluted earnings per share increased 81% to $1.50 in the second quarter of 2023 compared to $0.83 in the second quarter of 2022.
  • Generated cash from operations before changes in operating assets and liabilities of $879 million and used $332 million in operating assets and liabilities. Investment activities for the second quarter of 2023 included $1.48 billion to acquire Veoneer Active Safety, $502 million in fixed asset additions, a $96 million increase in investments, other assets and intangible assets, and $3 million in public and private equity investments. 

Outlook:

MP Market Review – July 28, 2023

Last updated by BM on July 31, 2023

Summary 

  • This is a weekly installment of our MP Market Review series, which provides updates on the financial markets and Canadian dividend growth companies we monitor on ‘The List’.
  • Last week, ‘The List’ was down with a YTD price return of +5.4% (capital). Dividend growth remained the same and is now at +8.4% YTD, highlighting growth in income over the past year.
  • Last week, no dividend increases from companies on ‘The List’.
  • Last week, five earnings reports from companies on ‘The List’.
  • Nine companies on ‘The List’ are due to report earnings this week.
  • If you’re interested in creating your own dividend growth income portfolio, consider subscribing to our premium service, which grants you access to the MP Wealth-Builder Model Portfolio (CDN) and exclusive subscriber-only content.  Learn More         

Identifying companies whose dividend growth aligns closely with price growth can considerably enhance the predictability of future returns. Dividend growth investors know that the dividend drives the price in a predictable way, not the other way around. Waste Connections (WCN-T) is another company on ‘The List’ that follows this dividend growth principle.

Introduction

“You have a pair of pants. In the left pocket, you have $100. You take $1 out of the left pocket and put it in the right pocket. You now have $101. There is no diminution of dollars in your left pocket. That is one magic pair of pants.”

This ‘magic pants’ analogy was from a Seeking Alpha article on dividend investing I read about a decade ago and was one of the catalysts for me to take a closer look at this type of investing and see if it truly was magical. 

After conducting additional research, I have shifted towards utilizing a dividend growth investing (DGI) strategy as my primary investment approach. While I maintain portfolios consisting of high-quality dividend growers from both the United States and Canada, I have opted to concentrate on Canadian (CDN) dividend growth companies in this blog. This is due to several reasons, including a smaller pool of DGI companies to track, a lack of coverage for the DGI strategy by the North American investment media, and a tendency for those who do cover DGI to narrowly focus on only a handful of sectors (Energy and Financials).

While ‘The List’ is not a portfolio in itself, it serves as an excellent initial reference for individuals seeking to diversify their investments and attain higher returns in the Canadian stock market. Through our blog, we provide weekly updates on ‘The List’ and offer valuable perspectives and real-life examples of the dividend growth investing strategy in practice. This helps readers gain a deeper understanding of how to implement and benefit from this investment approach.


DGI Thoughts

“A stock providing an increasing cash flow becomes more valuable regardless of what the market is doing.”

-Tom Connolly, dividendgrowth.ca

Trying to predict the market moves in the short term never ends well. Having a process, however, tilts the odds in your favour. Eight of our eleven purchases for 2023, in the model portfolio, are up since we decided to pull the trigger, with two companies (TFII-N and MGA-N) up over 20%! On the flip side, we have been buying TC Energy (TRP-T) as it continues to wilt due to short term narratives.

We like these comments from TC Energy management in their recent earnings report.

“Reaffirming 2023 outlook and dividend declaration We reaffirm our 2023 comparable EBITDA growth outlook of five to seven per cent relative to 2022, while comparable earnings per common share is expected to be modestly higher than 2022, showcasing the resiliency and sustainability of our earnings and cash flows.”

“We expect to continue to grow the common share dividend at an annual rate of three to five per cent, enabling our shareholders to benefit from our growth and success in the coming years.”

A yield now north of 8% with growing cash flow is hard to pass on. We will however be prudent and keep our position size in line with our business plan and collect our income while we see how this one plays out.

If you have not yet joined as a paid subscriber of the blog to receive DGI Alerts on the activity and content related to our model portfolio, it’s not too late. Click Here. 

Recent News 

Sensing end of Fed hikes, some U.S. investors return to dividend stocks (Globe & Mail)

https://www.theglobeandmail.com/investing/investment-ideas/article-sensing-end-of-fed-hikes-some-us-investors-return-to-dividend-stocks/

“We’re looking for companies that may not have the highest yield, but the capacity to grow yields down the line” due to their larger earnings base.”

Good advice from this author.

DBRS Says TC Energy’s Planned Spinoff of Liquids Business Has No Impact On Ratings, July 28, 2023 12:52

12:52 PM EDT, 07/28/2023 (MT Newswires) — DBRS said Friday that TC Energy’s (TRP-T) planned spinoff of its liquids pipelines business into a separately listed company does not have an impact on the company’s ratings.

“The spinoff has a modestly negative impact on TC Energy’s business risk profile because of the loss of diversification,” the rating agency said. “Nevertheless, DBRS Morningstar foresees the Company’s business risk profile post spinoff remaining strong, underpinned by regulated/contracted cash flows, strong supply and demand fundamentals at its natural gas pipelines and power businesses, and an asset base that is still very diversified despite the spinoff.”

Depending on who you listen to, the news of TC Energy’s spinoff plans next year are being viewed as neutral to slightly negative. With a positive earnings report that met analyst expectations for the most part, we are in the wait and see category right now.

To receive breaking news about companies on ‘The List’ follow us on Twitter @MagicPants_DGI.

The List (2023)

Last updated by BM on July 28, 2023

The Magic Pants List contains 27 Canadian dividend growth stocks. ‘The List’ contains Canadian companies that have raised their dividend yearly for at least the last ten years and have a market cap of over a billion dollars. Below is each stock’s symbol, name, current yield, current price, price return year-to-date, current dividend, dividend growth year-to-date and current dividend growth streak. Companies on ‘The List’ are added or subtracted once a year, on January 1. After that, ‘The List’ is set for the next twelve months. Prices and dividends are updated weekly.

SYMBOL COMPANY YLD PRICE YTD % DIV YTD % STREAK
AQN-N Algonquin Power & Utilities 6.2% $8.17 21.4% $0.51 -29.0% 12
ATD-T Alimentation Couche-Tard Inc. 0.8% $66.69 10.9% $0.56 19.1% 13
BCE-T Bell Canada 6.7% $57.04 -5.3% $3.82 5.0% 14
BIP-N Brookfield Infrastructure Partners 4.4% $35.28 5.2% $1.44 6.3% 15
CCL-B-T CCL Industries 1.7% $63.61 9.6% $1.06 10.4% 21
CNR-T Canadian National Railway 2.0% $159.91 -1.8% $3.16 7.8% 27
CTC-A-T Canadian Tire 3.8% $182.60 24.6% $6.90 17.9% 12
CU-T Canadian Utilities Limited 5.5% $32.90 -10.9% $1.79 1.0% 51
DOL-T Dollarama Inc. 0.3% $87.15 9.1% $0.27 23.8% 12
EMA-T Emera 5.1% $54.30 3.2% $2.76 3.0% 16
ENB-T Enbridge Inc. 7.4% $48.19 -9.6% $3.55 3.2% 27
ENGH-T Enghouse Systems Limited 2.8% $30.27 -15.2% $0.85 18.2% 16
FNV-N Franco Nevada 0.9% $144.12 4.3% $1.36 6.3% 15
FTS-T Fortis 4.0% $56.06 1.3% $2.26 4.1% 49
IFC-T Intact Financial 2.2% $198.09 1.2% $4.40 10.0% 18
L-T Loblaws 1.5% $116.75 -3.0% $1.74 10.3% 11
MGA-N Magna 2.9% $63.75 10.8% $1.84 2.2% 13
MRU-T Metro 1.7% $71.51 -5.3% $1.21 10.0% 28
RY-T Royal Bank of Canada 4.1% $130.31 1.8% $5.34 7.7% 12
SJ-T Stella-Jones Inc. 1.4% $67.02 35.2% $0.92 15.0% 18
STN-T Stantec Inc. 0.9% $89.31 36.7% $0.77 8.5% 11
TD-T TD Bank 4.5% $86.08 -1.8% $3.84 7.9% 12
TFII-N TFI International 1.1% $127.50 27.3% $1.40 29.6% 12
TIH-T Toromont Industries 1.5% $112.25 14.9% $1.68 10.5% 33
TRP-T TC Energy Corp. 8.2% $45.25 -15.1% $3.69 3.4% 22
T-T Telus Corp. 6.1% $23.62 -10.3% $1.43 7.3% 19
WCN-N Waste Connections 0.7% $141.44 7.4% $1.02 7.4% 13
Averages 3.3% 5.4% 8.4% 19

Six Canadian stocks on ‘The List’ declare earnings and dividends in US dollars and are inter-listed on a US exchange in US dollars. The simplest way to display dividend and price metrics for these stocks is to show their US exchange symbols along with their US dividends and price. The stocks I am referring to have a -N at the end of their symbols. You can still buy their Canadian counterparts (-T), but your dividends will be converted into CDN dollars and will fluctuate based on the exchange rate.

Note: When the dividend and share price currency match, the calculation is straightforward. But it’s not so simple when the dividend is declared in one currency, and the share price is quoted in another. Dividing the former by the latter would produce a meaningless result because it’s a case of apples and oranges. To calculate the yield properly, you must express the dividend and share price in the same currency.

Performance of ‘The List’

Feel free to click on this link, ‘The List’ for a sortable version from our website.

Last week, ‘The List’ was down with a YTD price return of +5.4% (capital). Dividend growth remained the same and is now at +8.4% YTD, highlighting growth in income over the past year.

The best performers last week on ‘The List’ were TFI International (TFII-N), up +4.71%; Toromont Industries (TIH-T), up +2.80%; and Magna (MGA-N), up +2.28%.

TC Energy Corp. (TRP-T) was the worst performer last week, down -13.36%.


Dividend Increases

“The growth of dividend paying ability is of significance in the determination of a stock’s quality, or general safety…”

– Arnold Bernhard (the founder of Value Line)

“As a dividend increase is a positive sign of a company’s financial strength, the safest purchase, after research, is a stock with a recent dividend increase.”

– Tom Connolly (the founder of dividendgrowth.ca)

Last week, no dividend increases from companies on ‘The List’.


Earnings Releases

Benjamin Graham once remarked that earnings are the principal factor driving stock prices.

Each quarter we will provide readers with weekly earnings updates of stocks on ‘The List’ during the calendar earnings season. 

The updated earnings calendar can be found here.

Earnings growth and dividend growth tend to go hand in hand, so this information can tell us a lot about the future dividend growth of our quality companies. Monitoring our dividend growers periodically is part of the process, and reading the quarterly earnings releases is a good place to start.

Nine earnings reports from companies on ‘The List’ this week

TFI International (TFII-N) will release its second-quarter fiscal 2023 results on Monday, July 31, 2023, after markets close.

Fortis (FTS-T) will release its second-quarter fiscal 2023 results on Wednesday, August 2, 2023, before markets open.

Waste Connections (WCN-N) will release its second-quarter fiscal 2023 results on Wednesday, August 2, 2023, after markets close.

Intact Financial (IFC-T) will release its second-quarter fiscal 2023 results on Wednesday, August 2, 2023, after markets close.

Brookfield Infrastructure Partners (BIP-N) will release its second-quarter fiscal 2023 results on Thursday, August 3, 2023, before markets open.

Bell Canada (BCE-T) will release its second-quarter fiscal 2023 results on Thursday, August 3, 2023, before markets open.

Telus Corp. (T-T) will release its second-quarter fiscal 2023 results on Friday, August 4, 2023, before markets open.

Enbridge Inc. (ENB-T) will release its second-quarter fiscal 2023 results on Friday, August 4, 2023, before markets open.

Magna (MGA-N) will release its second-quarter fiscal 2023 results on Friday, August 4, 2023, before markets open.

Last week, five companies on ‘The List’ reported earnings.

Canadian National Railway (CNR-T) released its second-quarter fiscal 2023 results on Tuesday, July 25, 2023, after markets closed.

“CN’s disciplined approach to scheduled railroading continues to deliver for our customers. As volumes evolve, we will continue to refine our plan to optimize efficiency and drive further improvements to customer service. Our goal to accelerate sustainable, profitable growth through 2026 and beyond remains on track.”

– Tracy Robinson, President and Chief Executive Officer

Highlights:

Q2 2023 compared to Q2 2022

  • Revenues of C$4,057 million, a decrease of C$287 million, or 7%.
  • Operating income of C$1,600 million, a decrease of C$169 million, or 10%.
  • Operating ratio, defined as operating expenses as a percentage of revenues, of 60.6%, an increase of 1.3-points, or an increase of 1.6-points on an adjusted basis.
  • Diluted EPS of C$1.76, a decrease of 8%, or a decrease of 9% compared to second quarter 2022 adjusted EPS.
  • Free cash flow for the second quarter of 2023 was C$1,100 million, an increase of C$103 million, or 10%.
  • Free cash flow for the first half of 2023 was C$1,693 million, an increase of C$125 million, or 8%.

Outlook:

In light of CN’s second quarter results and revised expectation of weaker than anticipated volumes in the second half of 2023, CN is updating its full-year outlook and now expects flat to slightly negative year-over-year growth in adjusted diluted EPS in 2023 (compared to the April 24, 2023 expectation of growth in the mid-single digits). CN reiterates its longer-term financial perspective and continues to target compounded annual diluted EPS growth in the range of 10%-15% over the 2024-2026 period driven by growing volumes more than the economy, pricing above rail inflation and incrementally improving efficiency, all of which assumes a supportive economy.

Source: (CNR-T) Q2-2023 Quarterly Review


Loblaws (L-T) released its second-quarter fiscal 2023 results on Wednesday, July 26, 2023, before markets opened.

“Our businesses remain focused on providing Canadians with the selection, freshness, care and value they need today. We will build on this strength and continue to take meaningful steps to fight back against inflation. Our discount offering, best-in-class control brand products and PC Optimum™ Program are resonating with customers who are looking for value without sacrificing quality.”

– Galen G. Weston, Chairman and President

Highlights:

  • Revenue was $13,738 million, an increase of $891 million, or 6.9%.
  • Retail segment sales were $13,471 million, an increase of $848 million, or 6.7%.
  • Food Retail (Loblaw) same-stores sales increased by 6.1%.
  • Drug Retail (Shoppers Drug Mart) same-store sales increased by 5.7%, with front store same-store sales growth of 5.0% and pharmacy same-store sales growth of 6.3%.
  • E-commerce sales increased by 13.9%.
  • Operating income was $927 million, an increase of $185 million, or 24.9%.
  • Adjusted EBITDA was $1,640 million, an increase of $141 million, or 9.4%.
  • Retail segment adjusted gross profit percentage was 31.1%, a decrease of 30 basis points.
  • Net earnings available to common shareholders of the Company were $508 million, an increase of $121 million or 31.3%. Diluted net earnings per common share were $1.58, an increase of $0.42, or 36.2%. The increase included the lapping of a prior year charge of $111 million related to a PC Bank commodity tax matter.
  • Adjusted net earnings available to common shareholders of the Company were $626 million, an increase of $60 million, or 10.6%.
  • Adjusted diluted net earnings per common share were $1.94, an increase of $0.25 or 14.8%.
  • Repurchased for cancellation 4.2 million common shares at a cost of $511 million and invested $410 million in capital expenditures, net of proceeds from property disposals. Free cash flow used in the Retail segment was $600 million.

Outlook:

Loblaw will continue to execute on retail excellence while advancing its growth initiatives in 2023. The Company’s businesses remain well placed to service the everyday needs of Canadians. However, the Company cannot predict the precise impacts of global economic uncertainties, including the inflationary environment, on its 2023 financial results.

For the full-year 2023, the Company continues to expect:

  • its Retail business to grow earnings faster than sales;
  • adjusted net earnings per common share growth in the low double digits;
  • to increase investments in our store network and distribution centres by investing a net amount of $1.6 billion in capital expenditures, which reflects gross capital investments of approximately $2.1 billion offset by approximately $500 million of proceeds from real estate dispositions; and
  • to return capital to shareholders by allocating a significant portion of free cash flow to share repurchases.

Source: (L-T) Q2-2023 News Release


Toromont Industries (TIH-T) released its second-quarter fiscal 2023 results on Wednesday, July 26, 2023, after markets closed.

“We are pleased with the operating and financial performance through the first half of the year. The Equipment Group executed well, delivering on several large customer orders, as well as growing rental and product support results. CIMCO revenue and bottom line improved in the quarter on project construction and higher product support activity. Across the organization, we continue to navigate through economic conditions and remain committed to our operating disciplines, driving our after-market strategies and delivering customer solutions.”

– Scott J. Medhurst, President and Chief Executive Officer

Highlights:

  • Revenue increased $121.3 million or 12% in the second quarter compared to the similar period last year. Revenue was higher in both groups with the Equipment Group up 11% in the quarter on higher new equipment sales (+16%), partially offset by lower used equipment sales (-9%), while CIMCO revenue was up 19%, with good progress on package sales (+18%). Product support revenue was 13% higher on increased demand in both Groups, while rental revenue grew 7% on a larger fleet and higher activity levels.
  • Revenue increased $321.0 million (17%) to $2.2 billion for the year-to-date period. Revenue increased in both groups, with the Equipment Group up 17%, while CIMCO was up 18% versus the first half of 2022, on similar trends as noted for the quarter.
  • Operating income increased 15% in the quarter reflecting the higher revenue and lower relative expense level. Operating income as a percentage of sales increased to 15.2% from 14.8% in the prior year.
  • Operating income increased 26% in the year-to-date period, and was 13.8% of revenue compared to 12.8% in the similar period last year, reflecting a lower relative expense ratio.
  • Net earnings from continuing operations increased $22.3 million or 20% in the quarter versus a year ago to $133.3 million or $1.62 EPS (basic) and $1.61 EPS (fully diluted).
  • For the year-to-date period, net earnings from continuing operations increased $58.2 million or 34% to $229.4 million, or $2.79 EPS (basic) and $2.76 EPS (fully diluted).
  • Bookings for the second quarter increased 69% compared to last year and increased 10% on a year–to–date basis. Both the Equipment Group and CIMCO reported increased bookings on good demand for our products, however certain markets remain cautious given the uncertain economic conditions.
  • Backlog was $1.3 billion as at June 30, 2023, compared to $1.4 billion as at June 30, 2022, reflecting progress on construction and delivery schedules as well as some improvement in equipment flow through the supply chain.
  • On May 1, 2023, the Company completed the sale of AgWest Ltd., a wholly-owned subsidiary, in a share and asset transaction. Total proceeds were paid in cash of approximately $41.6 million and are subject to customary post-closing adjustments. AgWest was reported in the Equipment Group and effective with the second quarter, has been presented as discontinued operations.

Outlook:

We are closely monitoring regional, national and global economic factors, in particular, inflationary pressures from price and wage increases, interest rate changes, and general economic health of the industries we serve.

While improving, the global supply chain remains challenged in certain lines and components. We continue to actively manage supply chain constraints by taking appropriate mitigation steps.

We continue to monitor economic and inflationary developments, remaining focused on the health and safety of our employees and serving our customers. We are transitioning to a hybrid work model, where appropriate, and are enhancing and leveraging the use of technology to efficiently and effectively engage with customers, employees and other partners, while improving our operational efficiency.

The Equipment Group’s parts and service business provides stability supported by a large and diversified installed base of equipment. The long-term outlook for infrastructure projects and other construction activity is positive across most territories although tied somewhat to the general economic climate which is increasingly uncertain. Mining customers and our operations that support them continue to evaluate appropriate activity levels on a daily/weekly basis. Longer term, mine investment and expansion will remain dependent on global economic and financial conditions.

Investment continues in broadening product lines and service offerings, expanding and enhancing the branch network, optimizing rental fleets, and using technologies to create efficiency and effectiveness across the organization. Integration and alignment of operating processes and systems, best practices and culture, continues across our territory. Product support technologies, such as remote diagnostics, telematics and digital information models support and expand our strategic platform.

CIMCO’s installed base supports current and future operations and growth trends. CIMCO has a wide product offering using natural refrigerants including innovative CO2 solutions, which remains a differentiator in recreational markets. In industrial markets, CIMCO’s proven track record and strong geographical coverage provides growth opportunities. Current backlog is supportive of future activity. Inflationary costs and competitive market conditions continue to challenge package revenue growth opportunities. The diversity of the markets served, expanding product offering and services, strong financial position and disciplined operating culture position the Company well for continued positive results in the long term.

Source: (TIH-T) Q2-2023 Reporting Package


Canadian Utilities Limited (CU-T) released its second-quarter fiscal 2023 results on Thursday, July 27, 2023, before markets opened.

“Canadian Utilities achieved adjusted earnings of a $100 million or $0.37 per share in the second quarter of this year, compared to $136 million in the second quarter of last year. As expected, the impact of our Alberta distribution utilities rebasing following our second successful performance-based regulation cycle resulted in lower year-over-year earnings in the second quarter. On it’s own, this rebasing contributed to a year-over-year decline in earnings of approximately $25 million. While significant, this is certainly not unexpected in a rebasing year, especially with a phenomenal out performance we achieved last year, a final year of PBR2.”

– Brian Shkrobot, Executive Vice-President and Chief Financial Officer

Highlights:

Recent Developments:

  • Announced the executive appointment of Wayne Stensby as Chief Operating Officer of ATCO Energy Systems, the newly branded gas and electrical utility services business, which also oversees our interests in LUMA Energy.
  • Announced the executive appointment of Bob Myles as Chief Operating Officer of ATCO EnPower, the newly branded non-regulated energy business, including renewables, clean fuels, and energy storage.
  • Invested $332 million in capital expenditures in the second quarter of 2023, of which 86 per cent was invested in ATCO Energy Systems and 14 per cent mainly in ATCO EnPower.
  • The Barlow solar project achieved full commercial operations. Our other Calgary solar development project, Deerfoot, is expected to commence energization in the third quarter of 2023, with full commercial operations expected in the fourth quarter of 2023.
  • Since acquiring the renewable energy portfolio in January 2023, the 232-MW of operating Forty Mile and Adelaide wind assets have contributed revenues of $46 million for the six months ended June 30, 2023. Uprating work continues for the Forty Mile wind assets with expected completion in the fourth quarter of 2023. This uprating is expected to increase Forty Mile Wind generation capacity from 202-MW to 225-MW.
  • Despite significant wildfire activity within Alberta in the first half of 2023, Canadian Utilities’ businesses have been successful in limiting customer outages and avoiding any safety incidents related to these events. Wildfire activity in the province of Alberta has slowed significantly from its peak earlier in the second quarter and our teams continue to stay focused on restoration efforts. We do not expect to see any negative impact to earnings as a result of these events.
  • Significant opportunities for growth continue to be expected in connection with the energy transition, including existing and new opportunities within both ATCO Energy Systems and ATCO EnPower. To support this potential growth, Canadian Utilities intends to explore various financing alternatives including the possibility of creating ATCO EnPower as a separate entity.

Outlook:

Looking ahead to the rest of year, we expect to see the earnings pressure associated with this rebasing peak in the third quarter, and in the fourth quarter we expect seasonality benefits and our annual spending profile to create potential opportunities for year-over-year growth. Overall, despite the earnings pressure from rebasing, we still believe that our full year performance for these businesses will be in line with the expectations that we’ve shared previously. More specifically, we continue to believe that we’ll be successful in achieving out-performance largely in line with our long-term historical performance. This will limit the single year earnings decline for this year to levels largely consistent with what we experienced back in 2018 following PBR1.

– Brian Shkrobot, Executive Vice-President and Chief Financial Officer

Source: (CU-T) Q2-2023 News Release


TC Energy (TRP-T) released its second-quarter fiscal 2023 results on Friday, July 28, 2023, before markets opened.

“Today’s announcement to separate our Natural Gas Pipelines and Power and Energy Solutions businesses from our Liquids Pipelines business will maximize the value of our assets. The separated industry-leading companies will have greater strategic focus to execute major projects, drive efficiencies and operational excellence, and enhanced flexibility to pursue disciplined growth. In addition, we have made significant progress on our 2023 strategic priorities. First, we continue to safely execute our secured capital program, including Coastal GasLink and Southeast Gateway which remain on planned cost and schedule. Second, we have significantly accelerated our deleveraging goal ahead of our year-end target with the sale of a 40 per cent equity interest in the Columbia Gulf and Columbia Gas systems for total cash proceeds of $5.2 billion. And third, we are safely and reliably operating our assets that provide essential services across North America, which is a testament to the dedication and hard work of our people.”

– Francois Poirier, President and Chief Executive Officer

Highlights:

  • First quarter 2023 results were underpinned by strong utilization and demand for our assets and services
    • NGTL System total deliveries averaged 14.5 Bcf/d, up compared to first quarter 2022
    • Throughput across U.S. Natural Gas Pipelines averaging 28.5 Bcf/d with several assets performing at near record levels during peak demand
    • S. Natural Gas Pipelines achieved a new all-time record for deliveries to LNG export facilities
    • Alberta cogeneration power plant fleet reached 100 per cent peak price availability in February
    • Bruce Power achieved 95 per cent availability
  • First quarter 2023 financial results:
    • Net income attributable to common shares of $1.3 billion or $1.29 per common share compared to $0.4 billion or $0.36 per common share in first quarter 2022. Comparable earnings1 of $1.2 billion or $1.21 per common share compared to $1.1 billion or $1.12 per common share in 2022
    • Segmented earnings of $2.2 billion compared to segmented earnings of $1.2 billion in 2022 and comparable EBITDA of $2.8 billion compared to $2.4 billion in 2022
  • Reaffirmed our 2023 financial outlook with comparable EBITDA expected to be five to seven per cent higher than 2022
  • Declared a quarterly dividend of $0.93 per common share for the quarter ending June 30, 2023
  • Dividend Reinvestment and Share Repurchase Plan (DRP) participation rate amongst common shareholders was approximately 38 per cent, resulting in $363 million reinvested in common equity from the dividends declared on February 13, 2023
  • Continuing to advance our industry leading secured capital program, placing $1.4 billion of projects in service in first quarter 2023 and on track to place $6.0 billion in service during 2023
  • Canadian Natural Gas Pipelines brought $1.1 billion of projects in service in first quarter 2023, enabling 700 MMcf/d of additional market access with an incremental 500 MMcf/d expected in second quarter 2023
  • Placed Port Neches Link Pipeline System in service in March 2023 providing last mile connectivity to key demand mark
  • Acquired 155 MW Fluvanna Wind Farm for US$99 million in cash, before post-closing adjustments in Scurry County, Texas. Entered into an agreement to acquire 148 MW Blue Cloud Wind Farm for US$125 million in cash, before post-closing adjustments in Bailey County, Texas. Closing of the Blue Cloud acquisition is pending regulatory approval
  • Received FERC approval for ANR Section 4 Rate Case on April 11, 2023
  • Bruce Power Unit 3 removed from service March 1, 2023 to begin its Major Component Replacement (MCR) outage with return to service expected in 2026.

Outlook:

Reaffirming 2023 outlook and dividend declaration We reaffirm our 2023 comparable EBITDA growth outlook of five to seven per cent relative to 2022, while comparable earnings per common share is expected to be modestly higher than 2022, showcasing the resiliency and sustainability of our earnings and cash flows. In addition, we expect capital spending in 2023 to continue to be $11.5 to $12.0 billion. Our 2023 outlook reflects our commitment to driving long-term growth and value for our shareholders. Based on the confidence of our business and growth outlook, TC Energy’s Board of Directors declared a quarterly dividend of $0.93 per common share for the quarter ending June 30, 2023, equivalent to $3.72 per common share on an annualized basis. We expect to continue to grow the common share dividend at an annual rate of three to five per cent, enabling our shareholders to benefit from our growth and success in the coming years.

Source: (TRP-T) Q2-2023 Quarterly Report

MP Market Review – July 21, 2023

Last updated by BM on July 24, 2023

Summary 

  • This is a weekly installment of our MP Market Review series, which provides updates on the financial markets and Canadian dividend growth companies we monitor on ‘The List’.
  • Last week, ‘The List’ was up with a YTD price return of +6.9% (capital). Dividend growth remained the same and is now at +8.4% YTD, highlighting growth in income over the past year.
  • Last week, no dividend increases from companies on ‘The List’.
  • Last week, no earnings reports from companies on ‘The List’.
  • Five companies on ‘The List’ are due to report earnings this week.
  • If you’re interested in creating your own dividend growth income portfolio, consider subscribing to our premium service, which grants you access to the MP Wealth-Builder Model Portfolio (CDN) and exclusive subscriber-only content.  Learn More         

Identifying companies whose dividend growth aligns closely with price growth can considerably enhance the predictability of future returns. Dividend growth investors know that the dividend drives the price in a predictable way, not the other way around. Waste Connections (WCN-T) is another company on ‘The List’ that follows this dividend growth principle.

Introduction

“You have a pair of pants. In the left pocket, you have $100. You take $1 out of the left pocket and put it in the right pocket. You now have $101. There is no diminution of dollars in your left pocket. That is one magic pair of pants.”

This ‘magic pants’ analogy was from a Seeking Alpha article on dividend investing I read about a decade ago and was one of the catalysts for me to take a closer look at this type of investing and see if it truly was magical. 

After conducting additional research, I have shifted towards utilizing a dividend growth investing (DGI) strategy as my primary investment approach. While I maintain portfolios consisting of high-quality dividend growers from both the United States and Canada, I have opted to concentrate on Canadian (CDN) dividend growth companies in this blog. This is due to several reasons, including a smaller pool of DGI companies to track, a lack of coverage for the DGI strategy by the North American investment media, and a tendency for those who do cover DGI to narrowly focus on only a handful of sectors (Energy and Financials).

While ‘The List’ is not a portfolio in itself, it serves as an excellent initial reference for individuals seeking to diversify their investments and attain higher returns in the Canadian stock market. Through our blog, we provide weekly updates on ‘The List’ and offer valuable perspectives and real-life examples of the dividend growth investing strategy in practice. This helps readers gain a deeper understanding of how to implement and benefit from this investment approach.


DGI Thoughts

“Earnings warnings are like cockroaches – for every one you see, there are always a few more hiding.”

-Eddy Elfenbein, Crossing Wall Street

Calendar 2023 Q2 earnings season begins to speed up this week with five companies on ‘The List’ reporting. What makes this season more interesting is the effect, if any, the interest rate hikes that began last year will have on earnings. Rather than compare earnings results with analyst estimates, we have added another column showing last years Q2 results (LY Result). We highlight in red where the analyst estimates, and results are lower year over year. If central bank policy is working (slowing of the economy), we should see a lot of red this earnings season.

The updated earnings calendar can be found here.

As dividend growth investors, we are fine with a slowing economy as we still get paid (dividends) even if our quality dividend growers have a price pullback. We will be patiently looking for a market overreaction or two to add to our positions.

If you have not yet joined as a paid subscriber of the blog to receive DGI Alerts on the activity and content related to our model portfolio, it’s not too late. Click Here. 

Recent News 

Magna to invest more than US$790-million to build three new facilities for electric parts (Globe & Mail)

https://www.theglobeandmail.com/business/article-magna-to-invest-more-than-us790-million-to-build-three-new-facilities/

Governments in the United States and Canada are spending billions for EV manufacturers to build factories and bolster their battered auto sectors ahead of laws mandating electric-vehicle sales ratios and tougher emissions rules.”

It is hard to bet against the ‘electrification’ of our auto sector. Magna (MGA-N) has been one of our top total return performers since we added it to our model portfolio on May 31 (up +25%).

TC Energy to sell 40% interest in Columbia gas transmission systems for $5.2-billion (Globe & Mail)

https://www.theglobeandmail.com/business/industry-news/energy-and-resources/article-tc-energy-to-sell-40-interest-in-columbia-gas-and-columbia-gulf/

“While the headline valuation is likely underwhelming, the deal shores up the balance sheet,” said BMO Capital Markets analyst Ben Pham.

In its last earnings call, management mentioned that they were looking for ways to divest themselves of assets to improve their financials and this meets their target. Although there still may be more challenges for TC Energy before we see their value proposition play out, this deal certainly helps.

To receive breaking news about companies on ‘The List’ follow us on Twitter @MagicPants_DGI.

The List (2023)

Last updated by BM on July 21, 2023

The Magic Pants List contains 27 Canadian dividend growth stocks. ‘The List’ contains Canadian companies that have raised their dividend yearly for at least the last ten years and have a market cap of over a billion dollars. Below is each stock’s symbol, name, current yield, current price, price return year-to-date, current dividend, dividend growth year-to-date and current dividend growth streak. Companies on ‘The List’ are added or subtracted once a year, on January 1. After that, ‘The List’ is set for the next twelve months. Prices and dividends are updated weekly.

SYMBOL COMPANY YLD PRICE YTD % DIV YTD % STREAK
AQN-N Algonquin Power & Utilities 6.1% $8.28 23.0% $0.51 -29.0% 12
ATD-T Alimentation Couche-Tard Inc. 0.8% $67.63 12.5% $0.56 19.1% 13
BCE-T Bell Canada 6.5% $58.73 -2.5% $3.82 5.0% 14
BIP-N Brookfield Infrastructure Partners 4.4% $35.69 5.2% $1.44 6.3% 15
CCL-B-T CCL Industries 1.6% $65.02 12.0% $1.06 10.4% 21
CNR-T Canadian National Railway 2.0% $156.71 -3.8% $3.16 7.8% 27
CTC-A-T Canadian Tire 3.7% $185.04 26.2% $6.90 17.9% 12
CU-T Canadian Utilities Limited 5.2% $34.30 -7.1% $1.79 1.0% 51
DOL-T Dollarama Inc. 0.3% $88.46 10.8% $0.27 23.8% 12
EMA-T Emera 5.0% $55.00 4.5% $2.76 3.0% 16
ENB-T Enbridge Inc. 7.2% $49.43 -7.3% $3.55 3.2% 27
ENGH-T Enghouse Systems Limited 2.8% $30.70 -14.0% $0.85 18.2% 16
FNV-N Franco Nevada 0.9% $146.43 6.0% $1.36 6.3% 15
FTS-T Fortis 3.9% $57.44 3.8% $2.26 4.1% 49
IFC-T Intact Financial 2.2% $199.25 1.8% $4.40 10.0% 18
L-T Loblaws 1.4% $120.36 0.0% $1.74 10.3% 11
MGA-N Magna 3.0% $62.33 8.4% $1.84 2.2% 13
MRU-T Metro 1.6% $74.29 -1.6% $1.21 10.0% 28
RY-T Royal Bank of Canada 4.1% $131.03 2.3% $5.34 7.7% 12
SJ-T Stella-Jones Inc. 1.4% $68.07 37.3% $0.92 15.0% 18
STN-T Stantec Inc. 0.9% $88.75 35.8% $0.77 8.5% 11
TD-T TD Bank 4.5% $86.24 -1.6% $3.84 7.9% 12
TFII-N TFI International 1.1% $121.76 21.6% $1.40 29.6% 12
TIH-T Toromont Industries 1.5% $109.19 11.7% $1.68 10.5% 33
TRP-T TC Energy Corp. 7.1% $52.23 -2.0% $3.69 3.4% 22
T-T Telus 5.8% $24.79 -5.8% $1.43 7.3% 19
WCN-N Waste Connections 0.7% $144.64 9.8% $1.02 7.4% 13
Averages 3.2% 6.9% 8.4% 19

Six Canadian stocks on ‘The List’ declare earnings and dividends in US dollars and are inter-listed on a US exchange in US dollars. The simplest way to display dividend and price metrics for these stocks is to show their US exchange symbols along with their US dividends and price. The stocks I am referring to have a -N at the end of their symbols. You can still buy their Canadian counterparts (-T), but your dividends will be converted into CDN dollars and will fluctuate based on the exchange rate.

Note: When the dividend and share price currency match, the calculation is straightforward. But it’s not so simple when the dividend is declared in one currency, and the share price is quoted in another. Dividing the former by the latter would produce a meaningless result because it’s a case of apples and oranges. To calculate the yield properly, you must express the dividend and share price in the same currency.

Performance of ‘The List’

Feel free to click on this link, ‘The List’ for a sortable version from our website.

Last week, ‘The List’ was up with a YTD price return of +6.9% (capital). Dividend growth remained the same and is now at +8.4% YTD, highlighting growth in income over the past year.

The best performers last week on ‘The List’ were TFI International (TFII-N), up +11.30%; Magna (MGA-N), up +5.45%; and Stella-Jones Inc. (SJ-T), up +2.90%.

Enghouse Systems Limited (ENGH-T) was the worst performer last week, down -3.70%.


Dividend Increases

“The growth of dividend paying ability is of significance in the determination of a stock’s quality, or general safety…”

– Arnold Bernhard (the founder of Value Line)

“As a dividend increase is a positive sign of a company’s financial strength, the safest purchase, after research, is a stock with a recent dividend increase.”

– Tom Connolly (the founder of dividendgrowth.ca)

Last week, no dividend increases from companies on ‘The List’.


Earnings Releases

Benjamin Graham once remarked that earnings are the principal factor driving stock prices.

Each quarter we will provide readers with weekly earnings updates of stocks on ‘The List’ during the calendar earnings season. 

The updated earnings calendar can be found here.

Earnings growth and dividend growth tend to go hand in hand, so this information can tell us a lot about the future dividend growth of our quality companies. Monitoring our dividend growers periodically is part of the process, and reading the quarterly earnings releases is a good place to start.

Five earnings reports from companies on ‘The List’ this week

Canadian National Railway (CNR-T) will release its second-quarter fiscal 2023 results on Tuesday, July 25, 2023, after markets close.

Loblaws (L-T) will release its second-quarter fiscal 2023 results on Wednesday, July 26, 2023, before markets open.

Toromont Industries (TIH-T) will release its second-quarter fiscal 2023 results on Wednesday, July 26, 2023, after markets close.

Canadian Utilities Limited (CU-T) will release its second-quarter fiscal 2023 results on Thursday, July 27, 2023, before markets open.

TC Energy (TRP-T) will release its second-quarter fiscal 2023 results on Friday, July 28, 2023, before markets open.

Last week, no earnings reports from companies on ‘The List’.


MP Market Review – July 14, 2023

Last updated by BM on July 17, 2023

Summary 

  • This is a weekly installment of our MP Market Review series, which provides updates on the financial markets and Canadian dividend growth companies we monitor on ‘The List’.
  • Last week, ‘The List’ was up with a YTD price return of +5.6% (capital). Dividend growth remained the same and is now at +8.4% YTD, highlighting growth in income over the past year.
  • Last week, no dividend increases from companies on ‘The List’.
  • Last week, no earnings reports from companies on ‘The List’.
  • No companies on ‘The List’ are due to report earnings this week.
  • If you’re interested in creating your own dividend growth income portfolio, consider subscribing to our premium service, which grants you access to the MP Wealth-Builder Model Portfolio (CDN) and exclusive subscriber-only content.  Learn More         

We use ten-year yield charts to track dividend yield patterns for our quality dividend growers. Telus’ yield has now surpassed its ten-year average by a significant margin, pointing to undervaluation.

Investment Quality Trends (IQT) has been successful for almost sixty years using ‘Dividend Yield Theory’ as the cornerstone of their investing methodology in the United States. Buy at undervalue, hold through the rising trend, sell at overvalue, rinse, and repeat. They also use similar qualitative characteristics to what we use to screen for only the highest quality companies. Of all the investing newsletters it tracks, Hulbert Financial Digest lists IQT on its Honour Roll, outperforming the S&P 500 index in all time periods.

Introduction

“You have a pair of pants. In the left pocket, you have $100. You take $1 out of the left pocket and put it in the right pocket. You now have $101. There is no diminution of dollars in your left pocket. That is one magic pair of pants.”

This ‘magic pants’ analogy was from a Seeking Alpha article on dividend investing I read about a decade ago and was one of the catalysts for me to take a closer look at this type of investing and see if it truly was magical. 

After conducting additional research, I have shifted towards utilizing a dividend growth investing (DGI) strategy as my primary investment approach. While I maintain portfolios consisting of high-quality dividend growers from both the United States and Canada, I have opted to concentrate on Canadian (CDN) dividend growth companies in this blog. This is due to several reasons, including a smaller pool of DGI companies to track, a lack of coverage for the DGI strategy by the North American investment media, and a tendency for those who do cover DGI to narrowly focus on only a handful of sectors (Energy and Financials).

While ‘The List’ is not a portfolio in itself, it serves as an excellent initial reference for individuals seeking to diversify their investments and attain higher returns in the Canadian stock market. Through our blog, we provide weekly updates on ‘The List’ and offer valuable perspectives and real-life examples of the dividend growth investing strategy in practice. This helps readers gain a deeper understanding of how to implement and benefit from this investment approach.


DGI Thoughts

“A stock is not a purchase until it’s yield reaches the buy range established by the stock’s own unique dividend yield history.”

– Anthony Spare, Relative Dividend Yield

‘Dividend Yield Theory’ is simple and intuitive. It basically says that for quality dividend growth stocks, meaning those with stable business models that don’t significantly change over time, dividend yields tend to revert to the mean. Here is a table of the top eleven stocks on ‘The List’ that currently appear undervalued according to the dividend yield theory of valuation.

To borrow a term from Investment Quality Trends, these would be what we would use to form our ‘Timely Ten’ (Eleven) dividend growth stocks.

Now filter out the lower quality companies that may have one or two quality indicator limitations.

To provide an additional level of safety, the table can be reduced further to just five ‘Core’ category companies.

A dividend growth investor would then need to determine if the margin of safety built into the company’s yield, using this valuation methodology, is sufficient to initiate a position in today’s market.

If you have not yet joined as a paid subscriber of the blog to receive DGI Alerts on the activity and content related to our model portfolio, it’s not too late. Click Here. 

Recent News 

Lower interest rates will bring a ‘wildebeest migration’ of investors into beaten down dividend stocks (Globe & Mail)

https://www.theglobeandmail.com/investing/markets/inside-the-market/article-lower-interest-rates-will-bring-a-wildebeest-migration-of-investors/

“We are living in bountiful times for investors who prioritize income. For the safety-first crowd, there are guaranteed investment certificates (GICs) and federal government treasury bills (T-bills) with yields in the 5-per-cent zone. Climb a rung on the risk ladder and you can find slightly higher yields from preferred shares and corporate bonds. Step up another couple of rungs and you have out of favour blue-chip dividend growth stocks.”

The author cautions investors about yields that get too high and points out the example of Algonquin Power and what happened to its dividend earlier this year. Paying attention to yield and investing in higher quality names is the key to success. In addition, the author sees a big jump in quality dividend growth stocks once interest rates stabilize and head lower. We agree!

Telus International shares slump after company slashes growth guidance (Globe & Mail)

https://www.theglobeandmail.com/business/technology/article-telus-international-shares-slump-after-company-slashes-growth-guidance/

 Telus International slashed its growth guidance on Friday and the shares plummeted. Parent company, Telus, also saw its share price affected by the news. Purchasing a quality company like Telus at a ~6% yield was hard to resist for this dividend growth investor, so we bought more for our MP Wealth-Builder Model Portfolio (CDN) later in the day. From our experience, an above average yield such as Telus’ currently tends to act as a floor on the stock price as investors jump in to receive the growing income. The stock price eventually recovers and the yield reverts to its mean. We will be monitoring this quality dividend grower closely.

To receive breaking news about companies on ‘The List’ follow us on Twitter @MagicPants_DGI.

The List (2023)

Last updated by BM on July 14, 2023

The Magic Pants List contains 27 Canadian dividend growth stocks. ‘The List’ contains Canadian companies that have raised their dividend yearly for at least the last ten years and have a market cap of over a billion dollars. Below is each stock’s symbol, name, current yield, current price, price return year-to-date, current dividend, dividend growth year-to-date and current dividend growth streak. Companies on ‘The List’ are added or subtracted once a year, on January 1. After that, ‘The List’ is set for the next twelve months. Prices and dividends are updated weekly.

SYMBOL COMPANY YLD PRICE YTD % DIV YTD % STREAK
AQN-N Algonquin Power & Utilities 6.2% $8.12 20.7% $0.51 -29.0% 12
ATD-T Alimentation Couche-Tard Inc. 0.8% $66.88 11.2% $0.56 19.1% 13
BCE-T Bell Canada 6.5% $58.57 -2.8% $3.82 5.0% 14
BIP-N Brookfield Infrastructure Partners 4.4% $36.19 5.2% $1.44 6.3% 15
CCL-B-T CCL Industries 1.6% $66.37 14.3% $1.06 10.4% 21
CNR-T Canadian National Railway 2.0% $156.50 -3.9% $3.16 7.8% 27
CTC-A-T Canadian Tire 3.7% $185.67 26.7% $6.90 17.9% 12
CU-T Canadian Utilities Limited 5.2% $34.32 -7.1% $1.79 1.0% 51
DOL-T Dollarama Inc. 0.3% $88.43 10.7% $0.27 23.8% 12
EMA-T Emera 5.1% $54.34 3.3% $2.76 3.0% 16
ENB-T Enbridge Inc. 7.3% $48.64 -8.8% $3.55 3.2% 27
ENGH-T Enghouse Systems Limited 2.7% $31.88 -10.7% $0.85 18.2% 16
FNV-N Franco Nevada 0.9% $145.93 5.6% $1.36 6.3% 15
FTS-T Fortis 3.9% $57.34 3.6% $2.26 4.1% 49
IFC-T Intact Financial 2.2% $196.16 0.2% $4.40 10.0% 18
L-T Loblaws 1.5% $119.70 -0.5% $1.74 10.3% 11
MGA-N Magna 3.1% $59.11 2.8% $1.84 2.2% 13
MRU-T Metro 1.6% $74.14 -1.8% $1.21 10.0% 28
RY-T Royal Bank of Canada 4.2% $128.12 0.1% $5.34 7.7% 12
SJ-T Stella-Jones Inc. 1.4% $66.15 33.4% $0.92 15.0% 18
STN-T Stantec Inc. 0.9% $89.69 37.3% $0.77 8.5% 11
TD-T TD Bank 4.6% $83.88 -4.3% $3.84 7.9% 12
TFII-N TFI International 1.3% $109.40 9.3% $1.40 29.6% 12
TIH-T Toromont Industries 1.6% $108.35 10.9% $1.68 10.5% 33
TRP-T TC Energy Corp. 7.1% $51.67 -3.1% $3.69 3.4% 22
T-T Telus 5.9% $24.32 -7.6% $1.43 7.3% 19
WCN-N Waste Connections 0.7% $141.42 7.4% $1.02 7.4% 13
Averages 3.2% 5.6% 8.4% 19

Six Canadian stocks on ‘The List’ declare earnings and dividends in US dollars and are inter-listed on a US exchange in US dollars. The simplest way to display dividend and price metrics for these stocks is to show their US exchange symbols along with their US dividends and price. The stocks I am referring to have a -N at the end of their symbols. You can still buy their Canadian counterparts (-T), but your dividends will be converted into CDN dollars and will fluctuate based on the exchange rate.

Note: When the dividend and share price currency match, the calculation is straightforward. But it’s not so simple when the dividend is declared in one currency, and the share price is quoted in another. Dividing the former by the latter would produce a meaningless result because it’s a case of apples and oranges. To calculate the yield properly, you must express the dividend and share price in the same currency.

Performance of ‘The List’

Feel free to click on this link, ‘The List’ for a sortable version from our website.

Last week, ‘The List’ was up with a YTD price return of +5.6% (capital). Dividend growth remained the same and is now at +8.4% YTD, highlighting growth in income over the past year.

The best performers last week on ‘The List’ were Franco Nevada (FNV-N), up +5.19%; TD Bank (TD-T), up +3.71%; and Stantec Inc. (STN-T), up +3.26%.

Telus (T-T) was the worst performer last week, down -5.59%.


Dividend Increases

“The growth of dividend paying ability is of significance in the determination of a stock’s quality, or general safety…”

– Arnold Bernhard (the founder of Value Line)

“As a dividend increase is a positive sign of a company’s financial strength, the safest purchase, after research, is a stock with a recent dividend increase.”

– Tom Connolly (the founder of dividendgrowth.ca)

Last week, no dividend increases from companies on ‘The List’.


Earnings Releases

Benjamin Graham once remarked that earnings are the principal factor driving stock prices.

Each quarter we will provide readers with weekly earnings updates of stocks on ‘The List’ during the calendar earnings season. 

The updated earnings calendar can be found here.

Earnings growth and dividend growth tend to go hand in hand, so this information can tell us a lot about the future dividend growth of our quality companies. Monitoring our dividend growers periodically is part of the process, and reading the quarterly earnings releases is a good place to start.

No earnings reports from companies on ‘The List’ this week

Last week, no earnings reports from companies on ‘The List’.


MP Market Review – July 07, 2023

Last updated by BM on July 10, 2023

Summary 

  • This is a weekly installment of our MP Market Review series, which provides updates on the financial markets and Canadian dividend growth companies we monitor on ‘The List’.
  • Last week, ‘The List’ was down with a YTD price return of +4.6% (capital). Dividend growth remained the same and is now at +8.4% YTD, highlighting growth in income over the past year.
  • Last week, no dividend increases from companies on ‘The List’.
  • Last week, no earnings reports from companies on ‘The List’.
  • No companies on ‘The List’ are due to report earnings this week.
  • If you’re interested in creating your own dividend growth income portfolio, consider subscribing to our premium service, which grants you access to the MP Wealth-Builder Model Portfolio (CDN) and exclusive subscriber-only content.  Learn More         

One of the most powerful concepts we have learned is how dividends work and how they ultimately drive portfolio performance. In the chart above, notice how Canadian National Railways dividend has driven it’s price higher in lock step with dividend growth over the last decade. 

Introduction

“You have a pair of pants. In the left pocket, you have $100. You take $1 out of the left pocket and put it in the right pocket. You now have $101. There is no diminution of dollars in your left pocket. That is one magic pair of pants.”

This ‘magic pants’ analogy was from a Seeking Alpha article on dividend investing I read about a decade ago and was one of the catalysts for me to take a closer look at this type of investing and see if it truly was magical. 

After conducting additional research, I have shifted towards utilizing a dividend growth investing (DGI) strategy as my primary investment approach. While I maintain portfolios consisting of high-quality dividend growers from both the United States and Canada, I have opted to concentrate on Canadian (CDN) dividend growth companies in this blog. This is due to several reasons, including a smaller pool of DGI companies to track, a lack of coverage for the DGI strategy by the North American investment media, and a tendency for those who do cover DGI to narrowly focus on only a handful of sectors (Energy and Financials).

While ‘The List’ is not a portfolio in itself, it serves as an excellent initial reference for individuals seeking to diversify their investments and attain higher returns in the Canadian stock market. Through our blog, we provide weekly updates on ‘The List’ and offer valuable perspectives and real-life examples of the dividend growth investing strategy in practice. This helps readers gain a deeper understanding of how to implement and benefit from this investment approach.


DGI Thoughts

“You want to start your dividend growth retirement portfolio as early as you can so that, come retirement, more of your portfolio is ‘bondified’. That way, most of your retirement portfolio is free from market risk. Bondified, to me, means the distance between your purchase price and the current price is really large.”

– Tom Connolly

One of the many concepts I have learned about dividend growth investing from Tom Connolly is the term ‘bondified’. Regardless on whether you have an issue with yield on cost or growth yield, the concept is important.

Many of the stocks on ‘The List’ are, ‘bondified’ already. We’ve owned them for years, they produce growing income and they have been driven well above our purchase price by the growing dividends. Bonds provide fixed income only.

Here’s a ‘bondified’ example.

In the year 2008, Canadian National Railway’s dividend was $0.46, it is now $3.16, up 587%! The yield was ~2.0% in 2008 and the yield today is ~2.0%. What must have happened? In 2008, Canadian National Railway’s price was $23.04, it is now $153.52, up 566%.

The difference between your purchase price and the current price is what makes Canadian National Railway ‘bondified’. Bonds do not provide that type of income and capital growth. This investment made 15 years ago now becomes our fixed income component in asset allocation (if I had a fixed income component). Do the math on any of the other companies on ‘The List’ with 15 plus years of dividend growth and see what you discover for yourself.

Think of all the advisors out there who switch their clients from stocks to bonds as retirement approaches. Is that the best approach? Start your dividend growth investing journey early enough and you won’t have to worry.

If you have not yet joined as a subscriber of the blog to receive DGI Alerts on the activity and content related to our model portfolio, it’s not too late. Click Here. 

Recent News 

B.C. port strike sends ripples across Canadian economy (Globe & Mail)

https://www.theglobeandmail.com/business/article-bc-port-workers-strike-economy/

The strike by B.C. port workers is sending ripples across the Canadian economy as everyone from Saskatchewan potash exporters to Ontario importers of industrial parts feels the impact of the walkout that enters its 10th day on Monday.”

When I read articles like this one, I think of opportunity. The probability of this strike lasting for an extended period of time is relatively low. The effect these short-term narratives have on stock prices, however can be meaningful. We will have to wait and see what the market gives us.

To receive breaking news about companies on ‘The List’ follow us on Twitter @MagicPants_DGI.

The List (2023)

Last updated by BM on July 07, 2023

The Magic Pants List contains 27 Canadian dividend growth stocks. ‘The List’ contains Canadian companies that have raised their dividend yearly for at least the last ten years and have a market cap of over a billion dollars. Below is each stock’s symbol, name, current yield, current price, price return year-to-date, current dividend, dividend growth year-to-date and current dividend growth streak. Companies on ‘The List’ are added or subtracted once a year, on January 1. After that, ‘The List’ is set for the next twelve months. Prices and dividends are updated weekly.

SYMBOL COMPANY YLD PRICE YTD % DIV YTD % STREAK
AQN-N Algonquin Power & Utilities 6.4% $7.87 16.9% $0.51 -29.0% 12
ATD-T Alimentation Couche-Tard Inc. 0.9% $65.26 8.5% $0.56 19.1% 13
BCE-T Bell Canada 6.4% $59.54 -1.1% $3.82 5.0% 14
BIP-N Brookfield Infrastructure Partners 4.4% $35.65 5.2% $1.44 6.3% 15
CCL-B-T CCL Industries 1.6% $64.39 10.9% $1.06 10.4% 21
CNR-T Canadian National Railway 2.1% $153.52 -5.7% $3.16 7.8% 27
CTC-A-T Canadian Tire 3.8% $181.87 24.1% $6.90 17.9% 12
CU-T Canadian Utilities Limited 5.3% $33.82 -8.4% $1.79 1.0% 51
DOL-T Dollarama Inc. 0.3% $87.10 9.1% $0.27 23.8% 12
EMA-T Emera 5.1% $53.76 2.2% $2.76 3.0% 16
ENB-T Enbridge Inc. 7.3% $48.38 -9.3% $3.55 3.2% 27
ENGH-T Enghouse Systems Limited 2.7% $31.48 -11.8% $0.85 18.2% 16
FNV-N Franco Nevada 1.0% $138.73 0.4% $1.36 6.3% 15
FTS-T Fortis 4.0% $55.98 1.2% $2.26 4.1% 49
IFC-T Intact Financial 2.2% $199.30 1.8% $4.40 10.0% 18
L-T Loblaws 1.5% $118.66 -1.4% $1.74 10.3% 11
MGA-N Magna 3.2% $58.18 1.1% $1.84 2.2% 13
MRU-T Metro 1.7% $73.09 -3.2% $1.21 10.0% 28
RY-T Royal Bank of Canada 4.3% $125.52 -2.0% $5.34 7.7% 12
SJ-T Stella-Jones Inc. 1.4% $68.10 37.4% $0.92 15.0% 18
STN-T Stantec Inc. 0.9% $86.86 33.0% $0.77 8.5% 11
TD-T TD Bank 4.7% $80.88 -7.7% $3.84 7.9% 12
TFII-N TFI International 1.2% $112.22 12.1% $1.40 29.6% 12
TIH-T Toromont Industries 1.5% $108.65 11.2% $1.68 10.5% 33
TRP-T TC Energy Corp. 7.1% $52.00 -2.4% $3.69 3.4% 22
T-T Telus 5.5% $25.76 -2.1% $1.43 7.3% 19
WCN-N Waste Connections 0.7% $138.80 5.4% $1.02 7.4% 13
Averages 3.2% 4.6% 8.4% 19

Six Canadian stocks on ‘The List’ declare earnings and dividends in US dollars and are inter-listed on a US exchange in US dollars. The simplest way to display dividend and price metrics for these stocks is to show their US exchange symbols along with their US dividends and price. The stocks I am referring to have a -N at the end of their symbols. You can still buy their Canadian counterparts (-T), but your dividends will be converted into CDN dollars and will fluctuate based on the exchange rate.

Note: When the dividend and share price currency match, the calculation is straightforward. But it’s not so simple when the dividend is declared in one currency, and the share price is quoted in another. Dividing the former by the latter would produce a meaningless result because it’s a case of apples and oranges. To calculate the yield properly, you must express the dividend and share price in the same currency.

Performance of ‘The List’

Feel free to click on this link, ‘The List’ for a sortable version from our website.

Last week, ‘The List’ was down with a YTD price return of +4.6% (capital). Dividend growth remained the same and is now at +8.4% YTD, highlighting growth in income over the past year.

The best performers last week on ‘The List’ were Magna (MGA-N), up +3.08%; Stantec Inc. (STN-T), up +0.43%; and Canadian Tire (CTC-A-T), up +0.41%.

Algonquin Power & Utilities (AQN-N) was the worst performer last week, down -4.72%.


Dividend Increases

“The growth of dividend paying ability is of significance in the determination of a stock’s quality, or general safety…”

– Arnold Bernhard (the founder of Value Line)

“As a dividend increase is a positive sign of a company’s financial strength, the safest purchase, after research, is a stock with a recent dividend increase.”

– Tom Connolly (the founder of dividendgrowth.ca)

Last week, no dividend increases from companies on ‘The List’.


Earnings Releases

Benjamin Graham once remarked that earnings are the principal factor driving stock prices.

Each quarter we will provide readers with weekly earnings updates of stocks on ‘The List’ during the calendar earnings season. 

The updated earnings calendar can be found here.

Earnings growth and dividend growth tend to go hand in hand, so this information can tell us a lot about the future dividend growth of our quality companies. Monitoring our dividend growers periodically is part of the process, and reading the quarterly earnings releases is a good place to start.

No earnings reports from companies on ‘The List’ this week

Last week, no earnings reports from companies on ‘The List’.


MP Market Review – June 30, 2023

Last updated by BM on July 03, 2023

Summary 

  • This is a weekly installment of our MP Market Review series, which provides updates on the financial markets and Canadian dividend growth companies we monitor on ‘The List’.
  • Last week, ‘The List’ was up significantly with a YTD price return of +6.3% (capital). Dividend growth remained the same and is now at +8.4% YTD, highlighting growth in income over the past year.
  • Last week, no dividend increases from companies on ‘The List’.
  • Last week, one earnings report from companies on ‘The List’.
  • No companies on ‘The List’ are due to report earnings this week.
  • If you’re interested in creating your own dividend growth income portfolio, consider subscribing to our premium service, which grants you access to the MP Wealth-Builder Model Portfolio (CDN) and exclusive subscriber-only content.  Learn More         

One of the most powerful concepts we have learned is how dividends work and how they ultimately drive portfolio performance. In the chart above, notice how Canadian National Railways dividend has driven it’s price higher in lock step with dividend growth over the last decade. 

Introduction

“You have a pair of pants. In the left pocket, you have $100. You take $1 out of the left pocket and put it in the right pocket. You now have $101. There is no diminution of dollars in your left pocket. That is one magic pair of pants.”

This ‘magic pants’ analogy was from a Seeking Alpha article on dividend investing I read about a decade ago and was one of the catalysts for me to take a closer look at this type of investing and see if it truly was magical. 

After conducting additional research, I have shifted towards utilizing a dividend growth investing (DGI) strategy as my primary investment approach. While I maintain portfolios consisting of high-quality dividend growers from both the United States and Canada, I have opted to concentrate on Canadian (CDN) dividend growth companies in this blog. This is due to several reasons, including a smaller pool of DGI companies to track, a lack of coverage for the DGI strategy by the North American investment media, and a tendency for those who do cover DGI to narrowly focus on only a handful of sectors (Energy and Financials).

While ‘The List’ is not a portfolio in itself, it serves as an excellent initial reference for individuals seeking to diversify their investments and attain higher returns in the Canadian stock market. Through our blog, we provide weekly updates on ‘The List’ and offer valuable perspectives and real-life examples of the dividend growth investing strategy in practice. This helps readers gain a deeper understanding of how to implement and benefit from this investment approach.


DGI Thoughts

“Nowhere does history indulge in repetitions so often or so uniformly as in Wall Street. When you read contemporary accounts of booms or panics, the one thing that strikes you most forcibly is how little either stock speculation or stock speculators today differ from yesterday. The game does not change and neither does human nature.”

– Edwin Lefevre, Writer and Journalist, 1923

Recently, I had the opportunity to engage in a conversation with a young investor regarding dividend growth investing and his investment approach. Sadly, the game has not changed for this young man. Despite all the history and recent events which seem to support our strategy, he is waiting on the sidelines in cash and some precious metal investments to reap the rewards when the market finally crashes. He feels this is his opportunity to build his wealth. Will his emotions get the better of him when the market finally crashes, or will he think the market will go even lower? What will he invest in? Will he try and time the market again if he is successful? What is the probability he will be able to repeat his process in the future? History has not been kind to this young investor’s approach but if there’s ever a time to take a chance and explore new possibilities, it’s when you’re young and have a limited amount of capital to invest.

As dividend growth investors, we find ourselves with fewer uncertainties to address. We understand how to navigate all market conditions. Dividend growth investing’s foundation is firmly planted in the past and the history of how economics and wealth generation were formed. The problem with building a foundation on something new is that rarely has it been tested. Jumping to something new often results in rebuilding your structure often.

In our content, we frequently reference the past, not because we are fixated on it or believe that today’s world is worse off, but because it offers valuable lessons. One of the most powerful concepts we have learned is how dividends work and how they ultimately drive portfolio performance.

On this blog, we want to repeat the successful journey of those great investors who came before us and not those who were once successful ‘coin flippers’ like the ones in our Top Posts story about being lucky or being good. Human nature can sometimes get the best of us, but having a time-tested process helps a lot when our emotions start to take over.

If you have not yet joined as a subscriber of the blog to receive DGI Alerts on the activity and content related to our model portfolio, it’s not too late. Click Here. 

Recent News 

O Canada, it’s a good place to invest, eh? (Globe & Mail)

https://www.theglobeandmail.com/investing/education/article-o-canada-its-a-good-place-to-invest-eh/

Some good points by the author on investing in Canada. My favorite point is the one on the dividend tax credit. The magic of dividend growth investing continues to impress.

“One reason I love dividends is that they are taxed at much lower rates than regular income. For example, an investor in Ontario with annual income of $100,000 would face a marginal tax rate of just 12.24 per cent on eligible dividends. That compares with a marginal rate of 33.89 per cent on interest or employment income. Thanks to the dividend tax credit (DTC), in some provinces, it’s even possible to have a negative tax rate on dividends if your income is below a certain level (in Ontario and British Columbia, for example, the threshold is $53,359). The DTC is a non-refundable credit, meaning the government won’t send you a cheque for the negative amount, but you can use it to reduce your other taxes owing. Another plus for Canadian investors is the 50-per-cent inclusion rate on capital gains, which means you’ll pay half as much tax when you sell a stock for a profit as you would making the same amount of income in salary or interest.”

An investor’s roadmap for avoiding those dreaded dividend cuts (Globe & Mail)

https://www.theglobeandmail.com/investing/investment-ideas/article-an-investors-roadmap-for-avoiding-those-dreaded-dividend-cuts/

While investing in high-quality dividend growth stocks can reduce the likelihood of a dividend cut, it’s essential to acknowledge that such events have occurred periodically. To mitigate this risk, it is crucial to stay informed about the companies you invest in and monitor any changes that might deviate from your initial investment thesis. The author raises a valid point regarding yields. Yields serve as signals, and an excessively high yield (above historical norms) should be seen as a warning sign.

To receive breaking news about companies on ‘The List’ follow us on Twitter @MagicPants_DGI.

The List (2023)

Last updated by BM on June 30, 2023

The Magic Pants List contains 27 Canadian dividend growth stocks. ‘The List’ contains Canadian companies that have raised their dividend yearly for at least the last ten years and have a market cap of over a billion dollars. Below is each stock’s symbol, name, current yield, current price, price return year-to-date, current dividend, dividend growth year-to-date and current dividend growth streak. Companies on ‘The List’ are added or subtracted once a year, on January 1. After that, ‘The List’ is set for the next twelve months. Prices and dividends are updated weekly.

SYMBOL COMPANY YLD PRICE YTD % DIV YTD % STREAK
AQN-N Algonquin Power & Utilities 6.1% $8.26 22.7% $0.51 -29.0% 12
ATD-T Alimentation Couche-Tard Inc. 0.8% $67.93 13.0% $0.56 19.1% 13
BCE-T Bell Canada 6.3% $60.40 0.3% $3.82 5.0% 14
BIP-N Brookfield Infrastructure Partners 4.4% $36.50 5.2% $1.44 6.3% 15
CCL-B-T CCL Industries 1.6% $65.12 12.2% $1.06 10.4% 21
CNR-T Canadian National Railway 2.0% $160.42 -1.5% $3.16 7.8% 27
CTC-A-T Canadian Tire 3.8% $181.12 23.6% $6.90 17.9% 12
CU-T Canadian Utilities Limited 5.2% $34.31 -7.1% $1.79 1.0% 51
DOL-T Dollarama Inc. 0.3% $89.72 12.3% $0.27 23.8% 12
EMA-T Emera 5.1% $54.56 3.7% $2.76 3.0% 16
ENB-T Enbridge Inc. 7.2% $49.24 -7.7% $3.55 3.2% 27
ENGH-T Enghouse Systems Limited 2.6% $32.19 -9.9% $0.85 18.2% 16
FNV-N Franco Nevada 1.0% $142.60 3.2% $1.36 6.3% 15
FTS-T Fortis 4.0% $57.09 3.2% $2.26 4.1% 49
IFC-T Intact Financial 2.2% $204.54 4.5% $4.40 10.0% 18
L-T Loblaws 1.4% $121.28 0.8% $1.74 10.3% 11
MGA-N Magna 3.3% $56.44 -1.9% $1.84 2.2% 13
MRU-T Metro 1.6% $74.82 -0.9% $1.21 10.0% 28
RY-T Royal Bank of Canada 4.2% $126.52 -1.2% $5.34 7.7% 12
SJ-T Stella-Jones Inc. 1.3% $68.22 37.6% $0.92 15.0% 18
STN-T Stantec Inc. 0.9% $86.49 32.4% $0.77 8.5% 11
TD-T TD Bank 4.7% $82.11 -6.3% $3.84 7.9% 12
TFII-N TFI International 1.2% $113.96 13.8% $1.40 29.6% 12
TIH-T Toromont Industries 1.5% $108.83 11.4% $1.68 10.5% 33
TRP-T TC Energy Corp. 6.9% $53.54 0.5% $3.69 3.4% 22
T-T Telus 5.5% $25.78 -2.1% $1.43 7.3% 19
WCN-N Waste Connections 0.7% $142.93 8.5% $1.02 7.4% 13
Averages 3.2% 6.3% 8.4% 19

Six Canadian stocks on ‘The List’ declare earnings and dividends in US dollars and are inter-listed on a US exchange in US dollars. The simplest way to display dividend and price metrics for these stocks is to show their US exchange symbols along with their US dividends and price. The stocks I am referring to have a -N at the end of their symbols. You can still buy their Canadian counterparts (-T), but your dividends will be converted into CDN dollars and will fluctuate based on the exchange rate.

Note: When the dividend and share price currency match, the calculation is straightforward. But it’s not so simple when the dividend is declared in one currency, and the share price is quoted in another. Dividing the former by the latter would produce a meaningless result because it’s a case of apples and oranges. To calculate the yield properly, you must express the dividend and share price in the same currency.

Performance of ‘The List’

Feel free to click on this link, ‘The List’ for a sortable version from our website.

Last week, ‘The List’ was up significantly with a YTD price return of +6.3% (capital). Dividend growth remained the same and is now at +8.4% YTD, highlighting growth in income over the past year.

The best performers last week on ‘The List’ were Magna (MGA-N), up +8.48%; TFI International (TFII-T), up +7.87%; and Alimentation Couche-Tard Inc. (ATD-T), up +7.01%.

Canadian Utilities Limited (CU-T) was the worst performer last week, down -0.12%.


Dividend Increases

“The growth of dividend paying ability is of significance in the determination of a stock’s quality, or general safety…”

– Arnold Bernhard (the founder of Value Line)

“As a dividend increase is a positive sign of a company’s financial strength, the safest purchase, after research, is a stock with a recent dividend increase.”

– Tom Connolly (the founder of dividendgrowth.ca)

Last week, no dividend increases from companies on ‘The List’.


Earnings Releases

Benjamin Graham once remarked that earnings are the principal factor driving stock prices.

Each quarter we will provide readers with weekly earnings updates of stocks on ‘The List’ during the calendar earnings season. 

The updated earnings calendar can be found here.

Earnings growth and dividend growth tend to go hand in hand, so this information can tell us a lot about the future dividend growth of our quality companies. Monitoring our dividend growers periodically is part of the process, and reading the quarterly earnings releases is a good place to start.

No earnings reports from companies on ‘The List’ this week

Last week, one earnings report from companies on ‘The List’.

Alimentation Couche-Tard Inc. (ATD-T) released its fourth-quarter fiscal 2023 results on Tuesday, June 27, 2023, after markets closed.

“We are pleased to announce an exceptional fiscal year as well as strong fourth quarter results. Even more so, we are proud to share that we have hit our five-year Double Again strategic goal. This is a particularly amazing achievement as during three of those five years we faced historic global challenges including a pandemic, inflation, labor and supply shortages, and war bordering our European markets. While many organizations chart ambitious strategic plans, they can lose momentum along the way. We were able to march forward – growing, innovating, and producing remarkable financial results – because of our award-winning engaged team members and customer-centric culture.”

– Brian Hannasch, President and Chief Executive Officer

Highlights:

Fourth Quarter of fiscal 2023

  • Net earnings were $670.7 million, or $0.68 per diluted share for the fourth quarter of fiscal 2023 compared with $477.7 million, or $0.46 per diluted share for the fourth quarter of fiscal 2022. Adjusted net earnings were approximately $698.0 million compared with $573.0 million for the fourth quarter of fiscal 2022. Adjusted diluted net earnings per share were $0.71, representing an increase of 29.1% from $0.55 for the corresponding quarter of last year.
  • Total merchandise and service revenues of $4.2 billion, an increase of 11.0%. Same-store merchandise revenues increased by 3.3% in the United States, by 3.0% in Europe and other regions, and by 5.9% in Canada.
  • Merchandise and service gross margin increased by 1.0% in the United States to 34.1%, by 2.6% in Europe and other regions to 40.9%, and by 1.7% in Canada to 34.1%, all impacted favorably by a change in product mix.
  • Same-store road transportation fuel volumes increased by 0.8% in the United States, by 6.0% in Canada, and decreased by 2.4% in Europe and other regions.
  • Road transportation fuel gross margin of 45.34¢ per gallon in the United States, a decrease of 0.78¢ per gallon, and of CA 12.13¢ per liter in Canada, a decrease of CA 1.28¢ per liter. In Europe and other regions, the road transportation fuel margin was US 10.60¢ per liter, an increase of US 3.09¢ per liter, due to the geopolitical context and difficult supply conditions during the comparable quarter. Fuel margins remained healthy throughout the network due to favorable market conditions and the continued work on the optimization of the supply chain.
  • Growth of expenses for the fourth quarter of fiscal 2023 was 8.8%, while normalized growth of expenses, when factoring in the estimated impact of the 13th week in the fourth quarter of fiscal 2023, remained lower than the average inflation observed throughout our network of 5.8%.
  • On April 21, 2023, we amended our operating credit facility to increase the maximum amount available from $2.5 billion to $3.5 billion. The maximum amount available includes a first tranche of $1.0 billion and a second tranche of $2.5 billion, maturing in April 2026 and April 2028, respectively.
  • During the quarter, the Corporation concluded the acquisition of 65 express tunnel car wash sites and 55 company-owned and operated convenience and retail fuel sites in the United States. The Corporation also entered into a binding agreement to acquire 112 company-owned and operated convenience retail and fuel sites in the United States.
  • During the quarter, the Corporation agreed to a firm and irrevocable offer to acquire 2,193 sites located in Germany, Belgium, Netherlands, and Luxembourg.

Outlook:

BMO Capital analyst Tamy Chen notes that a highlight from the Couche-Tard earnings call was management’s “more optimistic tone” on M&A following years of subdued acquisition activity due to high purchase multiples across the industry.

“We continue to see runway for growth from both organic initiatives (ongoing roll-out of the fuel rebrand program and improving the fresh food offering) and global M&A opportunities.”

Chen says valuation as still reasonable with the stock trading at 11x forward 12-month EBITDA forecast vs. the historical 10-12x range.

Source: (ATD-T) Q4-2023 Earnings Release


MP Market Review – June 23, 2023

Last updated by BM on June 26, 2023

Summary 

  • This is a weekly installment of our MP Market Review series, which provides updates on the financial markets and Canadian dividend growth companies we monitor on ‘The List’.
  • Last week, ‘The List’ was down with a YTD price return of +2.2% (capital). Dividend growth remained the same and is now at +8.4% YTD, highlighting growth in income over the past year.
  • Last week, no dividend increases from companies on ‘The List’.
  • Last week, no earnings reports from companies on ‘The List’.
  • One company on ‘The List’ is due to report earnings this week.
  • If you’re interested in creating your own dividend growth income portfolio, consider subscribing to our premium service, which grants you access to the MP Wealth-Builder Model Portfolio (CDN) and exclusive subscriber-only content.  Learn More         

Introduction

“You have a pair of pants. In the left pocket, you have $100. You take $1 out of the left pocket and put it in the right pocket. You now have $101. There is no diminution of dollars in your left pocket. That is one magic pair of pants.”

This ‘magic pants’ analogy was from a Seeking Alpha article on dividend investing I read about a decade ago and was one of the catalysts for me to take a closer look at this type of investing and see if it truly was magical. 

After conducting additional research, I have shifted towards utilizing a dividend growth investing (DGI) strategy as my primary investment approach. While I maintain portfolios consisting of high-quality dividend growers from both the United States and Canada, I have opted to concentrate on Canadian (CDN) dividend growth companies in this blog. This is due to several reasons, including a smaller pool of DGI companies to track, a lack of coverage for the DGI strategy by the North American investment media, and a tendency for those who do cover DGI to narrowly focus on only a handful of sectors (Energy and Financials).

While ‘The List’ is not a portfolio in itself, it serves as an excellent initial reference for individuals seeking to diversify their investments and attain higher returns in the Canadian stock market. Through our blog, we provide weekly updates on ‘The List’ and offer valuable perspectives and real-life examples of the dividend growth investing strategy in practice. This helps readers gain a deeper understanding of how to implement and benefit from this investment approach.

DGI Thoughts

“What’s an investment, anyhow, but a body of capital that produces income. The income maybe current income, or it may be prospective income, but is is the magnitude of the income, current or prospective, that determines the value of the capital which produces it. “

– Arnold Bernhard, page 21, The Evaluation of Common Stocks, 1959

When markets are falling or going sideways, I have always taken comfort in looking at the income my investments produce. Unlike most growth-only investors, we do not have to wait on our excellent dividend growers to go up in value to generate income to pay our bills or have fun with.

The link below is a table with each stock in ‘The List’ sorted by total dividends paid over the last ten years.

THE LIST 10YR_DIV_PAID

The average is a little over 45% of your initial investment ($4,539) being returned to you in the form of dividends over the last decade. Starting yield (YLD ’13) has a big impact on dividends paid in the first ten years but some of our low yield high growth stocks are gaining fast. It will be interesting to publish this report in another ten years’ time to see how the order has changed.

If you have not yet joined as a subscriber of the blog to receive DGI Alerts on the activity and content related to our model portfolio, it’s not too late. Click Here. 

Recent News 

Is there a new bull market on the horizon? (Globe & Mail)

https://www.theglobeandmail.com/investing/article-new-bull-market/

According to the author, the rise in Artificial Intelligence companies recently and renewed strength in the real estate sector have some thinking a new bull market is just around the corner.

Bull or Bear markets don’t really affect how we execute our process except for the fact that we acquire good dividend growers at lower valuations during market downturns. Being in the market is more important to us than trying to time it.

A gameplan for savers and conservative investors who think interest rates will go higher (Globe & Mail)

https://www.theglobeandmail.com/investing/personal-finance/carrick-on-money/article-rob-carrick-a-gameplan-for-savers-and-conservative-investors-who-think/

The author recommends looking at High-Interest Savings Accounts (HISAs). Rates are around 5% right now.

We prefer to invest in dividend growth companies that offer similar yields to HISAs yet grow their yields every year. Interest income is also taxed at a higher rate than our dividend income which takes the shine off these investments as well. Not a bad idea to use HISAs to earn a little extra in the short term while you wait to deploy some of your cash in good dividend growers but as a long-term investment we think there are better alternatives.

To receive breaking news about companies on ‘The List’ follow us on Twitter @MagicPants_DGI.

The List (2023)

Last updated by BM on June 23, 2023

The Magic Pants List contains 27 Canadian dividend growth stocks. ‘The List’ contains Canadian companies that have raised their dividend yearly for at least the last ten years and have a market cap of over a billion dollars. Below is each stock’s symbol, name, current yield, current price, price return year-to-date, current dividend, dividend growth year-to-date and current dividend growth streak. Companies on ‘The List’ are added or subtracted once a year, on January 1. After that, ‘The List’ is set for the next twelve months. Prices and dividends are updated weekly.

SYMBOL COMPANY YLD PRICE YTD % DIV YTD % STREAK
AQN-N Algonquin Power & Utilities 6.3% $8.05 19.6% $0.51 -29.0% 12
ATD-T Alimentation Couche-Tard Inc. 0.9% $63.48 5.6% $0.56 19.1% 13
BCE-T Bell Canada 6.5% $58.82 -2.3% $3.82 5.0% 14
BIP-N Brookfield Infrastructure Partners 4.4% $35.06 5.2% $1.44 6.3% 15
CCL-B-T CCL Industries 1.7% $61.89 6.6% $1.06 10.4% 21
CNR-T Canadian National Railway 2.0% $155.32 -4.6% $3.16 7.8% 27
CTC-A-T Canadian Tire 4.0% $170.53 16.3% $6.90 17.9% 12
CU-T Canadian Utilities Limited 5.2% $34.35 -7.0% $1.79 1.0% 51
DOL-T Dollarama Inc. 0.3% $86.36 8.1% $0.27 23.8% 12
EMA-T Emera 5.2% $53.38 1.4% $2.76 3.0% 16
ENB-T Enbridge Inc. 7.4% $47.74 -10.5% $3.55 3.2% 27
ENGH-T Enghouse Systems Limited 2.7% $31.41 -12.0% $0.85 18.2% 16
FNV-N Franco Nevada 1.0% $139.15 0.7% $1.36 6.3% 15
FTS-T Fortis 4.1% $55.43 0.2% $2.26 4.1% 49
IFC-T Intact Financial 2.2% $195.74 0.0% $4.40 10.0% 18
L-T Loblaws 1.5% $116.39 -3.3% $1.74 10.3% 11
MGA-N Magna 3.5% $52.03 -9.5% $1.84 2.2% 13
MRU-T Metro 1.7% $71.91 -4.7% $1.21 10.0% 28
RY-T Royal Bank of Canada 4.4% $122.32 -4.5% $5.34 7.7% 12
SJ-T Stella-Jones Inc. 1.4% $64.37 29.8% $0.92 15.0% 18
STN-T Stantec Inc. 0.9% $82.86 26.8% $0.77 8.5% 11
TD-T TD Bank 4.9% $78.00 -11.0% $3.84 7.9% 12
TFII-N TFI International 1.3% $105.65 5.5% $1.40 29.6% 12
TIH-T Toromont Industries 1.6% $104.30 6.7% $1.68 10.5% 33
TRP-T TC Energy Corp. 7.1% $51.81 -2.8% $3.69 3.4% 22
T-T Telus 5.6% $25.35 -3.7% $1.43 7.3% 19
WCN-N Waste Connections 0.7% $136.10 3.3% $1.02 7.4% 13
Averages 3.3% 2.2% 8.4% 19

Six Canadian stocks on ‘The List’ declare earnings and dividends in US dollars and are inter-listed on a US exchange in US dollars. The simplest way to display dividend and price metrics for these stocks is to show their US exchange symbols along with their US dividends and price. The stocks I am referring to have a -N at the end of their symbols. You can still buy their Canadian counterparts (-T), but your dividends will be converted into CDN dollars and will fluctuate based on the exchange rate.

Note: When the dividend and share price currency match, the calculation is straightforward. But it’s not so simple when the dividend is declared in one currency, and the share price is quoted in another. Dividing the former by the latter would produce a meaningless result because it’s a case of apples and oranges. To calculate the yield properly, you must express the dividend and share price in the same currency.

Performance of ‘The List’

Feel free to click on this link, ‘The List’ for a sortable version from our website.

Last week, ‘The List’ was down with a YTD price return of +2.2% (capital). Dividend growth remained the same and is now at +8.4% YTD, highlighting growth in income over the past year.

The best performers last week on ‘The List’ were Metro (MRU-T), up +1.08%; Loblaws (L-T), up +1.02%; and CCL Industries (CCL-B-T), up +0.15%.

Magna (MGA-T) was the worst performer last week, down -8.7%.


Dividend Increases

“The growth of dividend paying ability is of significance in the determination of a stock’s quality, or general safety…”

– Arnold Bernhard (the founder of Value Line)

“As a dividend increase is a positive sign of a company’s financial strength, the safest purchase, after research, is a stock with a recent dividend increase.”

– Tom Connolly (the founder of dividendgrowth.ca)

Last week, no dividend increases from companies on ‘The List’.


Earnings Releases

Benjamin Graham once remarked that earnings are the principal factor driving stock prices.

Each quarter we will provide readers with weekly earnings updates of stocks on ‘The List’ during the calendar earnings season. 

The updated earnings calendar can be found here.

Earnings growth and dividend growth tend to go hand in hand, so this information can tell us a lot about the future dividend growth of our quality companies. Monitoring our dividend growers periodically is part of the process, and reading the quarterly earnings releases is a good place to start.

One earnings report from companies on ‘The List’ this week

Alimentation Couche-Tard Inc. (ATD-T) will release its fourth-quarter fiscal 2023 results on Tuesday, June 27, 2023, after markets close.

Last week, No earnings reports from companies on ‘The List’.


MP Market Review – June 16, 2023

Last updated by BM on June 19, 2023

Summary 

  • This is a weekly installment of our MP Market Review series, which provides updates on the financial markets and Canadian dividend growth companies we monitor on ‘The List’.
  • Last week, ‘The List’ was up slightly with a YTD price return of +4.3% (capital). Dividend growth remained the same and is now at +8.4% YTD, highlighting growth in income over the past year.
  • Last week, no dividend increases from companies on ‘The List’.
  • Last week, one earnings report from companies on ‘The List’.
  • No companies on ‘The List’ are due to report earnings this week.
  • If you’re interested in creating your own dividend growth income portfolio, consider subscribing to our premium service, which grants you access to the MP Wealth-Builder Model Portfolio (CDN) and exclusive subscriber-only content.  Learn More         

Introduction

“You have a pair of pants. In the left pocket, you have $100. You take $1 out of the left pocket and put it in the right pocket. You now have $101. There is no diminution of dollars in your left pocket. That is one magic pair of pants.”

This ‘magic pants’ analogy was from a Seeking Alpha article on dividend investing I read about a decade ago and was one of the catalysts for me to take a closer look at this type of investing and see if it truly was magical. 

After conducting additional research, I have shifted towards utilizing a dividend growth investing (DGI) strategy as my primary investment approach. While I maintain portfolios consisting of high-quality dividend growers from both the United States and Canada, I have opted to concentrate on Canadian (CDN) dividend growth companies in this blog. This is due to several reasons, including a smaller pool of DGI companies to track, a lack of coverage for the DGI strategy by the North American investment media, and a tendency for those who do cover DGI to narrowly focus on only a handful of sectors (Energy and Financials).

While ‘The List’ is not a portfolio in itself, it serves as an excellent initial reference for individuals seeking to diversify their investments and attain higher returns in the Canadian stock market. Through our blog, we provide weekly updates on ‘The List’ and offer valuable perspectives and real-life examples of the dividend growth investing strategy in practice. This helps readers gain a deeper understanding of how to implement and benefit from this investment approach.

DGI Thoughts

“Since the S&P500 was created in 1957, there have been 10 recessions. Aside from the Covid-19 recession of 2020, which only lasted two months, the other nine recessions were preceded by high inflation and triggered by the Fed raising interest rates. Each recession ended as the Fed began lowering interest rates, loosening monetary policy, and often coincided with increased government spending, known as fiscal expansion…”

– Bryan M. Kuderna, author of Millennial Millionaire

Predicting the next recession is difficult but if you are honest with yourself the probability of one within the next twelve months is increasing. Recessions aren’t necessarily a bad thing for dividend growth investors as we do get to buy more income at attractive valuations.

In March 2020 (the last recession) within our original Wealth-Builder Portfolio, we executed on our process and did very well.

Although a 50% capital return (on average) over three years is nothing to sneeze at, I am most proud of the current return we now get from dividends alone (6.33%).

You would get an average yield today of 4.4% for these four stocks. Still pretty good but I’ll take a 5% starting yield on quality dividend growers any day. Recessions give us the opportunity to buy more income at better prices, accelerating our total returns when the economy picks up.

As investors who focus on dividend growth, we distinguish ourselves through our patient approach toward buying opportunities, our readiness to hold cash for price pullbacks, and our unwavering confidence in the economy’s ability to recover.

If you have not yet joined as a subscriber of the blog to receive DGI Alerts on the activity and content related to our model portfolio, it’s not too late. Click Here. 

Recent News 

Stress Test transcript: ‘Punched in the face by my investments’: How to endure stock market swings (Globe & Mail)

https://www.theglobeandmail.com/featured-reports/article-stress-test-transcript-punched-in-the-face-by-my-investments-how-to/

Found this conversation between two financial writers from the Globe & Mail and an Investment Advisor interesting and typical of the advice being given to new investors. Not much different from the past except they recommend ETFs now.

Good advice from the article:

  • Resist the urge to act on headlines
  • Volatility is part of investing; use it to invest in your portfolio
  • Delete trading apps on your phone
  • Invest for the long term
  • Market timing doesn’t work

Not so good advice:

  • Learn to accept that it could be 5-10 years before you see a positive return on your investment
  • Invest in ETFs as they give you lots of diversification
  • Invest 80% in stocks and 20% in bonds

Do we have to wait 5-10 years for a return on our investments? Our dividends show up early and often and dividend increases are announced like clock work every year and sometimes twice a year. Capital returns magically follow the increase in the dividend.

Bell says it will eliminate 1,300 positions, close or sell nine radio stations amid declining revenues (Globe & Mail)

https://www.theglobeandmail.com/business/article-bce-layoffs-radio-stations/

Headlines like this are starting to appear more often as recession fears and increased competition begin to take hold.

“In a separate memo, Bell Media president Wade Oosterman blamed the cuts on “major disruption” to the industry due to a combination of customer cord cutting and the shift of advertising revenue to foreign digital platforms.”

Bell Canada is one of the ‘Core’ stocks in our model portfolio so we will be paying attention to the next earnings release to learn more.

To receive breaking news about companies on ‘The List’ follow us on Twitter @MagicPants_DGI.

The List (2023)

Last updated by BM on June 16, 2023

The Magic Pants List contains 27 Canadian dividend growth stocks. ‘The List’ contains Canadian companies that have raised their dividend yearly for at least the last ten years and have a market cap of over a billion dollars. Below is each stock’s symbol, name, current yield, current price, price return year-to-date, current dividend, dividend growth year-to-date and current dividend growth streak. Companies on ‘The List’ are added or subtracted once a year, on January 1. After that, ‘The List’ is set for the next twelve months. Prices and dividends are updated weekly.

SYMBOL COMPANY YLD PRICE YTD % DIV YTD % STREAK
AQN-N Algonquin Power & Utilities 6.0% $8.41 25.0% $0.51 -29.0% 12
ATD-T Alimentation Couche-Tard Inc. 0.9% $64.73 7.6% $0.56 19.1% 13
BCE-T Bell Canada 6.3% $60.28 0.1% $3.82 5.0% 14
BIP-N Brookfield Infrastructure Partners 4.4% $35.41 5.2% $1.44 6.3% 15
CCL-B-T CCL Industries 1.7% $61.80 6.5% $1.06 10.4% 21
CNR-T Canadian National Railway 2.0% $156.99 -3.6% $3.16 7.8% 27
CTC-A-T Canadian Tire 4.0% $173.00 18.0% $6.90 17.9% 12
CU-T Canadian Utilities Limited 5.1% $35.02 -5.2% $1.79 1.0% 51
DOL-T Dollarama Inc. 0.3% $87.15 9.1% $0.27 23.8% 12
EMA-T Emera 5.1% $54.34 3.3% $2.76 3.0% 16
ENB-T Enbridge Inc. 7.2% $49.47 -7.2% $3.55 3.2% 27
ENGH-T Enghouse Systems Limited 2.6% $32.50 -9.0% $0.85 18.2% 16
FNV-N Franco Nevada 0.9% $145.74 5.5% $1.36 6.3% 15
FTS-T Fortis 4.0% $56.55 2.2% $2.26 4.1% 49
IFC-T Intact Financial 2.2% $198.54 1.4% $4.40 10.0% 18
L-T Loblaws 1.5% $115.22 -4.2% $1.74 10.3% 11
MGA-N Magna 3.2% $56.99 -0.9% $1.84 2.2% 13
MRU-T Metro 1.7% $71.14 -5.7% $1.21 10.0% 28
RY-T Royal Bank of Canada 4.2% $125.88 -1.7% $5.34 7.7% 12
SJ-T Stella-Jones Inc. 1.4% $64.54 30.2% $0.92 15.0% 18
STN-T Stantec Inc. 0.9% $84.21 28.9% $0.77 8.5% 11
TD-T TD Bank 4.8% $80.71 -7.9% $3.84 7.9% 12
TFII-N TFI International 1.3% $106.25 6.1% $1.40 29.6% 12
TIH-T Toromont Industries 1.6% $107.00 9.5% $1.68 10.5% 33
TRP-T TC Energy Corp. 6.9% $53.57 0.5% $3.69 3.4% 22
T-T Telus 5.6% $25.73 -2.2% $1.43 7.3% 19
WCN-N Waste Connections 0.7% $137.54 4.4% $1.02 7.4% 13
Averages 3.2% 4.3% 8.4% 19

Six Canadian stocks on ‘The List’ declare earnings and dividends in US dollars and are inter-listed on a US exchange in US dollars. The simplest way to display dividend and price metrics for these stocks is to show their US exchange symbols along with their US dividends and price. The stocks I am referring to have a -N at the end of their symbols. You can still buy their Canadian counterparts (-T), but your dividends will be converted into CDN dollars and will fluctuate based on the exchange rate.

Note: When the dividend and share price currency match, the calculation is straightforward. But it’s not so simple when the dividend is declared in one currency, and the share price is quoted in another. Dividing the former by the latter would produce a meaningless result because it’s a case of apples and oranges. To calculate the yield properly, you must express the dividend and share price in the same currency.

Performance of ‘The List’

Feel free to click on this link, ‘The List’ for a sortable version from our website.

Last week, ‘The List’ was up slightly with a YTD price return of +4.3% (capital). Dividend growth remained the same and is now at +8.4% YTD, highlighting growth in income over the past year.

The best performers last week on ‘The List’ were Magna (MGA-N), up +7.04%; Dollarama Inc. (DOL-T), up +4.96%; and Stantec Inc. (STN-T), up +3.43%.

Enghouse Systems Limited (ENGH-T) was the worst performer last week, down -11.71%.


Dividend Increases

“The growth of dividend paying ability is of significance in the determination of a stock’s quality, or general safety…”

– Arnold Bernhard (the founder of Value Line)

“As a dividend increase is a positive sign of a company’s financial strength, the safest purchase, after research, is a stock with a recent dividend increase.”

– Tom Connolly (the founder of dividendgrowth.ca)

Last week, no dividend increases from companies on ‘The List’.


Earnings Releases

Benjamin Graham once remarked that earnings are the principal factor driving stock prices.

Each quarter we will provide readers with weekly earnings updates of stocks on ‘The List’ during the calendar earnings season. 

The updated earnings calendar can be found here.

Earnings growth and dividend growth tend to go hand in hand, so this information can tell us a lot about the future dividend growth of our quality companies. Monitoring our dividend growers periodically is part of the process, and reading the quarterly earnings releases is a good place to start.

No earnings reports from companies on ‘The List’ this week

Last week, one earnings report from companies on ‘The List’.

Enghouse Systems Limited (ENGH-T) released its second-quarter fiscal 2023 results on Monday, June 12, 2023, after markets closed.

“During the second quarter of 2023, we generated an increase in revenue, positive operating cash flows, operating income profits and completed two acquisitions. Consistent with our strategy, the increase in revenue is mainly a result of acquisitions that have expanded our recurring SaaS revenue base. We continue with our strategy of offering our customers choice around how they deploy our technology whether on-premise or in the cloud. Furthermore, our products are “cloud-vendor agnostic” offering options to our customers to use their preferred cloud providers. Offering choice has been an important factor in winning and retaining customers.”

– Stephen J. Sadler, President and Chief Executive Officer

Highlights:

  • Revenue achieved was $113.5 and $219.9 million, respectively, compared to revenue of $106.3 and $217.4 million;
  • Results from operating activities was $25.6 and $55.5 million, respectively, compared to $31.1 and $66.8 million;
  • Net income was $12.5 and $29.6 million, respectively, compared to $17.9 and $39.5 million;
  • Adjusted EBITDA was $30.2 and $62.5 million, respectively, compared to $33.8 and $72.3 million;
  • Cash flow from operating activities excluding changes in working capital was $28.9 and $61.5 million, respectively, compared to $34.5 and $73.3 million.

Outlook:

We continue to achieve our objective of profitable growth with results from operating activities of $25.6 million and cash flows from operating activities, excluding changes in working capital, of $28.9 million, which was accomplished in a quarter where we closed two acquisitions that required significant operational improvements.

On February 9, 2023, the Company acquired 100% of the issued and outstanding common shares of Mobi All Tecnologia S.A. (“Navita”). Headquartered in Sao Paulo, Brazil, Navita provides SaaS based Enterprise Mobility Management solutions in managing and controlling critical mobile assets as well as telecom and IT expense management.

On February 8, 2023, the Company completed its acquisition of Qumu Corporation (“Qumu”) (Nasdaq: QUMU), a global provider of cloud-based enterprise video technology. Under a December 19, 2022 agreement, a wholly owned subsidiary of the Company completed the tender offer for all the outstanding shares of Qumu for USD $0.90 per share in cash. The two acquisitions were completed for an aggregate cash purchase price of $30.1 million with $2.4 million remaining in holdback, subject to potential adjustment. Results for both acquisitions are included in IMG from their respective dates of acquisition.

Subsequent Event

On May 17, 2023, Enghouse entered into an asset purchase agreement with Lifesize Inc (“Lifesize”), a global provider of video conferencing and omnichannel contact center solutions, based in Texas. Under the agreement, Enghouse will acquire substantially all of Lifesize’s assets and brands, including Lifesize, Kaptivo, ProScheduler, Serenova and Telstrat. The purchase remains subject to court approval.

Source: (ENGH-T) Q2-2023 Earnings Release


We buy quality individual dividend growth stocks when they are sensibly priced and hold for the growing income.