MP Market Review – July 22, 2022
Last updated by BM on July 25, 2022
Summary
- This article is part of our weekly series (MP Market Review) highlighting the performance and activity from the previous week related to the financial markets and Canadian dividend growth companies we follow on ‘The List’.
- Last week, ‘The List’ was up a couple of percentage points with a minus -3.7% YTD price return (capital). Dividend growth of ‘The List’ remains at 10.2% YTD, demonstrating the rise in income over the last year.
- Last week, there were no dividend increases from companies on ‘The List’.
- Last week, there were no earnings reports from companies on ‘The List’.
- Eight companies on ‘The List’ are due to report earnings this week.
- Are you looking for a portfolio of ideas like these? Magic Pants DGI Premium Membership Subscribers get exclusive access to the MP Wealth-Builder Model Portfolio (CDN). Learn More
“Compare the compound annual growth rate (CAGR) of a firm’s dividend with its price after a few years. They should be similar: if not, do not buy, or if you own it, winnow it.”
– Tom Connolly
We quote Tom Connolly quite a bit in our blog. Connolly is not widely known to most investors, but he is one of the reasons we started looking into dividend growth investing years ago.
Our income from ‘The List’ continues to outpace inflation this year, with more increases expected in 2022. You can see from the summary above that our capital is holding up well compared to the overall market too. We like to see, at a minimum, both our portfolio income and capital double over the course of a decade. We use the Rule of 72 to estimate our timeline and ensure we are on track.
“The Rule of 72 is a mathematical principle that estimates the time it will take for an investment to double in value. Simply take the number 72 and divide it by the rate of return on your investments each year to get the number of years it will take for your investments to grow 100%.”
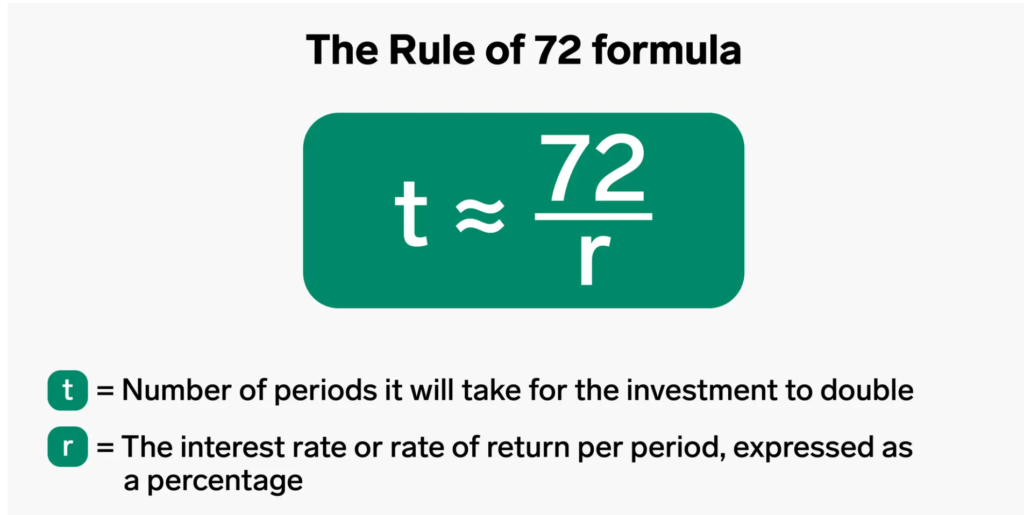
This formula only works with investments that compound. Average 7.2 % dividend growth (reinvested yearly) means it will take ten years to double your income. At 10.2% (this year’s dividend growth of ‘The List’), it will take ~ seven years to double.
Performance of ‘The List’
Last week, ‘The List’ was up a couple of percentage points with a minus -3.7% YTD price return (capital). Dividend growth of ‘The List’ remains at 10.2% YTD, demonstrating the rise in income over the last year.
The best performers last week on ‘The List’ were Stella-Jones Inc. (SJ-T), up 9.41%; Magna (MGA-N), up 9.17%; and Enghouse Systems Limited (ENGH-T), up 6.95%.
Intact Financial (IFC-T) was the worst performer last week, down -2.31%.
Recent News
Franco-Nevada Announces $352.5 Million Financing Package with G Mining Ventures on the Tocantinzinho Gold Project (Franco-Nevada website)
“We are delighted to support G Mining Ventures with this construction financing package,” said Paul Brink, President & CEO of Franco-Nevada. “Tocantinzinho is an attractive project in a prolific district and located in a good jurisdiction. The G Mining Ventures team has a track-record as one of the most capable mine building teams in the industry. As a stream financing partner we seek, through our financing and our involvement in projects, to help mine developers raise their full financial package on attractive terms. We are pleased to provide stream and debt financing to G Mining Ventures and along with two other strong strategic investors, La Mancha and Eldorado, to provide an equity component to fully finance the planned mine build.”
Highlights include:
Near-term gold contribution: Based on expected mine performance, full year contributions from the project are expected to average approximately 24,500 GEOs per year over the first 5 years of full production. That equates to over $42 million per year at today’s prices. Mine is expected to begin production in 2024.
Fully financed package: Franco-Nevada is providing $352.5 million of a total $481 million fully committed financing package. Putting its excess cash on hand to good use.
Exploration and expansion potential: The Stream is referenced to production from the entire Tocantinzinho land package currently covering approximately 996 km2. In addition to the planned project, the land position includes a number of regional targets and prospects.
Markets are falling, but my dividends keep going up (Globe & Mail)
“Some people celebrate Canada Day by wearing red and white or heading out to watch the fireworks. I like to express my patriotism by adding up all the dividend increases from the Canadian companies in my model Yield Hog Dividend Growth Portfolio.” John Heinzl
If you are looking for other examples of dividend growth investing (DGI) at work, you could follow John Heinzl and his ‘Yield Hog Dividend Growth Portfolio’ in the Globe & Mail.
John does a good job at explaining DGI concepts and benefits but strays a little from our concentrated, high-quality, and non-cyclical approach. John includes REITs and ETFs in his portfolio.
Eight companies on ‘The List’ are due to report earnings this week.
Canadian National Railway (CNR-T) will release its second-quarter 2022 results on Tuesday, July 26, 2022, after markets close.
Toromont Industries (TIH-T) will release its second-quarter 2022 results on Tuesday, July 26, 2022, after markets close.
Loblaws (L-T) will release its second-quarter 2022 results on Wednesday, July 27, 2022, before markets open.
Canadian Utilities Limited (CU-T) will release its second-quarter 2022 results on Thursday, July 28, 2022, before markets open.
TC Energy (TRP-T) will release its second-quarter 2022 results on Thursday, July 28, 2022, before markets open.
Fortis (FTS-T) will release its second-quarter 2022 results on Thursday, July 28, 2022, before markets open.
TFI International (TFII-N) will release its second-quarter 2022 results on Thursday, July 28, 2022, after markets close.
Enbridge (ENB-T) will release its second-quarter 2022 results on Friday, July 29, 2022, before markets open.
Dividend Increases
Last week, there were no dividend increases from companies on ‘The List’.
Earnings Releases
Last week, there were no earnings reports from companies on ‘The List’.
Below is a snapshot of ‘The List’ from last Friday’s close. For a sortable version of ‘The List’, please click on The List menu item.
‘The List’ is not meant to be a template for investors to copy exactly. Instead, its purpose is to provide investment ideas and a real-time illustration of dividend growth investing in action. It is not a ‘Buy List’ nor does it reflect the composition or returns of our Magic Pants Wealth-Builder (CDN) Portfolio. It is only a starting point for our analysis and discussion.
The List (2022)
Last updated by BM on July 22, 2022
*Note: The following graph is wide, you can scroll to the right on your device to see more of the data.
| SYMBOL | COMPANY | YLD | PRICE | YTD % | DIV | YTD % | STREAK |
|---|---|---|---|---|---|---|---|
| AQN-N | Algonquin Power & Utilities | 5.3% | $13.38 | -6.8% | $0.70 | 5.4% | 11 |
| ATD-T | Alimentation Couche-Tard Inc. | 0.8% | $53.71 | 3.1% | $0.44 | 18.1% | 12 |
| BCE-T | Bell Canada | 5.7% | $63.39 | -3.8% | $3.64 | 4.0% | 13 |
| BIP-N | Brookfield Infrastructure Partners | 3.7% | $38.94 | -4.4% | $1.44 | 5.9% | 14 |
| CCL-B-T | CCL Industries | 1.5% | $63.78 | -5.9% | $0.96 | 14.3% | 20 |
| CNR-T | Canadian National Railway | 2.0% | $149.27 | -3.6% | $2.93 | 19.1% | 26 |
| CTC-A-T | Canadian Tire | 3.4% | $170.83 | -6.7% | $5.85 | 24.5% | 11 |
| CU-T | Canadian Utilities Limited | 4.5% | $39.68 | 8.4% | $1.78 | 1.0% | 50 |
| DOL-T | Dollarama Inc. | 0.3% | $77.00 | 21.4% | $0.22 | 9.2% | 11 |
| EMA-T | Emera | 4.4% | $60.22 | -3.8% | $2.65 | 2.9% | 15 |
| ENB-T | Enbridge Inc. | 6.2% | $55.41 | 11.8% | $3.44 | 3.0% | 26 |
| ENGH-T | Enghouse Systems Limited | 2.3% | $31.41 | -31.5% | $0.72 | 16.3% | 15 |
| FNV-N | Franco Nevada | 1.0% | $124.71 | -8.4% | $1.28 | 10.3% | 14 |
| FTS-T | Fortis | 3.6% | $60.10 | -0.6% | $2.14 | 2.9% | 48 |
| IFC-T | Intact Financial | 2.2% | $178.30 | 8.9% | $4.00 | 17.6% | 17 |
| L-T | Loblaws | 1.3% | $119.38 | 16.2% | $1.54 | 12.4% | 10 |
| MGA-N | Magna | 2.9% | $61.05 | -25.2% | $1.80 | 4.7% | 12 |
| MRU-T | Metro | 1.6% | $69.65 | 3.9% | $1.10 | 12.2% | 27 |
| RY-T | Royal Bank of Canada | 4.0% | $123.62 | -9.7% | $4.96 | 14.8% | 11 |
| SJ-T | Stella-Jones Inc. | 2.2% | $35.91 | -11.7% | $0.80 | 11.1% | 17 |
| STN-T | Stantec Inc. | 1.2% | $60.42 | -13.9% | $0.71 | 6.8% | 10 |
| TD-T | TD Bank | 4.3% | $82.03 | -17.4% | $3.56 | 12.7% | 11 |
| TFII-N | TFI International | 1.2% | $90.24 | -18.5% | $1.08 | 12.5% | 11 |
| TIH-T | Toromont Industries | 1.4% | $106.28 | -6.5% | $1.52 | 15.2% | 32 |
| TRP-T | TC Energy Corp. | 5.2% | $68.63 | 14.9% | $3.57 | 4.4% | 21 |
| T-T | Telus | 4.6% | $28.90 | -2.9% | $1.33 | 6.2% | 18 |
| WCN-N | Waste Connections | 0.7% | $126.26 | -5.8% | $0.92 | 8.9% | 12 |
| Averages | 2.9% | -3.7% | 10.2% | 18 |
We Just Bought Toronto Dominion Bank (TD-T) and Royal Bank (RY-T) for our MP Wealth-Builder Model Portfolio (CDN)
MP Market Review – July 15, 2022
Last updated by BM on July 18, 2022
Summary:
- This article is part of our weekly series (MP Market Review) highlighting the performance and activity from the previous week related to the financial markets and Canadian dividend growth companies we follow on ‘The List.’
- ‘The List’ was down slightly last week with a minus -5.7% YTD price return (capital). Dividend growth of ‘The List’ remains at 10.2% YTD, demonstrating the rise in income over the last year.
- Last week, there were no dividend increases from companies on ‘The List.’
- Last week, there were no earnings reports from companies on ‘The List.’
- No companies on ‘The List’ are due to report earnings this week.
- Are you looking for a portfolio of ideas like these? Magic Pants DGI Premium Membership Subscribers get exclusive access to the MP Wealth-Builder Model Portfolio (CDN). Learn More
“The desirability of a business with extraordinary economic characteristics can be ruined by the price you pay for it.”
– Charlie Munger
This year, we have been very patient in adding to our MP Wealth-Builder Portfolio (CDN). Rising interest rates slow the economy down and adversely impact a company’s earnings. When we execute a position in one of our quality dividend growers, it is with the knowledge that we have entered the position at a sensible price according to historical fundamentals.
The market is reacting strongly to interest rate hikes and revised earnings forecasts. We will continue to view this behaviour as an opportunity to add to our positions. Q2 earnings results are just around the corner, and we will be ready! A long-term mindset protects us from the emotional grind of a volatile market.
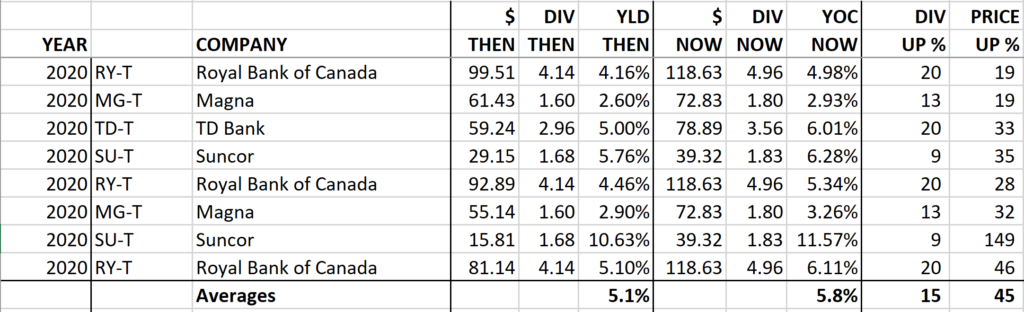
Here is a recent example from March 2020 (from our MP Wealth-Builder Portfolio (CDN)) of taking advantage of the market mispricing some of our quality dividend growers. The $ NOW column is pricing based on last Friday’s closing price.
An average 15% income growth and 45% capital return even after the market pullback of this year.
Performance of ‘The List’
Last week, ‘The List’ was down slightly with a minus -5.7% YTD price return (capital). Dividend growth of ‘The List’ remains at 10.2% YTD, demonstrating the rise in income over the last year.
The best performers last week on ‘The List’ were Canadian Utilities Limited (CU-T), up 4.62%; Fortis (FTS-T), up 2.66%; and Emera (EMA-T), up 1.35%.
Royal Bank of Canada (RY-T) was the worst performer last week, down -7.00%.
Recent News
More pain in store for Canadian consumers after central bank’s jumbo rate hike (Globe & Mail)
“The central bank raised its policy rate by 100 basis points to 2.5 per cent on Wednesday, its largest increase in nearly 24 years. Its aim is to crush hot inflation, which hit a four-decade high of 7.7 per cent in May, with the bank promising more hikes to come.”
“There’s going to be a lot of pain out there. And I think the bank is underestimating the risks to both housing and consumption,” said Stephen Brown, senior Canada economist at Capital Economics.
As expected, another down week for Canadian stocks immediately following another rate hike. The bet is that there will be three more rate hikes in 2022.
Why bear markets are gifts for smart investors (Globe & Mail)
“Every correction, crash and bear market in stocks is a gift in disguise.”
“Generally speaking, these are the kinds of moments that shape one’s performance over a lifetime of investing in the stock market.”
The article does caution the investor, though. As we mentioned in earlier articles, we have yet to see the impact of Q2 and Q3 earnings results on this market. Any revisions downwards will more than likely bring the market into bear market territory (down 20% from recent highs).
“At this point, it makes more sense for investors to pick away at positions in companies with decent earnings power in a recession, which is looking increasingly certain.”
No companies on ‘The List’ are due to report earnings this week.
Dividend Increases
Last week, there were no dividend increases from companies on ‘The List’.
Earnings Releases
Last week, there were no earnings reports from companies on ‘The List’.
Below is a snapshot of ‘The List’ from last Friday’s close. For a sortable version of ‘The List’, please click on The List menu item.
‘The List’ is not meant to be a template for investors to copy exactly. Instead, its purpose is to provide investment ideas and a real-time illustration of dividend growth investing in action. It is not a ‘Buy List’ nor does it reflect the composition or returns of our Magic Pants Wealth-Builder (CDN) Portfolio. It is only a starting point for our analysis and discussion.
The List (2022)
Last updated by BM on July 15, 2022
*Note: The following graph is wide, you can scroll to the right on your device to see more of the data.
| SYMBOL | COMPANY | YLD | PRICE | YTD % | DIV | YTD % | STREAK |
|---|---|---|---|---|---|---|---|
| AQN-N | Algonquin Power & Utilities | 5.3% | $13.30 | -7.3% | $0.70 | 5.4% | 11 |
| ATD-T | Alimentation Couche-Tard Inc. | 0.8% | $52.43 | 0.6% | $0.44 | 18.1% | 12 |
| BCE-T | Bell Canada | 5.7% | $63.50 | -3.7% | $3.64 | 4.0% | 13 |
| BIP-N | Brookfield Infrastructure Partners | 3.8% | $37.74 | -7.3% | $1.44 | 5.9% | 14 |
| CCL-B-T | CCL Industries | 1.6% | $60.55 | -10.7% | $0.96 | 14.3% | 20 |
| CNR-T | Canadian National Railway | 2.0% | $145.38 | -6.1% | $2.93 | 19.1% | 26 |
| CTC-A-T | Canadian Tire | 3.5% | $164.86 | -10.0% | $5.85 | 24.5% | 11 |
| CU-T | Canadian Utilities Limited | 4.4% | $40.32 | 10.1% | $1.78 | 1.0% | 50 |
| DOL-T | Dollarama Inc. | 0.3% | $76.20 | 20.2% | $0.22 | 9.2% | 11 |
| EMA-T | Emera | 4.3% | $60.97 | -2.6% | $2.65 | 2.9% | 15 |
| ENB-T | Enbridge Inc. | 6.4% | $54.13 | 9.3% | $3.44 | 3.0% | 26 |
| ENGH-T | Enghouse Systems Limited | 2.4% | $29.37 | -36.0% | $0.72 | 16.3% | 15 |
| FNV-N | Franco Nevada | 1.0% | $127.28 | -6.5% | $1.28 | 10.3% | 14 |
| FTS-T | Fortis | 3.5% | $61.28 | 1.3% | $2.14 | 2.9% | 48 |
| IFC-T | Intact Financial | 2.2% | $182.51 | 11.5% | $4.00 | 17.6% | 17 |
| L-T | Loblaws | 1.3% | $119.40 | 16.2% | $1.54 | 12.4% | 10 |
| MGA-N | Magna | 3.2% | $55.92 | -31.5% | $1.80 | 4.7% | 12 |
| MRU-T | Metro | 1.6% | $70.18 | 4.7% | $1.10 | 12.2% | 27 |
| RY-T | Royal Bank of Canada | 4.2% | $118.63 | -13.3% | $4.96 | 14.8% | 11 |
| SJ-T | Stella-Jones Inc. | 2.4% | $32.82 | -19.3% | $0.80 | 11.1% | 17 |
| STN-T | Stantec Inc. | 1.2% | $56.87 | -19.0% | $0.71 | 6.8% | 10 |
| TD-T | TD Bank | 4.5% | $78.89 | -20.6% | $3.56 | 12.7% | 11 |
| TFII-N | TFI International | 1.3% | $85.67 | -22.6% | $1.08 | 12.5% | 11 |
| TIH-T | Toromont Industries | 1.5% | $99.44 | -12.5% | $1.52 | 15.2% | 32 |
| TRP-T | TC Energy Corp. | 5.4% | $66.37 | 11.1% | $3.57 | 4.4% | 21 |
| T-T | Telus | 4.7% | $28.61 | -3.9% | $1.33 | 6.2% | 18 |
| WCN-N | Waste Connections | 0.7% | $124.44 | -7.2% | $0.92 | 8.9% | 12 |
| Averages | 2.9% | -5.7% | 10.2% | 18 |
MP Market Review – July 8, 2022
Last updated by BM on July 11, 2022
Summary:
- This article is part of our weekly series (MP Market Review) highlighting the performance and activity from the previous week related to the financial markets and Canadian dividend growth companies we follow on ‘The List.’
- ‘The List’ was up slightly last week with a minus -4.3% YTD price return (capital). Dividend growth of ‘The List’ remains at 10.2% YTD, demonstrating the rise in income over the last year.
- Last week, there were no dividend increases from companies on ‘The List.’
- Last week, there were no earnings reports from companies on ‘The List.’
- No companies on ‘The List’ are due to report earnings this week.
- Are you looking for a portfolio of ideas like these? Magic Pants DGI Premium Membership Subscribers get exclusive access to the MP Wealth-Builder Model Portfolio (CDN). Learn More
“One of the most persuasive tests of high-quality is an uninterrupted record of dividend payments going back over many years.”
– Ben Graham, The Intelligent Investor
Most of the investing community now recommends quantity over quality. Buy a few hundred stocks in an index fund (ETF) and you will do fine is their message. Ask yourself how an S&P 500 index fund or god forbid a technology ETF is doing this year? Are you able to ride that type of emotional rollercoaster, especially in your retirement? Luckily we think differently. Owning only a few quality individual dividend growth companies has fared much better than index investing over the longer term.
For now, we wait patiently for an opportunity to invest safely in our quality dividend growth stocks.
Performance of ‘The List’
Last week, ‘The List’ was up slightly with a minus -4.3% YTD price return (capital). Dividend growth of ‘The List’ remains at 10.2% YTD, demonstrating the rise in income over the last year.
The best performers last week on ‘The List’ were Enghouse Systems Limited (ENGH-T), up 7.88%; Dollarama Inc. (DOL-T), up 5.63%; and Alimentation Couche-Tard Inc. (ATD-T), up 5.26%.
Algonquin Power & Utilities (AQN-N) was the worst performer last week, down -2.18%.
Recent News
Enghouse AG Acquires NTW Software
“NTW’s team and products expand our existing console and contact center business in Central Europe, adding Unified Communication products to Enghouse’s channel product portfolio,” said Steve Sadler, Chairman & CEO of Enghouse. “We are very pleased to welcome NTW’s customers, partners and employees to Enghouse.”
(ENGH-T) has been on the lookout for acquisitions since tech valuations came under pressure recently. This is the second acquisition in the last month for Enghouse Systems.
Stantec Says Selected as Program Management Consultant for Metro Vancouver’s Iona Island Wastewater Treatment Projects
“Stantec said the projects are the largest capital program ever undertaken by Metro Vancouver. As the consultant, Stantec will provide a multi-disciplinary team of resources to deliver a broad range of program management and technical support services.”
(STN-T) has been in the news a lot recently as well. The company continues to book new business and dig into its massive project backlog.
No companies on ‘The List’ are due to report earnings this week.
Dividend Increases
Last week, there were no dividend increases from companies on ‘The List.’
Earnings Releases
Last week, there were no earnings reports from companies on ‘The List.’
Below is a snapshot of ‘The List’ from last Friday’s close. For a sortable version of ‘The List’, please click on The List menu item.
‘The List’ is not meant to be a template for investors to copy exactly. Instead, its purpose is to provide investment ideas and a real-time illustration of dividend growth investing in action. It is not a ‘Buy List’ nor does it reflect the composition or returns of our Magic Pants Wealth-Builder (CDN) Portfolio. It is only a starting point for our analysis and discussion.
The List (2022)
Last updated by BM on July 8, 2022
*Note: The following graph is wide, you can scroll to the right on your device to see more of the data.
| SYMBOL | COMPANY | YLD | PRICE | YTD % | DIV | YTD % | STREAK |
|---|---|---|---|---|---|---|---|
| AQN-N | Algonquin Power & Utilities | 5.2% | $13.48 | -6.1% | $0.70 | 5.4% | 11 |
| ATD-T | Alimentation Couche-Tard Inc. | 0.8% | $52.85 | 1.4% | $0.44 | 18.1% | 12 |
| BCE-T | Bell Canada | 5.7% | $63.53 | -3.6% | $3.64 | 4.0% | 13 |
| BIP-N | Brookfield Infrastructure Partners | 3.8% | $38.22 | -6.2% | $1.44 | 5.9% | 14 |
| CCL-B-T | CCL Industries | 1.5% | $63.19 | -6.8% | $0.96 | 14.3% | 20 |
| CNR-T | Canadian National Railway | 2.0% | $146.06 | -5.7% | $2.93 | 19.1% | 26 |
| CTC-A-T | Canadian Tire | 3.4% | $170.13 | -7.1% | $5.85 | 24.5% | 11 |
| CU-T | Canadian Utilities Limited | 4.6% | $38.54 | 5.3% | $1.78 | 1.0% | 50 |
| DOL-T | Dollarama Inc. | 0.3% | $78.29 | 23.5% | $0.22 | 9.2% | 11 |
| EMA-T | Emera | 4.4% | $60.16 | -3.9% | $2.65 | 2.9% | 15 |
| ENB-T | Enbridge Inc. | 6.3% | $54.67 | 10.4% | $3.44 | 3.0% | 26 |
| ENGH-T | Enghouse Systems Limited | 2.3% | $30.67 | -33.1% | $0.72 | 16.3% | 15 |
| FNV-N | Franco Nevada | 1.0% | $132.84 | -2.4% | $1.28 | 10.3% | 14 |
| FTS-T | Fortis | 3.6% | $59.69 | -1.3% | $2.14 | 2.9% | 48 |
| IFC-T | Intact Financial | 2.1% | $188.23 | 15.0% | $4.00 | 17.6% | 17 |
| L-T | Loblaws | 1.3% | $119.11 | 15.9% | $1.54 | 12.4% | 10 |
| MGA-N | Magna | 3.2% | $56.26 | -31.0% | $1.80 | 4.7% | 12 |
| MRU-T | Metro | 1.5% | $71.16 | 6.1% | $1.10 | 12.2% | 27 |
| RY-T | Royal Bank of Canada | 3.9% | $127.56 | -6.8% | $4.96 | 14.8% | 11 |
| SJ-T | Stella-Jones Inc. | 2.4% | $33.05 | -18.8% | $0.80 | 11.1% | 17 |
| STN-T | Stantec Inc. | 1.2% | $58.46 | -16.7% | $0.71 | 6.8% | 10 |
| TD-T | TD Bank | 4.3% | $83.22 | -16.2% | $3.56 | 12.7% | 11 |
| TFII-N | TFI International | 1.3% | $85.17 | -23.1% | $1.08 | 12.5% | 11 |
| TIH-T | Toromont Industries | 1.5% | $104.30 | -8.3% | $1.52 | 15.2% | 32 |
| TRP-T | TC Energy Corp. | 5.3% | $67.04 | 12.2% | $3.57 | 4.4% | 21 |
| T-T | Telus | 4.6% | $28.79 | -3.3% | $1.33 | 6.2% | 18 |
| WCN-N | Waste Connections | 0.7% | $125.51 | -6.4% | $0.92 | 8.9% | 12 |
| Averages | 2.9% | -4.3% | 10.2% | 18 |
MP Market Review – June 30, 2022
Last updated by BM on July 4, 2022
Summary:
- This article is part of our weekly series (MP Market Review) highlighting the performance and activity from the previous week related to the financial markets and Canadian dividend growth companies we follow on ‘The List.’
- ‘The List’ was up slightly last week with a minus -5.8% YTD price return (capital). Dividend growth of ‘The List’ remains at 10.2% YTD, demonstrating the rise in income over the last year.
- Last week, there were no dividend increases from companies on ‘The List.’
- One company on ‘The List,’ Alimentation Couche-Tard Inc. (ATD-T), reported their Q4 Fiscal 2022 earnings.
- No companies on ‘The List’ are due to report earnings this week.
- Are you looking for a portfolio of ideas like these? Magic Pants DGI Premium Membership Subscribers get exclusive access to the MP Wealth-Builder Model Portfolio (CDN). Learn More
“The intelligent investor is a realist who buys from pessimists and sells to optimists.”
– Ben Graham, The Intelligent Investor
We read many financial articles over the long weekend, none predicting a fast turnaround in the fortunes of the stock markets. Many economists are now saying that a recession is most likely. Being a ‘realist’, we know that markets do not only go in one direction, so we are okay waiting for sensible prices on our excellent dividend growers.
The hardest part in markets like today is resisting the urge to buy too soon when a stock you have been following goes down in price. When we look at all the stocks on ‘The List’ since May 1 of this year, only three have positive returns. That’s twenty-four of our twenty-seven quality dividend growers, in the red, in the last two months. The only saving grace is that our loss is only half of what the overall market is experiencing. Having a process protects our capital.
Earnings season has begun, so we will soon get a clearer picture of how companies feel about their businesses and the economy for the rest of the year.
Performance of ‘The List’
Last week, ‘The List’ was up slightly with a minus -5.8% YTD price return (capital). Dividend growth of ‘The List’ remains at 10.2% YTD, demonstrating the rise in income over the last year.
The best performers last week on ‘The List’ were Brookfield Infrastructure Partners (BIP-N), up 4.73%; TFI International (TFII-N), up 4.03%; and Stella-Jones Inc. (SJ-T), up 3.75%.
Alimentation Couche-Tard Inc. (ATD-T) was the worst performer last week, down -9.88%.
Recent News
TC Energy to build $5-billion gas pipeline in Mexico, official says
“Canada’s TC Energy (TRP-T) has agreed with Mexico to build a $5-billion gas pipeline in the Mexican Gulf Coast state of Veracruz, senior foreign ministry official Roberto Velasco said on Friday.”
Boston Water and Sewer Commission selects Stantec (STN-T) for next phase of US$150 Million East Boston Sewer Separation project
“Water infrastructure plays a crucial role in a city like Boston, where factors such as climate change, population growth, and new development only further stress existing resources,” said Mike Carroll, Stantec Project Manager. “We’re proud to continue a decades-long relationship with the BWSC to improve the historic and essential waterways while helping modernize this infrastructure across several neighbourhoods to support residents and businesses into the future.”
No companies on ‘The List’ are due to report earnings this week.
Dividend Increases
Last week, there were no dividend increases from companies on ‘The List.’
Earnings Releases
Last week, one company on ‘The List’, Alimentation Couche-Tard Inc. (ATD-T), reported their Q4 Fiscal 2022 earnings.
Alimentation Couche-Tard Inc. (ATD-T)
“We are proud to report a remarkable year despite the continued pressures caused by the pandemic, global inflation, and staffing challenges. With our operational and financial resilience, we had record-breaking results across key metrics and remained focused on our strategic goals. During the quarter, we made notable progress accelerating organic growth both inside the store and on our forecourts, as well as innovating for the future, including beginning our e-mobility journey in North America and rolling out smart checkout frictionless technology in targeted geographies. We also started the work with select partners to get a better understanding of our consumers’ interests in rapid delivery. I want to thank all our team members, customers, and shareholders for their continued commitment to the business as we prepare for an even stronger year ahead,” said Brian Hannasch, President and Chief Executive Officer of Alimentation Couche-Tard.
Highlights:
- Net earnings per diluted share of $2.52 compared with $2.44 for fiscal 2021, an increase of 3.3%, while adjusted diluted net earnings per share were $2.60 compared with $2.45 for fiscal 2021, an increase of 6.1%.
- Fulfillment of the Corporation’s share repurchase program, totaling $1.9 billion, including $834.7 million during the fourth quarter of fiscal 2022. Subsequent to the end of fiscal 2022, the Corporation renewed its share repurchase program which allows it to repurchase up to 10.0% of the public float. Under the renewed program, shares for a net amount of $429.2 million were repurchased.
- Increase in the annual dividend declared for fiscal 2022 of 25.6%, from CA 33.25¢ to CA 41.75¢.
- Return on capital employed remained strong at 15.4%, a slight decrease from 15.9%, driven by impairment costs incurred during the year which had a negative impact of approximately 0.3%.
- Leverage ratio at 1.39 : 1, a slight increase from 1.32 : 1, driven primarily by the use of cash for share repurchases.
- Despite its annual growth rate of expenses of 14.3%, the Corporation has deployed strategic efforts to mitigate costs increases and inflationary pressures, which is demonstrated by a compound annual growth rate of 3.4% of normalized growth of expenses compared to 2020, including employee-related costs, remaining below inflation.
Outlook:
“As we look ahead to fiscal 2023, our healthy financial position and strong capital structure, including our newly implemented US Commercial Paper Program, position us well to continue delivering strong results and return further value to our shareholders as we remain focused on our ambitious double-again strategy.”
Below is a snapshot of ‘The List’ from last Friday’s close. For a sortable version of ‘The List’, please click on The List menu item.
‘The List’ is not meant to be a template for investors to copy exactly. Instead, its purpose is to provide investment ideas and a real-time illustration of dividend growth investing in action. It is not a ‘Buy List’ nor does it reflect the composition or returns of our Magic Pants Wealth-Builder (CDN) Portfolio. It is only a starting point for our analysis and discussion.
The List (2022)
Last updated by BM on June 30, 2022
*Note: The following graph is wide, you can scroll to the right on your device to see more of the data.
| SYMBOL | COMPANY | YLD | PRICE | YTD % | DIV | YTD % | STREAK |
|---|---|---|---|---|---|---|---|
| AQN-N | Algonquin Power & Utilities | 5.1% | $13.78 | -4.0% | $0.70 | 5.4% | 11 |
| ATD-T | Alimentation Couche-Tard Inc. | 0.9% | $50.21 | -3.6% | $0.44 | 18.1% | 12 |
| BCE-T | Bell Canada | 5.8% | $63.27 | -4.0% | $3.64 | 4.0% | 13 |
| BIP-N | Brookfield Infrastructure Partners | 3.7% | $38.93 | -4.4% | $1.44 | 5.9% | 14 |
| CCL-B-T | CCL Industries | 1.6% | $60.84 | -10.3% | $0.96 | 14.3% | 20 |
| CNR-T | Canadian National Railway | 2.0% | $144.79 | -6.5% | $2.93 | 19.1% | 26 |
| CTC-A-T | Canadian Tire | 3.6% | $162.40 | -11.3% | $5.85 | 24.5% | 11 |
| CU-T | Canadian Utilities Limited | 4.6% | $38.39 | 4.9% | $1.78 | 1.0% | 50 |
| DOL-T | Dollarama Inc. | 0.3% | $74.12 | 16.9% | $0.22 | 9.2% | 11 |
| EMA-T | Emera | 4.4% | $60.30 | -3.7% | $2.65 | 2.9% | 15 |
| ENB-T | Enbridge Inc. | 6.3% | $54.36 | 9.7% | $3.44 | 3.0% | 26 |
| ENGH-T | Enghouse Systems Limited | 2.5% | $28.43 | -38.0% | $0.72 | 16.3% | 15 |
| FNV-N | Franco Nevada | 1.0% | $134.59 | -1.1% | $1.28 | 10.3% | 14 |
| FTS-T | Fortis | 3.5% | $60.85 | 0.6% | $2.14 | 2.9% | 48 |
| IFC-T | Intact Financial | 2.2% | $181.56 | 10.9% | $4.00 | 17.6% | 17 |
| L-T | Loblaws | 1.3% | $116.09 | 13.0% | $1.54 | 12.4% | 10 |
| MGA-N | Magna | 3.2% | $55.79 | -31.6% | $1.80 | 4.7% | 12 |
| MRU-T | Metro | 1.6% | $69.09 | 3.1% | $1.10 | 12.2% | 27 |
| RY-T | Royal Bank of Canada | 4.0% | $124.64 | -8.9% | $4.96 | 14.8% | 11 |
| SJ-T | Stella-Jones Inc. | 2.5% | $32.50 | -20.1% | $0.80 | 11.1% | 17 |
| STN-T | Stantec Inc. | 1.3% | $56.39 | -19.7% | $0.71 | 6.8% | 10 |
| TD-T | TD Bank | 4.2% | $84.41 | -15.0% | $3.56 | 12.7% | 11 |
| TFII-N | TFI International | 1.3% | $81.89 | -26.1% | $1.08 | 12.5% | 11 |
| TIH-T | Toromont Industries | 1.5% | $104.08 | -8.5% | $1.52 | 15.2% | 32 |
| TRP-T | TC Energy Corp. | 5.4% | $66.68 | 11.6% | $3.57 | 4.4% | 21 |
| T-T | Telus | 4.6% | $28.67 | -3.7% | $1.33 | 6.2% | 18 |
| WCN-N | Waste Connections | 0.7% | $125.32 | -6.5% | $0.92 | 8.9% | 12 |
| Averages | 2.9% | -5.8% | 10.2% | 18 |

I’ll coach you on how to identify high-quality individual dividend growth stocks when they are sensibly priced, and hold them for the growing income.