MP Market Review – April 26, 2024
Last updated by BM on April 29, 2024
Summary
This is a weekly installment of our MP Market Review series, which provides updates on the financial markets and Canadian dividend growth companies we monitor on ‘The List’.
- Learn how cash flow metrics power dividend growth in this week’s newsletter.
- Last week, dividend growth of ‘The List’ remained the same and has increased by +8.3% YTD (income).
- Last week, price return of ‘The List’ was up with a return of +2.5% YTD (capital).
- Last week, there were no dividend announcements from companies on ‘The List’.
- Last week, there were four earnings reports from companies on ‘The List’.
- This week, eleven companies on ‘The List’ are due to report earnings.
DGI Clipboard
“The difference between what we do and what ‘the others’ do is quite simple. It has profound implications, though. It’s all in the cash flow and the patience needed to wait for it.”
– Tom Connolly
Beyond Earnings: How Cash Flow Metrics Power Dividend Growth!

As the Q1 2024 earnings season heats up this week, our focus sharpens on specific indicators that matter most for dividend growth investing. Central to our analysis are cash flow metrics—both free cash flow (FCF) and operating cash flow (OCF)—which can provide a more comprehensive assessment of a company’s financial health and dividend sustainability than earnings per share (EPS).
Understanding Operating Cash Flow (OCF)
Operating cash flow is the lifeblood of a company’s daily operations, reflecting cash generated solely from its business activities. This metric excludes the effects of financing and investing actions, offering a purer gauge of operational efficiency. OCF is calculated by adjusting net income for non-cash items such as depreciation, amortization, and changes in working capital. This focus helps us understand the cash available from the company’s core operations without the distortion of its capital expenditures or financing strategies.
The Role of Free Cash Flow (FCF)
Free cash flow extends our analysis further, showing what remains after accounting for capital expenditures necessary to maintain or grow the business, like investments in property, plant, and equipment. FCF is a critical measure for us as it indicates how much cash a company can freely use to enhance shareholder value through dividends, share buybacks, or debt reduction.
The Shortcomings of Earnings Per Share (EPS)
While EPS is widely used to evaluate profitability, it often doesn’t tell the full story of a company’s cash-generating capabilities. Influenced heavily by accounting practices, EPS can be skewed by non-cash adjustments, providing a potentially misleading picture of financial health. This is especially true in industries where depreciation and amortization are significant factors or where companies incur substantial non-cash charges.
Conclusion: The Superiority of Cash Flow Metrics
For dividend growth investors, understanding and analyzing cash flow metrics is essential. They not only reveal a company’s real cash-generating ability but also indicate its capacity to sustain and increase dividends over time. As we prioritize long-term income generation and capital growth, cash flow remains a cornerstone metric in our investment evaluation process.
By focusing on these comprehensive financial indicators, we position ourselves to identify the most promising opportunities for sustainable dividend growth, staying true to our commitment to patient, long-term investing.
DGI Scorecard
The List (2024)
The Magic Pants 2024 list includes 28 Canadian dividend growth stocks. Here are the criteria to be considered a candidate on ‘The List’:
- Dividend growth streak: 10 years or more.
- Market cap: Minimum one billion dollars.
- Diversification: Limit of five companies per sector, preferably two per industry.
- Cyclicality: Exclude REITs and pure-play energy companies due to high cyclicality.
Based on these criteria, companies are added or removed from ‘The List’ annually on January 1. Prices and dividends are updated weekly.
While ‘The List’ is not a standalone portfolio, it functions admirably as an initial guide for those seeking to broaden their investment portfolio and attain superior returns in the Canadian stock market. Our newsletter provides readers with a comprehensive insight into the implementation and advantages of our Canadian dividend growth investing strategy. This evidence-based, unbiased approach empowers DIY investors to outperform both actively managed dividend funds and passively managed indexes and dividend ETFs over longer-term horizons.
For those interested in something more, please upgrade to a paid subscriber; you get the enhanced weekly newsletter, access to premium content, full privileges on the new Substack website magicpants.substack.com and DGI alerts whenever we make stock transactions in our model portfolio.
Performance of ‘The List’
Last week, dividend growth of ‘The List’ remained the same and has increased by +8.3% YTD (income).
Last week, ‘The List’ ‘s price return was up, with a +2.5% YTD (capital).
Even though prices may fluctuate, the dependable growth in our income does not. Stay the course. You will be happy you did.
Last week’s best performers on ‘The List’ were Canadian Tire (CTC-A-T), up +3.24%; Stantec Inc. (STN-T), up +3.04%; and Thomson Reuters (TRI-N), up +2.78%.
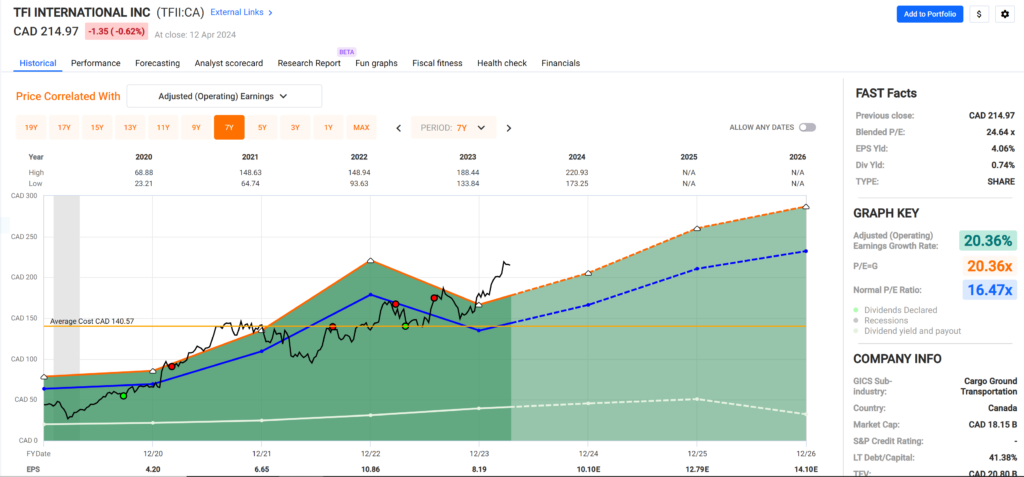
TFI International (TFII-N) was the worst performer last week, down -3.58%.
| SYMBOL | COMPANY | YLD | PRICE | YTD % | DIV | YTD % | STREAK |
|---|---|---|---|---|---|---|---|
| ATD-T | Alimentation Couche-Tard Inc. | 0.9% | $77.75 | 1.3% | $0.70 | 17.4% | 14 |
| BCE-T | Bell Canada | 8.9% | $44.59 | -17.7% | $3.99 | 3.1% | 15 |
| BIP-N | Brookfield Infrastructure Partners | 6.0% | $27.14 | -11.6% | $1.62 | 5.9% | 16 |
| CCL-B-T | CCL Industries Inc. | 1.6% | $71.00 | 22.8% | $1.16 | 9.4% | 22 |
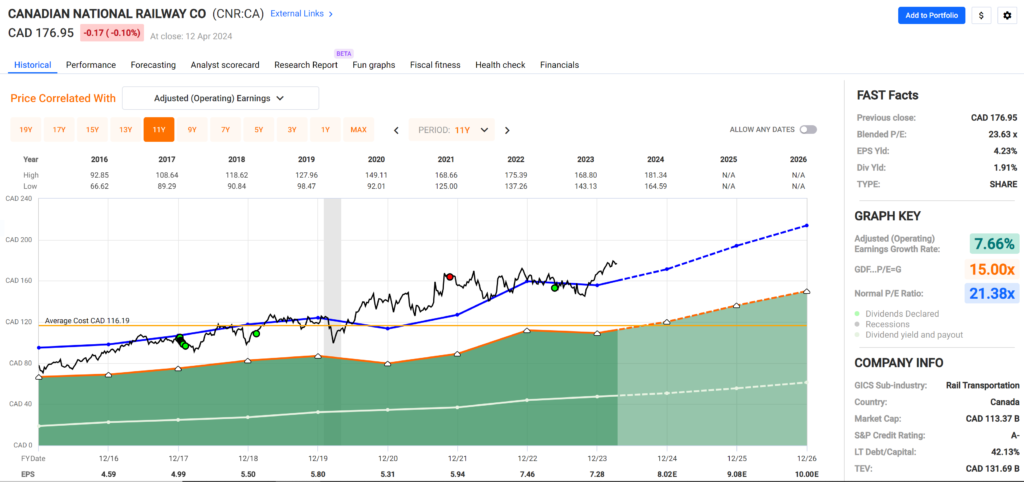
| CNR-T | Canadian National Railway | 2.0% | $171.25 | 2.6% | $3.38 | 7.0% | 28 |
| CTC-A-T | Canadian Tire | 5.1% | $136.55 | -1.5% | $7.00 | 1.4% | 13 |
| CU-T | Canadian Utilities Limited | 5.8% | $30.69 | -4.5% | $1.81 | 0.9% | 52 |
| DOL-T | Dollarama Inc. | 0.3% | $115.62 | 21.7% | $0.35 | 29.5% | 13 |
| EMA-T | Emera | 6.2% | $46.43 | -8.6% | $2.87 | 3.0% | 17 |
| ENB-T | Enbridge Inc. | 7.5% | $48.96 | 1.2% | $3.66 | 3.1% | 28 |
| ENGH-T | Enghouse Systems Limited | 3.3% | $29.93 | -11.9% | $1.00 | 18.3% | 17 |
| FNV-N | Franco Nevada | 1.2% | $122.93 | 11.6% | $1.44 | 5.9% | 16 |
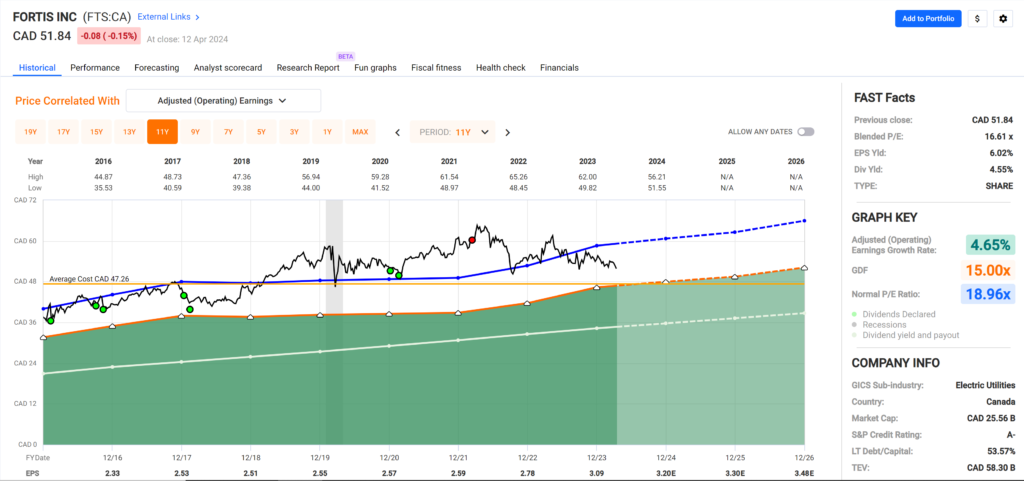
| FTS-T | Fortis Inc. | 4.4% | $53.38 | -2.7% | $2.36 | 3.3% | 50 |
| IFC-T | Intact Financial | 2.2% | $224.31 | 10.3% | $4.84 | 10.0% | 19 |
| L-T | Loblaw Companies Limited | 1.2% | $152.37 | 18.5% | $1.78 | 2.4% | 12 |
| MFC-T | Manulife Financial | 5.0% | $32.07 | 11.0% | $1.60 | 9.6% | 10 |
| MGA-N | Magna | 3.9% | $49.12 | -11.5% | $1.90 | 3.3% | 14 |
| MRU-T | Metro Inc. | 1.9% | $70.92 | 3.5% | $1.34 | 10.7% | 29 |
| RY-T | Royal Bank of Canada | 4.1% | $134.14 | 0.8% | $5.52 | 3.4% | 13 |
| SJ-T | Stella-Jones Inc. | 1.4% | $81.78 | 6.8% | $1.12 | 21.7% | 19 |
| STN-T | Stantec Inc. | 0.7% | $111.80 | 6.8% | $0.83 | 7.8% | 12 |
| T-T | Telus | 6.9% | $21.95 | -7.5% | $1.50 | 5.2% | 20 |
| TD-T | TD Bank | 5.0% | $81.20 | -4.1% | $4.08 | 6.3% | 13 |
| TFII-N | TFI International | 1.2% | $137.84 | 5.1% | $1.60 | 10.3% | 13 |
| TIH-T | Toromont Industries | 1.5% | $129.50 | 14.8% | $1.92 | 11.6% | 34 |
| TRI-N | Thomson Reuters | 1.4% | $154.40 | 7.7% | $2.16 | 10.2% | 30 |
| TRP-T | TC Energy Corp. | 7.8% | $49.30 | -5.8% | $3.84 | 3.2% | 23 |
| WCN-N | Waste Connections | 0.7% | $163.48 | 10.3% | $1.14 | 8.6% | 14 |
| Averages | 3.5% | 2.5% | 8.3% | 21 |
Note: Stocks ending in “-N” declare earnings and dividends in US dollars. To achieve currency consistency between dividends and share price for these stocks, we have shown dividends in US dollars and share price in US dollars (these stocks are listed on a US exchange). The dividends for their Canadian counterparts (-T) would be converted into CDN dollars and would fluctuate with the exchange rate.
Check us out on magicpants.substack.com for more info in this week’s issue….