“You have a pair of pants. In the left pocket, you have $100. You take $1 out of the left pocket and put in the right pocket. You now have $101. There is no diminution of dollars in your left pocket. That is one magic pair of pants.”

MP Market Review – February 24, 2023

Last updated by BM on February 27, 2023

Summary

  • This is a weekly installment of our MP Market Review series, which provides updates on the financial markets and Canadian dividend growth companies we monitor on ‘The List’.
  • Last week, ‘The List’ exhibited a YTD price return of +4.6% (capital), while its dividend growth increased to +6.2% YTD, highlighting growth in income over the past year.
  • Last week, there were two dividend increases from companies on ‘The List’.
  • Last week, there were four earnings reports from companies on ‘The List’.
  • Three companies on ‘The List’ are due to report earnings this week.
  • If you’re interested in creating your own income portfolio, consider subscribing to our premium service, which grants you access to the MP Wealth-Builder Model Portfolio (CDN) and exclusive subscriber-only content.  Learn More                              

Introduction

“You have a pair of pants. In the left pocket, you have a $100. You take $1 out of the left pocket and put in the right pocket. You now have a $101. There is no diminution of dollars in your left pocket. That is one magic pair of pants.”

This ‘magic pants’ analogy was from a Seeking Alpha article on dividend investing I read about a decade ago and was one of the catalysts for me to take a closer look at this type of investing and see if it truly was magical. 

After conducting additional research, I have shifted towards utilizing a dividend growth investing (DGI) strategy as my primary investment approach. While I maintain portfolios consisting of high-quality dividend growers from both the United States and Canada, I have opted to concentrate on Canadian (CDN) dividend growth companies in this blog. This is due to several reasons, including a smaller pool of DGI companies to track, a lack of coverage for the DGI strategy by Canadian investment media, and a tendency for those who do cover DGI to narrowly focus on only a handful of sectors (Energy and Financials).

While ‘The List’ is not a portfolio in itself, it serves as an excellent initial reference for individuals seeking to diversify their investments and attain higher returns in the Canadian stock market. Through our blog, we provide weekly updates on ‘The List’ and offer valuable perspectives and real-life examples of the dividend growth investing strategy in practice. This helps readers gain a deeper understanding of how to implement and benefit from this investment approach.

DGI Thoughts

Plenty of predictions in the financial media on the probability of the markets going up, down or sideways last week. Did you know that as dividend growth investors we still get paid regardless of the outcome?

“Persistent high inflation rates will change everything. Dividend growth stocks are the best inflation hedge I know of.”

 – Financial Sense, Seeking Alpha Contributor

This quote was from an article in Seeking Alpha that I read on the weekend. The author demonstrates why persistent inflation could disrupt the retirement planning communities’ rules.

“The first rule is the ‘age rule’ which defines how much of a person’s portfolio should be allocated between stocks and bonds. You take the number 100 minus your current age and that defines what you should allocate to stocks. For example, if you are age 65 when you retire, subtracting 65 from 100 equals 35%, the number you should invest in equities with the remaining 65% is invested in bonds and cash. At age 80, your equity portfolio would decline to 20%.

The second rule is on the withdrawal or spend down of your assets, which is 4% per year according to retirement planning advocates. Assuming a $1,000,000 portfolio, you would withdraw $40,000 a year which would last 25 years of your retirement.”

The author notes that both rules have major flaws with their reasoning, especially in a persistently high inflation environment. Purchasing power will be eaten away by inflation and prolonged bear markets can devastate retirement portfolios.

The two charts below show the historical inflation rates for Canada and the annual dividend growth rates of ‘The List’ we follow. Inflation hasn’t been much of a problem for investors in other strategies until recently, but it certainly will wreak havoc on purchasing power if it becomes persistent. The same holds true for a prolonged bear market for those who withdraw capital to live off in their retirement. Their portfolios will get smaller and smaller.

Alternatively, a dividend growth strategy means we don’t need to sell stocks in a bear market to pay our bills. We have dividends. On top of that, our dividends grow so we don’t lose purchasing power either.

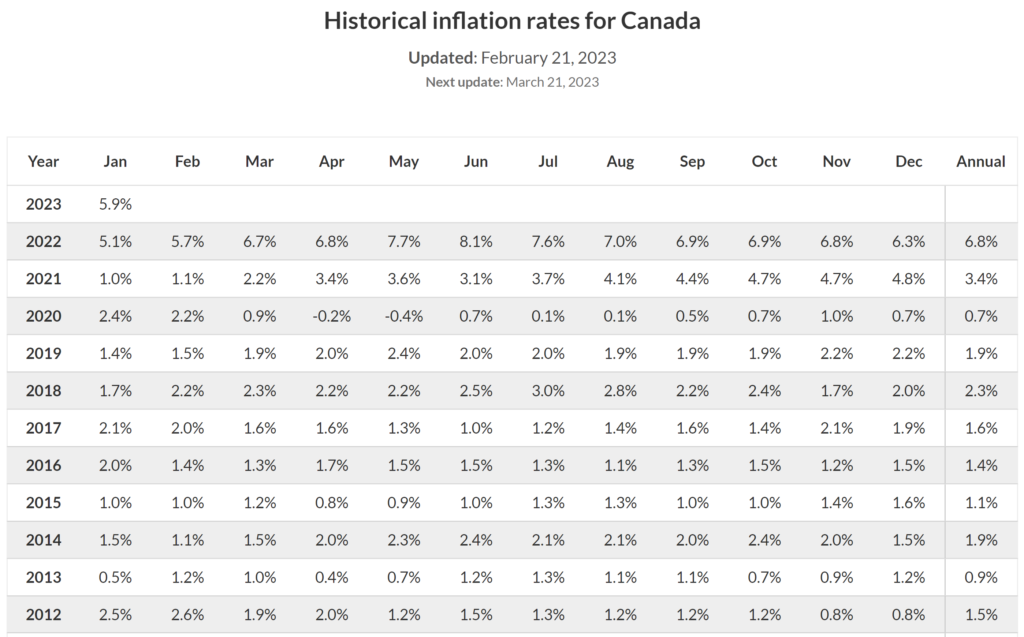
Source: rateinflation.com

Compare this inflation rate data to the dividend growth rates of the stocks on ‘The List’ over the same period:

Source: Magic Pants Dividend Growth Investing

When compared to historical inflation rates, an average annual 10% growth rate of our dividends means our purchasing power is increasing not decreasing. If there is a better inflation hedge than dividend growth, we haven’t found it yet.

Recent News

How to beat the pros, Part 2: Simplify by focusing on stocks of high quality

https://www.theglobeandmail.com/investing/education/article-how-to-beat-the-pros-part-2-simplify-by-focusing-on-stocks-of-high/

Recall the first rule in our process. We define quality much the same as this author except we throw in “…a lengthy record of consistent dividend growth” for good measure.

The author defines winners as quality companies that have the “durability of the company’s competitive advantage, predictability/understandability of the business model, and longevity/stability of the industry/market.” Sound familiar?

We like the author’s message here, only deal with high-quality companies. They have the highest probability of delivering higher returns over the long term.

Even as markets tumble, the dividend hikes keep coming (Globe & Mail)

https://www.theglobeandmail.com/investing/education/article-even-as-markets-tumble-the-dividend-hikes-keep-coming/

Not sure what to do with all the uncertainty in the markets?

“Stocks have been stumbling through February, as worries about the economy, interest rates and corporate earnings weigh on equity markets. But for dividend investors, it’s been a banner month.”

This is one of the great things about dividend growth stocks, no matter which direction the market moves, your income continues to grow. Don’t forget about inflation protection too. The income generated from ‘The List’ has already surpassed the inflation rate with more dividend raises last week.

The List (2023)

Last updated by BM on February 24, 2023

The Magic Pants List contains 27 Canadian dividend growth stocks. ‘The List’ contains Canadian companies that have raised their dividend yearly for at least the last ten years and have a market cap of over a billion dollars. Provided below is each stock’s symbol, name, current yield, current price, price return year-to-date, current dividend, dividend growth year-to-date and current dividend growth streak. Companies on ‘The List’ are added or subtracted once a year, on January 1. After that, ‘The List’ is set for the next twelve months. Prices and dividends are updated weekly.

SYMBOL COMPANY YLD PRICE YTD % DIV YTD % STREAK
AQN-N Algonquin Power & Utilities 6.5% $7.83 16.3% $0.51 -29.0% 12
ATD-T Alimentation Couche-Tard Inc. 0.9% $64.29 6.9% $0.56 19.1% 13
BCE-T Bell Canada 6.3% $60.46 0.4% $3.82 5.0% 14
BIP-N Brookfield Infrastructure Partners 4.4% $32.95 5.2% $1.44 6.3% 15
CCL-B-T CCL Industries 1.6% $65.04 12.0% $1.06 10.4% 21
CNR-T Canadian National Railway 2.0% $156.76 -3.8% $3.16 7.8% 27
CTC-A-T Canadian Tire 4.1% $169.49 15.6% $6.90 17.9% 12
CU-T Canadian Utilities Limited 4.9% $36.31 -1.7% $1.78 0.0% 51
DOL-T Dollarama Inc. 0.3% $79.36 -0.6% $0.22 2.3% 12
EMA-T Emera 5.1% $54.64 3.8% $2.76 3.0% 16
ENB-T Enbridge Inc. 6.9% $51.46 -3.5% $3.55 3.2% 27
ENGH-T Enghouse Systems Limited 1.8% $42.03 17.7% $0.74 3.5% 16
FNV-N Franco Nevada 1.1% $125.27 -9.3% $1.36 6.3% 15
FTS-T Fortis 4.1% $54.80 -1.0% $2.26 4.1% 49
IFC-T Intact Financial 2.2% $198.06 1.2% $4.40 10.0% 18
L-T Loblaws 1.4% $119.63 -0.6% $1.62 5.2% 11
MGA-N Magna 3.4% $53.80 -6.5% $1.84 2.2% 13
MRU-T Metro 1.7% $71.42 -5.4% $1.21 10.0% 28
RY-T Royal Bank of Canada 3.8% $137.22 7.2% $5.28 6.5% 12
SJ-T Stella-Jones Inc. 1.7% $47.55 -4.1% $0.80 0.0% 18
STN-T Stantec Inc. 1.0% $79.25 21.3% $0.77 8.5% 11
TD-T TD Bank 4.2% $91.11 3.9% $3.84 7.9% 12
TFII-N TFI International 1.1% $122.35 22.2% $1.40 29.6% 12
TIH-T Toromont Industries 1.5% $113.38 16.0% $1.68 10.5% 33
TRP-T TC Energy Corp. 6.6% $56.22 5.5% $3.69 3.4% 22
T-T Telus 5.2% $27.17 3.2% $1.40 5.4% 19
WCN-N Waste Connections 0.8% $134.13 1.8% $1.02 7.9% 13
Averages 3.1% 4.6% 6.2% 19

Six Canadian stocks on ‘The List’ declare earnings and dividends in US dollars and are inter-listed on a US exchange in US dollars. The simplest way to display dividend and price metrics for these stocks is to show their US exchange symbols along with their US dividends and price. The stocks I am referring to have a -N at the end of their symbols. You can still buy their Canadian counterparts (-T), but your dividends will be converted into CDN dollars and will fluctuate based on the exchange rate.

Note: When the currency of the dividend and share price match, the calculation is straightforward. But it’s not so simple when the dividend is declared in one currency and the share price is quoted in another. Dividing the former by the latter would produce a meaningless result because it’s a case of apples and oranges. To calculate the yield properly, you would need to express the dividend and share price in the same currency.

Performance of ‘The List’

Feel free to click on this link, ‘The List’ for a sortable version from our website.

Last week, ‘The List’ exhibited a YTD price return of +4.6% (capital), while its dividend growth increased to +6.2% YTD, highlighting growth in income over the past year.

The best performers last week on ‘The List’ were Stantec Inc. (STN-T), up +10.22%; CCL Industries (CCL-B-T), up +5.53%; and Toromont Industries (TIH-T), up +0.78%.

Franco Nevada (FNV-N) was the worst performer last week, down -5.42%.


Dividend Increases

“The growth of dividend paying ability is of significance in the determination of a stock’s quality, or general safety…”

– Arnold Bernhard (the founder of Value Line)

“As a dividend increase is a positive sign of a company’s financial strength, the safest purchase, after research, is a stock with a recent dividend increase.”

– Tom Connolly (the founder of dividendgrowth.ca)

Last week, there were two dividend increases from companies on ‘The List’.

CCL Industries (CCL-B-T) on Thursday, February 23, 2023, said it increased its 2023 quarterly dividend from $0.24 to $0.265 per share, payable March 31, 2023, to shareholders of record on March 17, 2023.

This represents a dividend increase of +10.4%, marking the 22nd straight year of dividend growth for this quality manufacturer of packaging and packaging-related products.

Stantec Inc. (STN-T) on Thursday, February 23, 2023, said it increased its 2023 quarterly dividend from $0.18 to $0.195 per share, payable April 17, 2023, to shareholders of record on March 31, 2023.

This represents a dividend increase of +8.3%, marking the 12th straight year of dividend growth for this quality global engineering, architecture, and environmental consulting company.


Earnings Releases

Benjamin Graham once remarked that earnings are the principal factor driving stock prices.

Each quarter we will provide readers with weekly earnings updates of stocks on ‘The List’ during the calendar earnings season. Q4 2022 is just about over and we are now seeing the beginning of the next earnings season with a couple of banks reporting this week.

The updated earnings calendar can be found here.

Earnings growth and dividend growth tend to go hand in hand, so this information can tell us a lot about the future dividend growth of our quality companies. Monitoring our dividend growers periodically is part of the process, and reading the quarterly earnings releases is a good place to start.

Three companies on ‘The List’ are due to report earnings this week. 

Royal Bank of Canada (RY-T) will release its first-quarter 2023 results on Wednesday, March 1, 2023, before markets open.

TD Bank (TD-T) will release its first-quarter 2023 results on Thursday, March 2, 2023, before markets open.

Canadian Utilities Limited (CU-T) will release its fourth-quarter 2022 results on Thursday, March 2, 2023, before markets open.

Last week, four companies on ‘The List’, reported their earnings.

Stantec (STN-T) released its fourth-quarter 2022 results on Wednesday, February 22, 2023, after markets closed.

“For the second consecutive year, we achieved record financial results, and I am extremely pleased that we outperformed our revenue and earnings guidance for 2022 on the strength of our outstanding fourth quarter performance.” said Gord Johnston, President and CEO. “I am also very proud that Stantec has again been ranked as one of the most sustainable companies in the world. These remarkable achievements are attributed to the dedication and passion of our employees. With the Cardno integration behind us, we expect our strong financial momentum to continue throughout 2023 and the years ahead.”

 – President and Chief Executive Officer, Gord Johnston

Highlights:

  • Net revenue of $4.5 billion in 2022, an increase of 22.6% over 2021
  • Adjusted diluted EPS1 of $3.13, an increase of 29.3% over 2021
  • Backlog of $5.9 billion, up 14.9% since December 31, 2021
  • Ranked #7 of the most sustainable corporations in the world by Corporate Knights, first among peers

Outlook:

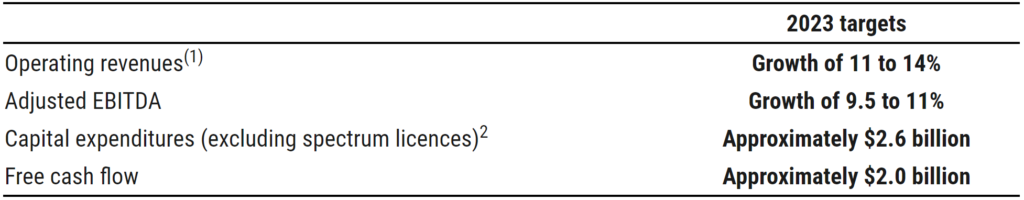
“Stantec is well positioned for another year of solid growth,” said Mr. Johnston. “Significant backlog and strong tailwinds of public and private investment, along with Stantec’s focus on project execution and operational efficiencies, support Stantec’s confidence for delivering on our strategic plan and 2023 targets.”

For 2023, Stantec has established the following targets and expectations.


Source: (STN-T) Q4-2022 Earnings Presentation


CCL Industries (CCL-B-T) released its fourth-quarter 2022 results on Wednesday, February 22, 2023, after markets closed.

“2022 was our third consecutive year of delivering record results despite difficult economic conditions including historic inflationary pressures, global supply chain disruptions, pandemic-related restrictions and geopolitical events disrupting commodity and energy markets. Our teams worked with resolve, dedication and passion delivering for customers and shareholders. 2022 was another year of strong free cash flow, largely reinvested in our businesses, positioning the Company for continued long term success.”

– Geoffrey T. Martin, President and Chief Executive Officer

Highlights:

Fourth Quarter Highlights

  • Per Class B share: $0.83 adjusted basic earnings up 2.5%; $0.82 basic earnings up 2.5%; currency translation positive $0.03
  • Sales increased 6.6% on 4.9% acquisition growth and 2.3% positive currency translation partially offset by 0.6% organic decline
  • Operating income increased 1.1%, with a 13.3% operating margin down 70 bps

2022 Highlights

  • Per Class B share: $3.57 adjusted basic earnings up 5.9%; $3.50 basic earnings up 5.1%; currency translation negative $0.02
  • Sales increased 11.3% on 7.3% organic growth and 4.8% acquisition growth partially offset by 0.8% negative currency translation
  • Operating income increased 4.8%, with a 14.6% operating margin down 90 bps
  • Annual dividend increased 10.4% effective March 17, 2023

Outlook:

  • Core CCL business units’ orders picture still solid
  • CCL Design: outlook similar to Q4
  • CCL Secure volume expected to improve
  • Avery direct to consumer strength remains, augmented by recent acquisitions, horticultural peak season in Q1
  • Checkpoint: apparel destocking expected to continue for some months, MAS outlook stable with easier comps
  • Innovia volume subject to label materials industry demand recovery, inflationary pressures and inventory cost squeeze both stabilizing
  • Modest FX tailwind

Source: (CCL-B-T) Q4-2022 Earnings Release


Loblaws (L-T) released its fourth-quarter 2022 results on Thursday, February 23, 2023, before markets opened.

“Loblaw used its assets to provide value to customers in a period of continued inflation,” said Galen G. Weston, Chairman and President, Loblaw Companies Limited. “Consumers responded favourably to those efforts and continued to benefit from our extensive private label offering, leading loyalty program and targeted promotions.”

– Galen G. Weston, Chairman and President

Highlights:

2022 FOURTH QUARTER HIGHLIGHTS

  • Revenue was $14,007 million, an increase of $1,250 million, or 9.8%.
  • Retail segment sales were $13,694 million, an increase of $1,208 million, or 9.7%.
    • Food Retail (Loblaw) same-stores sales increased by 8.4%.
    • Drug Retail (Shoppers Drug Mart) same-store sales increased by 8.7%, with front store same-store sales growth of 11.5% and pharmacy same-store sales growth of 5.4%.
  • E-commerce sales increased by 8.3%.
  • Operating income was $871 million, an increase of $166 million, or 23.5%.
  • Adjusted EBITDA was $1,493 million, an increase of $169 million, or 12.8%.
  • Retail segment adjusted gross profit percentage was 30.6%, a decrease of 30 basis points.
  • Retail segment selling, general and administrative expenses (“SG&A”) as a percentage of sales was 20.2%, a favourable decrease of 70 basis points.
  • Net earnings available to common shareholders of the Company were $529 million, a decrease of $215 million or 28.9%. Diluted net earnings per common share were $1.62, a decrease of $0.58, or 26.4%. The decrease was primarily driven by a prior year gain related to a favourable Court ruling.
  • Adjusted net earnings available to common shareholders of the Company were $575 million, an increase of $60 million, or 11.7%.
  • Adjusted diluted net earnings per common share were $1.76, an increase of $0.24 or 15.8%.
  • Repurchased for cancellation 0.8 million common shares at a cost of $100 million and invested $599 million in capital expenditures, net of proceeds from property disposals. Retail segment free cash flow was $408 million.

2022 SELECT ANNUAL HIGHLIGHTS

  • Revenue was $56,504 million, an increase of $3,334 million, or 6.3%.
  • Food Retail same-store sales increased by 4.7% and Drug Retail same-store sales increased by 6.9%.
  • E-commerce sales were approximately $3 billion, a decrease of 3.8%, lapping elevated online sales due to lockdowns last year.
  • Net earnings available to common shareholders of the Company were $1,909 million, an increase of $46 million or 2.5%. Diluted net earnings per common share were $5.75, an increase of $0.30, or 5.5%.
  • Adjusted net earnings available to common shareholders of the Company were $2,263 million, an increase of $352 million, or 18.4%.
  • Adjusted diluted net earnings per common share were $6.82, an increase of $1.23, or 22.0%.
  • Repurchased for cancellation, 10.9 million common shares at a cost of $1,258 million and invested $1,407 million in capital expenditures, net of proceeds from property disposals. Retail segment free cash flow was $2,005 million.

Outlook:

Loblaw will continue to execute on retail excellence while advancing its growth initiatives in 2023. The Company’s businesses remain well placed to service the everyday needs of Canadians. However, the Company cannot predict the precise impacts of global economic uncertainties, including the inflationary environment, on its 2023 financial results.

For the full-year 2023, Loblaw expects:

  • its Retail business to grow earnings faster than sales;
  • Adjusted net EPS growth in the low double digits;
  • to increase investments in our store network and distribution centres by investing a net amount of $1.6 billion in capital expenditures; and
  • to return capital to shareholders by allocating a significant portion of free cash flow to share repurchases.

Source: (L-T) Q4-2022 Earnings Release


Emera Inc. (EMA-T) released its fourth-quarter 2022 results on Thursday, February 23, 2023, before markets opened.

“In 2022, we continued our track record of delivering for both our customers and shareholders. We successfully executed a $2.6 billion capital plan focused on delivering cleaner and more reliable energy for our customers, leading to strong earnings growth and supporting continued dividend increases for our shareholders” said Scott Balfour, President and CEO of Emera Inc. “In 2023, we will remain focused on leading a balanced energy transition at a pace that is as cost effective as possible for customers and supports system reliability.”

– Scott Balfour, President and Chief Executive Officer

Highlights:

Q4 2022 Financial Results

  • Q4 2022 reported net income was $483 million, or $1.80 per common share, compared with net income of $324 million, or $1.24 per common share, in Q4 2021. Reported net income included a $307 million after-tax MTM gain, primarily at EES, compared to a $156 million gain in Q4 2021 and a $73 million non-cash impairment charge related to Grand Bahama Power Company (“GBPC”).
  • Q4 2022 adjusted net income was $249 million, or $0.93 per common share, compared with $168 million, or $0.64 per common share, in Q4 2021. The increase was primarily due to the litigation award in Q4 2022; higher earnings contribution from Tampa Electric, EES and NMGC; and the impact of a weaker Canadian dollar (“CAD”). These were partially offset by lower earnings contribution from NSPI and increased corporate operating, maintenance and general expenses (“OM&G”) due to the timing of long-term compensation and related hedges and higher corporate interest expense.

Annual Financial Results

  • 2022 reported net income was $945 million or $3.56 per common share, compared with a net income of $510 million or $1.98 per common share in 2021. 2022 reported net income included a $175 million after-tax MTM gain primarily at EES, compared to $213 million loss in 2021, a $73 million non-cash impairment charge related to GBPC and $7 million of NSP Maritime Link Inc. (“NSPML”) unrecoverable costs.
  • 2022 adjusted net income was $850 million or $3.20 per common share, compared with $723 million or $2.81 per common share in 2021.
  • Growth in 2022 adjusted net income was primarily due to higher earnings contributions from Tampa Electric, EES, and PGS; the litigation award in Q4 2022; and the impact of a weaker CAD. These were partially offset by increased corporate OM&G due to the timing of long-term compensation and related hedges, higher corporate interest expense, realized gains on corporate FX hedges in 2021, increased preferred stock dividends and lower earnings contribution from NSPI.
  • The impact of the weakening CAD, partially offset by the unrealized losses on FX hedges increased reported net income by $42 million in Q4 2022 and $30 million for the year ended December 31, 2022, compared to the same periods in 2021. Weakening of the CAD increased adjusted net income by $14 million in Q4 2022 and $28 million for the year ended December 31, 2022, compared to the same periods in 2021. The impacts of the weakening CAD include the realized impacts of corporate FX hedges in the Other segment.

Outlook:

“In 2023, we will remain focused on leading a balanced energy transition at a pace that is as cost effective as possible for customers and supports system reliability,” said Scott Balfour, president and CEO of Emera.

Source: (EMA-T) Q4-2022 Earnings Presentation

MP Market Review – February 17, 2023

Last updated by BM on February 20, 2023

Summary

  • This is a weekly installment of our MP Market Review series, which provides updates on the financial markets and Canadian dividend growth companies we monitor on ‘The List’.
  • Last week, ‘The List’ exhibited a YTD price return of +5.4% (capital), while its dividend growth increased to +5.6% YTD, highlighting a growth in income over the past year.
  • Last week, there were two dividend increases from companies on ‘The List’.
  • Last week, there were four earnings reports from companies on ‘The List’.
  • Four companies on ‘The List’ are due to report earnings this week.
  • If you’re interested in creating your own income portfolio, consider subscribing to our premium service, which grants you access to the MP Wealth-Builder Model Portfolio (CDN) and exclusive subscriber-only content. Learn More 

Introduction

“You have a pair of pants. In the left pocket, you have a $100. You take $1 out of the left pocket and put in the right pocket. You now have a $101. There is no diminution of dollars in your left pocket. That is one magic pair of pants.”

This ‘magic pants’ analogy was from a Seeking Alpha article on dividend investing I read in 2012 and was the catalyst for me to take a closer look at this type of investing and see if it truly was magical. 

After conducting additional research, I have shifted towards utilizing a dividend growth investing (DGI) strategy as my primary investment approach. While I maintain portfolios consisting of high-quality dividend growers from both the United States and Canada, I have opted to concentrate on Canadian (CDN) dividend growth companies in this blog. This is due to several reasons, including a smaller pool of DGI companies to track, a lack of coverage for the DGI strategy by Canadian investment media, and a tendency for those who do cover DGI to narrowly focus on only a handful of sectors (Energy and Financials).

While ‘The List’ is not a portfolio in itself, it serves as an excellent initial reference for individuals seeking to diversify their investments and attain higher returns in the Canadian stock market. Through our blog, we provide weekly updates on ‘The List’ and offer valuable perspectives and real-life examples of the dividend growth investing strategy in practice. This helps readers gain a deeper understanding of how to implement and benefit from this investment approach.

Recent News

Job growth is surging, but the picture is more complicated (Globe & Mail)

https://www.theglobeandmail.com/investing/markets/inside-the-market/article-job-growth-is-surging-but-the-picture-is-more-complicated/

Just a few months ago, negative news appeared to have a positive impact on the stock market. Every time the central banks announced interest rate increases, stocks would surge higher. This was because it was believed that the interest rate hikes were coming to a close, and as a result, a bull market was on the horizon. However, the situation has now reversed, and positive news is having a negative impact on the stock market.

Although core inflation figures have ceased to accelerate and have even declined slightly, job creation is continuing to increase, indicating that wage growth is not subsiding. Given that overall inflation is not decreasing rapidly enough, central bankers may be compelled to resume raising interest rates to further cool down the economy. However, this could exacerbate the situation as it may negatively impact company earnings, which are already declining.

I appreciate the author’s probability scale, which outlines his assessment of the market forecast with the greatest likelihood.

Inflation will be harder to bring down than markets think (The Economist)

https://rb.gy/twrqsn

This article backs up the previous one but goes a step further. The author predicts a “nasty correction”!

“America’s “core” prices, which exclude volatile food and energy, grew at an annualized pace of 4.6% over the past three months, and have started gently accelerating. The main source of inflation is now the services sector, which is more exposed to labour costs. In America, Britain, Canada and New Zealand wage growth is still much higher than is consistent with the 2% inflation targets of their respective central banks; pay growth is lower in the euro area, but rising in important economies such as Spain.”

The author concludes that central bankers in wealthy nations have not indicated any intention to change their stance. However, even if inflation declines or they abandon their efforts to combat it, policymakers are unlikely to execute a seamless shift. Investors have positioned themselves for frustration, whether it’s due to persistently high rates, a recession, or a turbulent period of policy transition.

The List (2023)

Last updated by BM on February 17, 2023

The Magic Pants List contains 27 Canadian dividend growth stocks. ‘The List’ contains Canadian companies that have raised their dividend yearly for at least the last ten years and have a market cap of over a billion dollars. Provided below is each stock’s symbol, name, current yield, current price, price return year-to-date, current dividend, dividend growth year-to-date and current dividend growth streak. Companies on ‘The List’ are added or subtracted once a year, on January 1. After that, ‘The List’ is set for the next twelve months. Prices and dividends are updated weekly.

SYMBOL COMPANY YLD PRICE YTD % DIV YTD % STREAK
AQN-N Algonquin Power & Utilities 6.5% $7.83 16.3% $0.51 -29.0% 12
ATD-T Alimentation Couche-Tard Inc. 0.9% $65.59 9.1% $0.56 19.1% 13
BCE-T Bell Canada 6.2% $61.78 2.6% $3.82 5.0% 14
BIP-N Brookfield Infrastructure Partners 4.4% $32.95 5.2% $1.44 6.3% 15
CCL-B-T CCL Industries 1.6% $61.63 6.2% $0.96 0.0% 21
CNR-T Canadian National Railway 2.0% $157.22 -3.5% $3.16 7.8% 27
CTC-A-T Canadian Tire 4.0% $174.64 19.1% $6.90 17.9% 12
CU-T Canadian Utilities Limited 4.9% $36.49 -1.2% $1.78 0.0% 51
DOL-T Dollarama Inc. 0.3% $79.92 0.1% $0.22 2.3% 12
EMA-T Emera 5.0% $54.77 4.1% $2.76 3.0% 16
ENB-T Enbridge Inc. 6.8% $52.38 -1.8% $3.55 3.2% 27
ENGH-T Enghouse Systems Limited 1.7% $42.46 18.9% $0.74 3.5% 16
FNV-N Franco Nevada 1.0% $132.45 -4.1% $1.36 6.3% 15
FTS-T Fortis 4.1% $55.74 0.7% $2.26 4.1% 49
IFC-T Intact Financial 2.2% $202.70 3.5% $4.40 10.0% 18
L-T Loblaws 1.4% $118.89 -1.2% $1.62 5.2% 11
MGA-N Magna 3.3% $56.60 -1.6% $1.84 2.2% 13
MRU-T Metro 1.7% $71.90 -4.7% $1.21 10.0% 28
RY-T Royal Bank of Canada 3.8% $138.79 8.4% $5.28 6.5% 12
SJ-T Stella-Jones Inc. 1.7% $47.95 -3.3% $0.80 0.0% 18
STN-T Stantec Inc. 1.0% $71.90 10.1% $0.72 2.1% 11
TD-T TD Bank 4.1% $92.87 5.9% $3.84 7.9% 12
TFII-N TFI International 1.1% $125.93 25.8% $1.40 29.6% 12
TIH-T Toromont Industries 1.5% $112.50 15.1% $1.68 10.5% 33
TRP-T TC Energy Corp. 6.5% $56.84 6.6% $3.69 3.4% 22
T-T Telus 5.1% $27.79 5.6% $1.40 5.4% 19
WCN-N Waste Connections 0.7% $136.11 3.3% $1.02 7.9% 13
Averages 3.1% 5.4% 5.6% 19

Six Canadian stocks on ‘The List’ declare earnings and dividends in US dollars and are inter-listed on a US exchange in US dollars. The simplest way to display dividend and price metrics for these stocks is to show their US exchange symbols along with their US dividends and price. The stocks I am referring to have a -N at the end of their symbols. You can still buy their Canadian counterparts (-T), but your dividends will be converted into CDN dollars and will fluctuate based on the exchange rate.

Note: When the currency of the dividend and share price match, the calculation is straightforward. But it’s not so simple when the dividend is declared in one currency and the share price is quoted in another. Dividing the former by the latter would produce a meaningless result because it’s a case of apples and oranges. To calculate the yield properly, you would need to express the dividend and share price in the same currency.

Performance of ‘The List’

Feel free to click on this link, ‘The List’ for a sortable version.

Last week, ‘The List’ was up with a +5.4% YTD price return (capital). Dividend growth of ‘The List’ increased to +5.6% YTD, demonstrating the rise in income over the last year.

The best performers last week on ‘The List’ were Canadian Tire (CTC-A-T), up +9.02%; Algonquin Power & Utilities (AQN-N), up +5.38%; and Alimentation Couche-Tard Inc. (ATD-T), up +4.84%.

Enbridge Inc. (ENB-T) was the worst performer last week, down -3.27%.


Dividend Increases

“The growth of dividend paying ability is of significance in the determination of a stock’s quality, or general safety…”

– Arnold Bernhard (the founder of Value Line)

“As a dividend increase is a positive sign of a company’s financial strength, the safest purchase, after research, is a stock with a recent dividend increase.”

– Tom Connolly 

Last week, there were two dividend increases from companies on ‘The List’.

TC Energy (TRP-T) on Tuesday, February 14, 2023, said it increased its 2023 quarterly dividend from $0.90 to $0.93 per share, payable April 28, 2023, to shareholders of record on March 31, 2023.

This represents a dividend increase of +3.3%, marking the 23rd straight year of dividend growth for this quality pipeline and operator of power generation assets.

Toromont Industries (TIH-T) on Tuesday, February 14, 2023, said it increased its 2023 quarterly dividend from $0.39 to $0.43 per share, payable April 04, 2023, to shareholders of record on March 9, 2023.

This represents a dividend increase of +10.3%, marking the 34th straight year of dividend growth for this quality industrial equipment company.


Earnings Releases

Benjamin Graham once remarked that earnings are the principal factor driving stock prices.

Each quarter we will provide readers with weekly earnings updates of stocks on ‘The List’ during the calendar earnings season. Q4 2022 has now ended, and companies are now beginning to report.

The updated earnings calendar can be found here.

Earnings growth and dividend growth tend to go hand in hand, so this information can tell us a lot about the future dividend growth of our quality companies. Monitoring our dividend growers periodically is part of the process, and reading the quarterly earnings releases is a good place to start.

Four companies on ‘The List’ are due to report earnings this week. 

Stantec (STN-T) will release its fourth-quarter 2022 results on Wednesday, February 22, 2023, after markets close.

CCL Industries (CCL-B-T) will release its fourth-quarter 2022 results on Wednesday, February 22, 2023, after markets close.

Loblaws (L-T) will release its fourth-quarter 2022 results on Thursday, February 23, 2023, before markets open.

Emera Inc. (EMA-T) will release its fourth-quarter 2022 results on Thursday, February 23, 2023, before markets open.

Last week, four companies on ‘The List’, reported their earnings.

We are now seventy percent of the way through earnings season, with four more companies on ‘The List’ reporting last week. For the most part, earnings have been good compared to estimates. All four companies that reported beat estimates, with (TIH-T) and (CTC-A-T) doing so quite handily.

TC Energy (TRP-T) released its fourth-quarter 2022 results on Tuesday, February 14, 2023, before markets opened.

“2022 has been a record setting year with continued demand and strong utilization across our systems, which is highlighted by TC Energy’s comparable earnings per common share of $4.30 and comparable EBITDA1 of $9.9 billion.” Poirier continued, “Our business remains resilient and is expected to deliver strong comparable EBITDA growth in 2023. We have a defined funding plan in place that will allow us to continue to progress our industry leading capital program and accelerate our deleveraging target.”

 – President and Chief Executive Officer, François Poirier

Highlights:

  • Reaffirmed 2023 financial outlook with comparable EBITDA expected to be five to seven per cent higher than 2022, while comparable earnings per common share is expected to be modestly higher than 2022
  • Capital spending in 2023 is expected to be approximately $11.5 to $12.0 billion which we anticipate will be funded through a combination of internally generated cash flow, incremental long-term debt and hybrid capacity and through our asset divestiture program
  • Majority of the 2023 capital program is focused on NGTL System expansions, advancement of the Southeast Gateway Pipeline and the Coastal GasLink pipeline project, U.S. Natural Gas Pipelines projects, the Bruce Power life extension program and normal course maintenance capital expenditures
  • Fourth quarter 2022 results were underpinned by strong utilization across our assets, reflecting the continued high demand for our services
  • On December 19, 2022, NGTL System set a new record for delivery of 16.4 Bcf
  • On December 23, 2022, U.S. Natural Gas Pipelines experienced an all-time peak delivery record of 36.6 Bcf
  • Bruce Power achieved 87 per cent availability and the Unit 4 planned outage was completed approximately 22 days ahead of schedule
  • Power and Energy Solutions had high power plant availability during the coldest days in December when the average of Alberta power prices reached approximately $312/MWh

Financial results: Fourth quarter 2022

  • Net losses attributable to common shares of $1.4 billion or $1.42 per common share, compared to net income of $1.1 billion or $1.14 per common share in 2021
  • Segmented losses of $1.0 billion compared to segmented earnings of $1.9 billion in 2021 and comparable EBITDA of $2.7 billion compared to $2.4 billion in 2021

Financial results: year ended December 31, 2022

  • Net income attributable to common shares of $0.6 billion or $0.64 per common share, compared to net income of $1.8 billion or $1.87 per common share in 2021
  • Segmented earnings of $3.6 billion compared to $4.1 billion in 2021 and comparable EBITDA of $9.9 billion compared to $9.4 billion in 2021
  • TC Energy’s Board of Directors approved a 3.3 per cent increase in the quarterly common share dividend to $0.93 per common share for the quarter ending March 31, 2023
  • Dividend Reinvestment and Share Repurchase Plan (DRP) participation rate amongst common shareholders was approximately 33 per cent, resulting in $607 million reinvested in common equity from the dividends declared in 2022
  • Sanctioned $8.8 billion of projects and placed $5.8 billion of projects in service in 2022, and expect to place approximately $6 billion of new projects in service in 2023
  • Continued to advance industry leading $34 billion secured capital program, with various projects helping advance GHG emissions reduction goals
  • Placed the Alberta XPress project in service in January 2023 and approved a 63 km (39 mile), 1.4 Bcf/d extension of the Gillis Access project in February 2023 to further connect supplies from the Haynesville basin at Gillis
  • Executed main land acquisition agreements required for land falls and compressor stations in Veracruz and Tabasco for the Southeast Gateway Pipeline project, supporting our commitment and execution of the first critical path milestones
  • Announced updated cost estimates to the Coastal GasLink pipeline project on February 1, 2023. TC Energy’s project cost estimate has increased to $14.5 billion.

Outlook:

We expect our 2023 comparable EBITDA to be higher than 2022 and our 2023 comparable earnings per common share are expected to be modestly higher than 2022 due to the net impact of the following:

  • growth in the NGTL System from advancement of expansion programs
  • higher contributions from our Mexico Natural Gas Pipelines segment primarily related to the new Transportadora de Gas Natural de la Huasteca (TGNH) Transport Service Agreement (TSA) with the CFE
  • full-year impact from assets placed in service in 2022 and new projects anticipated to be placed in service in 2023, net of incremental depreciation expense
  • lower contributions from the Keystone Pipeline System including liquids marketing, primarily as a result of the de-rate associated with the Milepost 14 incident and continuing lower margins
  • higher Interest expense as a result of long-term debt issuances, net of maturities and higher floating interest rates
  • higher AFUDC related to the Southeast Gateway Pipeline.

We continue to monitor developments in energy markets, our construction projects, regulatory proceedings and our asset divestiture program for any potential impacts on the above outlook.

See the full Earnings Release here


Toromont Industries (TIH-T) released its fourth-quarter 2022 results on Tuesday, February 14, 2023, after markets closed.

“Our team delivered solid operating and financial performance in the fourth quarter and throughout the year, ending in a strong position. We continue to monitor supply and other uncertain market and economic variables. The Equipment Group continued to execute well delivering strong rental and product support results while optimizing equipment and parts sales. Supply chain challenges persisted, albeit some product lines have shown recent improvement. CIMCO revenue improved in the quarter on project construction and higher product support activity. Across the organization, we remain committed to our operating disciplines, driving our after-market strategies and delivering customer solutions.”

– Scott J. Medhurst, President and Chief Executive Officer

Highlights:

  • Revenue increased $194.1 million or 20% in the fourth quarter compared to the similar period last year. Equipment Group revenue was up 22% and CIMCO revenue was up 7% compared to prior year, however both groups continue to experience delays in equipment deliveries and project construction due to supply chain constraints in the quarter. Product support revenue was 19% higher on increased demand in both Groups, while rental revenue grew 10% on a larger fleet and higher activity levels.
  • Revenue increased $344.2 million (9%) to $4.2 billion for the year. Equipment Group revenue increased 10% while CIMCO revenue was down 3% on a tough comparable last year. Rental revenue was up 17% and exceeded levels in 2019 (pre-pandemic). Product support revenues were up 16%, with growth in both groups, reflecting continuing activity in end markets and the company’s growth strategies in this important market.
  • In the fourth quarter of 2022, a property was sold resulting in a pre-tax gain of $17.7 million ($15.4 million after-tax). This facility was previously a Battlefield branch, acquired in the 2017 QM acquisition. The disposition was part of the rental integration and operation excellence footprint strategy.
  • Operating income increased 43% in the quarter reflecting the higher revenue, the gain on property disposal, and lower expenses. Operating income as a percentage of sales increased to 18.5% (16.9% excluding the property gain) from 15.6% in the prior year.
  • Operating income increased 31% in the year, and was 14.8% of revenue compared to 12.2% in the similar period last year, reflecting the continued favourable sales mix, improved gross margin and lower expense ratio (including the property dispositions).
  • Net earnings increased $54.3 million or 51% in the quarter versus a year ago to $159.9 million or $1.94 EPS (basic) and $1.93 EPS (fully diluted).
  • For the year, net earnings increased $121.5 million or 37% to $454.2 million, or $5.52 EPS (basic) and $5.47 EPS (fully diluted).
  • Bookings decreased 33% in the quarter compared to the similar period and were down 27% on a full year basis. Equipment Group bookings were lower in both periods against a tough comparable last year with significant construction and mining orders received based on market conditions at that time. CIMCO had good booking activity in the year, up 10%.
  • Backlog remained relatively unchanged from this time last year at $1.3 billion, reflecting strong order activity over the past year coupled with selective equipment inflow, however ongoing supply constraints still persist.

Outlook:

  • Expecting the business environment to gradually improve with persistent challenges, key factors monitored:
    • Dynamics of the supply chain
    • Inflationary & macro-economic developments
    • Customer credit risk in light of elevated interest rates
    • Status of the pandemic
  • Our focus areas:
    • Continue to protect our employees
    • Serve and support our customer requirements
    • Protect and build our business for the future (leveraging the learnings & managing risks)
  • Backlogs remain well positioned, but deliveries subject to availability of certain models & economic conditions
  • Technician hiring is a key priority, we’ve made progress in 2022 and it remains essential to support the growing demand for our product support and evolving customer requirements
  • Financially, we are well positioned with ample liquidity and our disciplined culture and track record of investing in organic growth initiatives and complementary opportunities

See the full Earnings Release here


Waste Connections (WCN-N) released its fourth-quarter 2022 results on Wednesday, February 15, 2023, after markets closed.

“Q4 topped off an extraordinary year for Waste Connections, highlighted by continuing outperformance during the period and providing a higher entry point and enhanced visibility for 2023. Strong operational execution and over 10% solid waste pricing, along with acquisitions closed during the period, once again provided for better than expected results,” chief executive Worthing Jackman said in a release.

– Worthing Jackman, Chief Executive Officer

Highlights:

Fourth Quarter Highlights

  • Price-led organic growth and acquisition activity drive Q4 results above expectations and provide higher entry point into 2023
  • Revenue of $1.869 billion, net income(a) of $194.4 million, and adjusted EBITDA(b) of $563.6 million, or 30.2% of revenue, above expectations
  • Net income and adjusted net income(b) of $0.75 and $0.89 per share, respectively

Full Year 2022 Highlights

  • Revenue of $7.212 billion, up 17.2%
  • Net income of $835.7 million, or $3.24 per share, and adjusted net income(b) of $985.3 million, or $3.82 per share, up 18.3%
  • Adjusted EBITDA(b) of $2.221 billion, up 15.7%, and 30.8% of revenue, up 10 basis points year over year, excluding acquisitions
  • Net cash provided by operating activities of $2.022 billion, up 19.1%, and adjusted free cash flow(b) of $1.165 billion, up 15.4%
  • Completes acquisitions with approximately $640 million of total annualized revenue in 2022

Outlook:

  • Strong pricing and acquisition growth to drive both double-digit percentage increase in revenue, and adjusted EBITDA* margin expansion
  • Revenue of approximately $8.05 billion, up 11.6%
  • Net income of approximately $961 million and adjusted EBITDA(b) of approximately $2.50 billion, or about 31.1% of revenue
  • Additional acquisitions, increases in recycled commodities and renewable fuels values, or reduction of inflationary pressures to provide upside to 2023 outlook

See the full Earnings Release here


Canadian Tire (CTC-A-T) released its fourth-quarter 2022 results on Thursday, February 16, 2023, before markets opened.

“Our record fourth-quarter EPS performance was a great finish to a remarkable centennial year. These results, combined with a strong retail topline over the year, demonstrate we managed well through a dynamic economic environment,” said Greg Hicks, President and CEO, Canadian Tire Corporation. “Our Triangle Membership delivered outsized growth over the year and continues to provide us with the rich first party data needed to offer personalized experiences and ultimately drive spend.”

– Greg Hicks, President and Chief Executive Officer

Highlights:

Fourth Quarter highlights

  • Consolidated retail sales were up 1.2% compared to the fourth quarter of 2021, and up 17.6% on a three-year stacked basis; consolidated comparable sales were in line with 2021’s exceptional performance, and up 21.1% on a three-year stacked basis
    • Canadian Tire Retail comparable sales were in line with 2021, when comparable sales were up 9.8%; Automotive continued to deliver the strongest growth in the fourth quarter
    • Mark’s had its tenth consecutive quarter of comparable sales growth, up 4.3%, driven by strength in footwear categories
    • Licensed apparel sales partly offset declines in categories such as outerwear at SportChek, which ended the quarter down 1.7%
    • Helly Hansen was a strong contributor to retail revenue growth in the quarter, up 20.6%, led by increased sales of sportswear through its North American channels
  • Q4 Diluted Earnings Per Share was a record $9.09, up 9% compared to Q4 2021; normalized diluted EPS was up 11% to $9.34, driven mainly by higher revenue in both Retail and Financial Services, and a higher Retail gross margin rate
    • Retail segment income before income taxes (IBT) was $642.4 million, up from $638.1 million in Q4 2021, driven by an increase in retail revenue of 3.3%, or 2.3% excluding Petroleum, and retail gross margin dollars up 3.5%; retail gross margin rate (excluding Petroleum) was up 40 basis points
    • Financial Services delivered strong quarterly IBT, up 37.5% to $86.8 million, with higher revenue, up 14.3%, and lower operating expense

Outlook:

“In 2023, we will continue to focus on delivering value to our customers through the unique capabilities of our Owned Brands, multi-category assortment, and Triangle Rewards,” said Hicks. “With these assets and the resilience of our brand, people and Better Connected strategy, we are better positioned than ever to compete and win.”

See the full Earnings Release here


MP Market Review – February 10, 2023

Last updated by BM on February 13, 2023

Summary

  • This article is part of our weekly series (MP Market Review) highlighting the performance and activity from the previous week related to the financial markets and Canadian dividend growth companies we follow on ‘The List’.
  • Last week, ‘The List’ was down a bit with a +3.9% YTD price return (capital). Dividend growth of ‘The List’ increased to +5.2% YTD, demonstrating the rise in income over the last year.  
  • Last week, there were three dividend increases from companies on ‘The List’.
  • Last week, there were six earnings reports from companies on ‘The List’.
  • Four companies on ‘The List’ are due to report earnings this week.
  • Are you looking to build an income portfolio of your own? When you become a premium subscriber, you get exclusive access to the MP Wealth-Builder Model Portfolio (CDN) and subscriber-only content.  Learn More

 “This above all: To thine own self be true”

 – William Shakespeare, Hamlet

The line “To thine own self be true” is from Act 1, Scene 3 of Shakespeare’s play, Hamlet. It was spoken by a father giving advice to his son before the latter left for university. We thought this counsel was applicable to those who are new to dividend growth investing (DGI) since they may have to ignore much of the investment guidance they have received to succeed with DGI.

Our belief has always been that to outperform the market, investors must think differently. Our strategy differs greatly from what is commonly found in today’s financial media. DGI hearkens back to a time when an individual’s wealth was determined by the income their assets produced, not the size of their portfolio at a given moment. This mindset is shared by Pat Keogh in his book, Make Your Family Rich, where he urges readers to adopt a similar approach.

According to Keogh, the first step in DGI is to stop viewing it as investing in a stock portfolio and instead, as buying businesses. By doing so, you become the manager of your own part-time asset management business and can shift the focus to making these businesses work for you, rather than the other way around.

The second step, as per Keogh, is to embrace a long-term investing mindset and give dividend growth investing sufficient time to yield results. To achieve this, one must stop thinking about retirement planning and start thinking about succession planning, with the aim of creating a business that will last for generations. By doing so, the pressure to achieve quick success is reduced, and investors are more inclined to adhere to the DGI process. Passing on the knowledge of DGI to family members and continuing to build wealth for future generations is always an option.

Lastly, Keogh recommends that investors shift their focus from constantly monitoring their portfolio value to instead examining the income it generates. By keeping track of the increase in income generated from investments, investors can measure their progress and ask themselves one simple question, “How much did my income increase from the previous year?” as a means of keeping score.

Discovering an investment strategy that aligns with your values and principles can be a challenging endeavour. The best way to determine if DGI is a suitable fit for you is to try it out.

Our asset management business, the Magic Pants Wealth-Builder Model Portfolio (CDN), has recently completed its third quarter, and in a year where most investment strategies produced negative returns, we continued to outperform the markets. More importantly, our income has already started to grow.

Here is a snapshot of our portfolio transactions and their performance as of January 31, 2023:

Statistically, we don’t always have a 100% success rate on our trades in the short term but we have been able to consistently deliver about 95% over the longer term (3-5 years).

We encourage you to join us, in our journey, as we offer guidance and expand the portfolio according to our business plan. We will send out alerts every time we make a purchase and provide detailed explanations behind our decisions. Starting your own DGI portfolio has never been easier!

For those of you who are readers of the blog but not yet subscribers, go to the link at the bottom of the ‘Subscribe’ page and sign up.

Be true to ‘thine self’ and start building real wealth today!

Performance of ‘The List’

At the end of the post is a snapshot of ‘The List’ from last Friday’s close. Feel free to click on the ‘The List’ menu item above for a sortable version.

Last week, ‘The List’ was down with a +3.9% YTD price return (capital). Dividend growth of ‘The List’ increased to +5.2% YTD, demonstrating the rise in income over the last year.

The best performers last week on ‘The List’ were TFI International (TFII-T), up +5.06%; Alimentation Couche-Tard Inc. (ATD-T), up +3.70%; and Waste Connections (WCN-N), up +2.34%.

Magna (MGA-N) was the worst performer last week, down -18.96%.

Recent News

Fallen dividend stars of yesteryear are a reminder of the need for investor vigilance. (Globe & Mail)

https://www.theglobeandmail.com/investing/investment-ideas/article-fallen-dividend-stars-of-yesteryear-are-a-reminder-of-the-need-for/

“Take a lesson, dividend fans. Never sleep on your holdings.”

An excellent quote from the author of this article. Step three in our process is about monitoring our portfolios. That is another reason we believe in concentrated portfolios. A lot fewer stocks to follow.

The author makes the point that dividend growth rates are hard to maintain and you must be vigilant in  watching out for a slowing dividend growth rate. If you are looking for a current example, remember Algonquin Power (AQN-N), a company on ‘The List’ we wrote about earlier in the year after a dividend cut was announced. Its dividend growth rate was slowing.

There will typically be a few dividend growth rates slowing during recessionary periods. The trick is knowing if this is just short term good governance on the part of the company or the start of some longer-term issues.

BMO strategist says investors should be seeking dividend growth stocks, provides list of options (Globe & Mail)

https://www.theglobeandmail.com/investing/markets/inside-the-market/article-bmo-strategist-says-investors-should-be-seeking-dividend-growth-stocks/

“Despite the slight underperformance year to date, we believe income-based strategies remain well-positioned to outperform again in 2023, particularly as the market struggles with the end of the interest rate tightening cycle, elevated but declining inflationary levels, and recession risk.”

Some good news for dividend growth investors in this article. His list includes some of the names we follow as well.

Dividend Increases

Last week, there were three dividend increases from companies on ‘The List’.

Intact Financial (IFC-T) on Tuesday, February 07, 2023, said it increased its 2023 quarterly dividend from $1.00 to $1.10 per share, payable March 31, 2023, to shareholders of record on March 14, 2023.

This represents a dividend increase of +10.0%, marking the 19th straight year of dividend growth for this quality property and casualty insurance provider.

Telus (T-T) on Tuesday, February 09, 2023, said it increased its 2023 quarterly dividend from $0.3274 to $0.3511 per share, payable April 03, 2023, to shareholders of record on March 10, 2023.

This represents a dividend increase of +7.2%, marking the 20th straight year of dividend growth for this quality telco.

Magna (MGA-N) on Friday, February 10, 2023, said it increased its 2023 quarterly dividend from $0.45 to $0.46 per share, payable March 10, 2023, to shareholders of record on February 24, 2023.

This represents a dividend increase of +2.2%, marking the 14th straight year of dividend growth for this quality automotive supplier.

Earnings Releases

Four companies on ‘The List’ are due to report earnings this week.  

TC Energy (TRP-T) will release its fourth-quarter 2022 results on Tuesday, February 14, 2023, before markets open.

Toromont Industries (TIH-T) will release its fourth-quarter 2022 results on Tuesday, February 14, 2023, after markets close.

Waste Connections (WCN-N) will release its fourth-quarter 2022 results on Wednesday, February 15, 2023, after markets close.

Canadian Tire (CTC-A-T) will release its fourth-quarter 2022 results on Thursday, February 16, 2023, before markets open.


Last week, six companies on ‘The List’, reported their earnings.

TFI International (TFII-N) released its fourth-quarter 2022 results on Monday, February 6, 2023, after markets closed

“TFI International successfully capped 2022 with strong fourth quarter results, generating slightly higher operating income on significantly improved operating margins, a 53% increase in the full-year adjusted diluted EPS and a 26% increase in the full-year free cash flow, despite macro volatility, fuel-related working capital outlays, and the sale of CFI assets last summer that served to strengthen our overall business mix and returns,” said Alain Bédard, Chairman, President and Chief Executive Officer. “As laid out at our recent Investor Day, our unique positioning includes business line diversity, exposure to attractive niche markets and numerous self-help initiatives that are producing remarkable success during turbulent economic times. Most importantly, our relative stability, margin expansion and free cash flow reflect the tireless efforts of our people, who are diligently adhering to our longstanding operating principles regardless of external factors. Capitalizing on this attractive competitive positioning and our sharp focus on the fundamentals, we continue to strategically allocate capital toward attractive acquisitions, with our acquisition pipeline remarkably strong and the majority of these closings expected in the first half of the year. During the quarter, our Board of Directors approved a 30% increase to our quarterly dividend and we continued to repurchase shares, both reflecting our favorable outlook. We enter 2023 in the best position in TFI International’s history and are eager to create additional shareholder value in the year ahead.”

 – Chief Executive Officer, Alain Bedard

Highlights:

  • Fourth quarter operating income of $216.9 million increased 1% over the prior year quarter
  • Fourth quarter net income of $153.5 million increased 6% compared to Q4 2021, while adjusted net income1 of $151.8 million increased 2%
  • Fourth quarter diluted earnings per share (diluted “EPS”) of $1.74 increased 14% compared to Q4 2021, while adjusted diluted EPS1 of $1.72 increased 10%
  • Fourth quarter net cash from operating activities grew to $248.3 million, up 30% over the prior year period and free cash flow1 grew to $188.3 million, up 56% over the prior year period
  • Full year diluted EPS of $9.02 increased from $7.91 in 2021, while adjusted diluted EPS1 of $8.02 increased from $5.23

Full-Year Results

  • Total revenue was $8.81 billion for 2022 versus $7.22 billion in 2021. Revenue before fuel surcharge of $7.36 billion was up 14% compared to the prior year.
  • Operating income totaled $1,146.0 million, or 16% of revenue before fuel surcharge, an increase of 17% compared to $979.2 million and 15% of revenue before fuel surcharge in the prior year. The increase is mainly attributable to the contributions from acquisitions, including a gain on sale of business of $73.7 million.
  • Net income was $823.2 million, or $9.02 per diluted share, compared to $754.4 million, or $7.91 per diluted share a year earlier. Adjusted net income and Adjusted diluted EPS, non-IFRS measures, were $731.7 million, or $8.02 per diluted share, compared to $498.3 million, or $5.23 per diluted share the prior year.
  • During 2022, total revenue grew 1% for Package and Courier, 43% for Less-Than-Truckload, 13% for Truckload and 6% for Logistics relative to the prior year. Operating income was up 24% for Package and Courier, 59% for Truckload, down 18% for Less-ThanTruckload, mainly due to the inclusion of the bargain purchase gain in 2021, and down 2% for Logistics.

Outlook:

“We’re holding firm on our profitability,” Bedard commented. “I think that, overall, if you look at 2023, I think 2023 will do better than we did in 2022 overall in terms of dollars of OE for the logistics.”

Given the savings, Bedard entertained some M&A possibilities, talking particularly positively about ArcBest Corporation (NASDAQ:ARCB), a logistics name in which the company currently holds a small stake.

See the full Earnings Release here


Intact Financial (IFC-T) released its fourth-quarter 2022 results on Tuesday, February 7, 2023, after markets closed.

“The resilience of our platform was again evident in 2022 with a mid-teens ROE despite elevated catastrophe losses and inflation pressures. At the same time, we made significant progress on the RSA integration, which contributed 16% to net operating income per share for the full year and drove 23% growth in premiums. With the business operating at a low 90s combined ratio, positive top line momentum across all segments and a strong balance sheet, we are well positioned to deliver on our financial and strategic objectives in the year ahead. We are therefore pleased to increase dividends to common shareholders for the eighteenth consecutive year.”

– Charles Brindamour,, Chief Executive Officer

Highlights:

  • Operating DPW growth accelerated to 3% in the quarter, and 5% excluding strategic exits, on favourable market conditions
  • Operating combined ratio was a solid 91.5% in Q4-2022 and 91.6% for the full year despite elevated catastrophe losses and inflation
  • Net operating income per share of $3.34 in the quarter and $11.88 for the full year reflected higher investment and distribution income, which partially offset lower underwriting margins
  • EPS decreased to $2.26 in Q4-2022, but was up 9% for the full year on higher operating income and investment gains
  • OROE of 14.3% and ROE of 16.5% reflected strong operating performance in a challenging environment
  • Balance sheet remained strong with a total capital margin of $2.4 billion and BVPS of $80.33 despite capital markets volatility
  • Quarterly dividend increased by 10% to $1.10 per common share

Outlook:

Over the next twelve months, we expect firm-to-hard insurance market conditions to continue in most lines of business, driven by inflation, natural disasters, and a hard reinsurance market.

In Canada, we expect firm market conditions to continue in personal property. Personal auto premiums are expected to grow by mid single digits in response to inflation and evolving driving patterns.

In commercial and specialty lines across all geographies, hard market conditions are expected to continue.

In the UK&I, we expect the personal property market to firm as it reacts to inflationary pressures, natural disasters and a hard reinsurance market. Personal motor has begun to firm and we anticipate this to increase over time.

See the full Earnings Release here


Telus (T-T) released its fourth-quarter 2022 results on Thursday, February 9, 2023, before markets opened.

“Throughout 2022, TELUS achieved strong operational and financial results across our business, including leading our North American peer group with respect to 2022 Operating Revenues, Adjusted EBITDA and Free Cash Flow growth,” said Darren Entwistle, President and CEO. “This is a trend the TELUS team has consistently demonstrated over the long-term. Our robust performance in the fourth quarter, and for the full year, reflects the chemistry of our globally leading broadband networks and customers first culture, driving our hallmark combination of profitable customer growth, alongside strong financial results. Industry-leading net additions of 301,000 represented our best fourth quarter on record, and concluded another year of industry-leading expansion of our customer base. Indeed, in 2022, we delivered an all-time record, surpassing total annual net additions of more than one million for the first time, including another best-ever year for Fixed subscriber growth of 274,000, and delivered our highest Mobile Phone net additions since 2010 with 401,000 net new customers. This industry-leading growth reflects the consistent potency of our operational execution, unmatched bundled product offerings across Mobile and Home, and team member culture focused on delivering exceptional customer experiences over our globally-leading PureFibre and 5G networks. Our team’s passion for delivering customer experience excellence, once again contributed to strong client loyalty across our key product lines, including blended Mobile Phone, PureFibre internet, Optik TV, Security and Voice churn all below one per cent for the year. Furthermore, 2022 represented our ninth consecutive year of industry-leading postpaid wireless churn below one per cent.”

– Darren Entwistle, Chief Executive Officer

Highlights:

  • Industry-leading total Mobile and Fixed customer growth of 301,000 up 29,000 over last year, and our strongest fourth quarter on record, driven by strong demand for our leading product portfolio of Mobility and Fixed Broadband services
  • Robust mobile phone net additions of 112,000 and record fourth quarter connected device net additions of 106,000; industry-leading postpaid churn of 0.96 per cent and Mobile Phone ARPU growth of 2.2 per cent
  • Best fixed customer growth on record with 83,000 net additions, including 42,000 internet customer additions, powered by leading customer loyalty in combination with TELUS’ expansive PureFibre network
  • Record high customer additions of 1,043,000 for the full year, driven by consistently potent operational execution, unmatched bundled product offerings across Mobile and Home, and team member culture focused on delivering exceptional customer experiences over globally-leading networks
  • Strong quarterly financial results leading to industry-leading full year Consolidated Operating Revenues, Adjusted EBITDA and Free Cash Flow growth of 8.6 per cent, 9.5 per cent and 64 per cent, respectively; Net income for the full year up 1.2 per cent
  • Global industry-best growth profile, underpinned by strong operating momentum across our telecom business, bolstered by TELUS International, TELUS Health and TELUS Agriculture & Consumer Goods
  • Targeting 2023 Operating Revenue and Adjusted EBITDA to increase by 11 to 14 per cent and 9.5 to 11 per cent, respectively
  • Robust Free Cash Flow growth of circa 57 per cent to approximately $2.0 billion in 2023 supports balance sheet strength and leading dividend growth programthrough2025

Outlook:

TELUS’ consolidated financial targets for 2023 are guided by a number of long-term financial objectives, policies and guidelines, which are detailed in Section 4.3 of the 2022 annual MD&A.

In 2023, TELUS plans to continue generating positive financial outcomes and strong customer growth. We expect growth in EBITDA to be driven by continued demand for data in our mobile and fixed products and services; continued roaming revenue improvement; and continued ongoing investments in our leading PureFibre network and ongoing 5G deployment. Our strategic efforts to enhance operational simplicity and efficiency, in addition to our constant focus on improving the customer experience across all areas of our operations, is also expected to contribute to our growth.

Supporting our growth profile in 2023 are our unique and diversified growth assets: TELUS International, including continued demand in the digital transformation ecosystem and the acceleration of digital adoption across various sectors of the global economy as well as the acquisition of WillowTree; TELUS Health, including growing demand for our expanding portfolio of digital health services and applications as well as the acquisition of LifeWorks; and TELUS Agriculture & Consumer Goods, which is using technology to drive better food outcomes across the agriculture value chain. Our growth profile is also underpinned by a team member culture focused on delivering customer service excellence and our ongoing focus on operational effectiveness.

See the full Earnings Release here


Enbridge Inc. (ENB-T) released its fourth-quarter 2022 results on Friday, February 10, 2023, before markets opened.

“We ended the year with strong utilization, operational and safety performance across our business. Despite the uncertainty and volatility of 2022, our full year results came in at the top half of our guidance range, reflecting the strength of our four core businesses and the resiliency of our low-risk business model.

We made substantial progress delivering on our strategic priorities, which is a testament to the entire Enbridge team. We placed another $4 billion of capital into service and sanctioned $8 billion of new organic growth. We sold non-core assets, demonstrating our commitment to recycling capital at attractive valuations, and our balance sheet continues to be in great shape, with Debt to EBITDA in the bottom half of our range at 4.7x. These actions have set us up well for 2023 and beyond.

As we look forward, it is clear the world needs all forms of energy to meet demand. At the same time, there is a global imperative to reduce emissions. Balancing these priorities is critical and remains foundational to our strategy.

We will continue to expand, modernize and reduce emissions from our conventional business to meet our customers’ needs, and increase investments in lower-carbon opportunities that complement our existing assets. Our balance sheet strength, disciplined approach to capital allocation, and proven execution capability will enable us to drive growth and create value for our shareholders. Our extensive footprint puts us in an enviable position to deliver safe, secure, affordable and sustainable energy to our customers.”

– Greg Ebel, President and Chief Executive Officer

Highlights:

  • GAAP Earnings attributable to common shareholders for the fourth quarter of 2022 decreased by $2.9 billion or $1.44 per share compared with the same period in 2021 and includes certain infrequent or other non-operating factors, primarily explained by a non-cash goodwill impairment of $2.5 billion relating to the Gas Transmission reporting unit as a result of the increased cost of capital, partially offset by the operating performance factors discussed in detail below.
  • On a full year basis for 2022, GAAP earnings attributable to common shareholders was negatively impacted by the goodwill impairment discussed above, as well as non-cash, net unrealized derivative fair value losses of $1.3 billion ($964 million after-tax) in 2022, compared with unrealized gains of $197 million ($150 million after-tax) in 2021, reflecting changes in the mark-to-market value of derivative financial instruments used to manage foreign exchange risks. These were partially offset by a non-cash gain of $1.1 billion ($732 million after-tax) on the closing of the joint venture merger transaction with Phillips 66 (P66) realigning our effective economic interests in Gray Oak and DCP Midstream LLC.
  • The period-over-period comparability of GAAP earnings attributable to common shareholders is impacted by certain other unusual, infrequent factors or other non-operating factors which are noted in the reconciliation schedule included in Appendix A of this news release. Refer to the annual Management’s Discussion & Analysis for 2022 filed in conjunction with the year-end financial statements for a detailed discussion of GAAP financial results.
  • Adjusted EBITDA in the fourth quarter of 2022 increased by $224 million compared with the same period in 2021. This was primarily driven by higher contributions from new assets placed into service including the U.S. portion of the Line 3 Replacement Project, which came into service in the fourth quarter of 2021, the acquisition of Enbridge Ingleside Energy Center (EIEC), as well as the recognition of revenues from increased rates on TETLP as a result of its recent rate case settlement. The translation of U.S. denominated earnings also contributed to higher EBITDA in the period. The average CAD to USD exchange rate for the fourth quarter of 2022 was $1.36 compared with $1.26 for the same period in 2021.
  • Adjusted EBITDA for the year ended December 31, 2022 increased by $1.5 billion compared with 2021. This is primarily driven by the impact of the operating factors listed above, as well as translation of S dollar denominated earnings. The average CAD to USD exchange rate in 2022 was $1.30 compared with $1.25 in 2021.
  • Adjusted earnings in the fourth quarter of 2022 decreased by $105 million, or $0.05 per share, primarily due to higher financing costs from rising interest rates on floating-rate debt, and increased depreciation expense on new assets placed into service in the fourth quarter of 2021; partially offset by higher Adjusted EBITDA contributions.
  • Adjusted earnings for the year ended December 31, 2022 increased by $141 million compared with 2021. This is primarily driven by the impact of higher Adjusted EBITDA, partially offset by the higher financing costs discussed above.
  • DCF for the fourth quarter of 2022 increased by $176 million, or $0.08 per share, primarily due to higher Adjusted EBITDA contributions and higher equity distributions as a result of strong operating performance from joint venture investments including Alliance Pipeline, as well as increased economic interest in the Gray Oak and Cactus II pipelines, partially offset by higher maintenance capital spend, higher financing costs and higher cash taxes on higher taxable earnings.
  • DCF for the year ended December 31, 2022, increased by $942 million compared with 2021. This is primarily driven by the same operating factors as listed above.

Outlook:

The Company reaffirmed its 2023 financial guidance, which includes adjusted EBITDA between $15.9 billion and $16.5 billion and DCF per share between $5.25 to $5.65.

Growth in 2023 is anticipated to be driven by strong Mainline utilization, full-year contributions from the TETLP rate settlement, rate escalators and customer additions at EGI, full-year contributions from projects placed into service during 2022 and the impact of foreign exchange rates, partially offset by higher financing costs and distributions to non-controlling interests from the sale of an interest in certain Regional Oil Sands assets.

See the full Earnings Release here


Fortis (FTS-T) released its fourth-quarter 2022 results on Friday, February 10, 2023, before markets opened.

“2022 was a year of execution with strong financial, operational and sustainability results across our utilities,” said David Hutchens, President and Chief Executive Officer, Fortis Inc. “We invested over $4 billion in capital, delivered strong EPS and rate base growth, and further reduced our carbon emissions. We also outperformed safety and reliability industry averages and were recognized as a leader in Canada for our governance practices.

With a focus on organic growth, we also announced our largest five-year capital plan of $22.3 billion representing steady rate base growth of 6% and supporting annual dividend growth guidance of 4-6% through 2027,” said Mr. Hutchens. “We appreciate the dedication and hard work of our people to make 2022 another successful year.”

– David Hutchens, President and Chief Executive Officer

Highlights:

  • Reported net earnings of $1.3 billion, or $2.78 per common share in 2022
  • Adjusted net earnings per common share of $2.78, up from $2.59 in 2021, representing ~7% annual EPS growth
  • Capital expenditures of $4.0 billion, with over $600 million focused on delivering cleaner energy, yielding ~7% rate base growth
  • Scope 1 emissions 28% below 2019 levels; 75% emissions reduction by 2035 target on track in support of 2050 net-zero goal
  • Capital structure complaint filed against ITC Midwest denied by FERC

Outlook:

Fortis continues to enhance shareholder value through the execution of its capital plan, the balance and strength of its diversified portfolio of regulated utility businesses, and growth opportunities within and proximate to its service territories. While energy price volatility, global supply chain constraints and persistent inflation are issues of potential concern that continue to evolve, the Corporation does not currently expect there to be a material impact on its operations or financial results in 2023.

The Corporation’s $22.3 billion five-year capital plan is expected to increase midyear rate base from $34.1 billion in 2022 to $46.1 billion by 2027, translating into a five-year compound annual growth rate of 6.2%3.

Beyond the five-year capital plan, additional opportunities to expand and extend growth include: further expansion of the electric transmission grid in the U.S. to facilitate the interconnection of cleaner energy, including infrastructure investments associated with the Inflation Reduction Act of 2022 and the MISO LRTP; climate adaptation and grid resiliency investments; renewable gas solutions and liquefied natural gas infrastructure in British Columbia; and the acceleration of cleaner energy infrastructure investments across our jurisdictions.

Fortis expects its long-term growth in rate base will drive earnings that support dividend growth guidance of 4-6% annually through 2027. This dividend growth guidance will also provide flexibility to fund more capital with internally-generated funds and is premised on the assumptions and material factors listed under “Forward-Looking Information”. 

See the full Earnings Release here


Magna (MGA-N) released its fourth-quarter 2022 results on Friday, February 10, 2023, before markets opened.

“2022 was another difficult year for the auto industry as inflation climbed to levels not experienced for decades, geopolitical issues contributed to unprecedented European energy prices and OEM production schedules remained volatile. Nevertheless, we once again generated above-market sales growth, and booked a record amount of business.

In 2023, we are highly focused on improving underperforming operations, limiting discretionary costs and securing further inflation recoveries from our customers. At the same time, we continue to invest to support the significant amount of business growth in front of us.”

– Swamy Kotagiri, Chief Executive Officer

Highlights:

  • Sales increased 5% to $9.6 billion
  • Excluding foreign currency translation sales increased 13%, compared to a global light vehicle production increase of 5%
  • Diluted earnings per share and Adjusted diluted earnings per share decreased to $0.33 and $0.91, respectively, compared to $1.54 and $1.30 last year
  • Returned $131 million to shareholders through dividends and share repurchases
  • Raised quarterly cash dividend to $0.46 per share

Outlook:

2023 Outlook Highlights

  • Sales expected to continue to outgrow global light vehicle production through outlook period
  • Expect Adjusted EBIT Margin to expand by 230 basis points or more by 2025

Below is a snapshot of ‘The List’ from last Friday’s close. For a sortable version of ‘The List’, please click on The List menu item.

‘The List’ is not intended to be a portfolio others replicate. Rather, its purpose is to provide investment ideas and a real-time illustration of dividend growth investing in action. It is not a ‘Buy List’ nor reflects the composition or returns of our Magic Pants Wealth-Builder (CDN) Portfolios. It is only a starting point for our analysis and discussion of dividend growth investing concepts.


The List (2023)
Last updated by BM on February 10, 2023

*Note: The following graph is wide, you can scroll to the right on your device to see more of the data.

SYMBOL COMPANY YLD PRICE YTD % DIV YTD % STREAK
AQN-N Algonquin Power & Utilities 6.8% $7.43 10.4% $0.51 -29.0% 12
ATD-T Alimentation Couche-Tard Inc. 0.9% $62.56 4.0% $0.56 19.1% 13
BCE-T Bell Canada 6.3% $60.82 1.0% $3.82 5.0% 14
BIP-N Brookfield Infrastructure Partners 4.4% $32.95 5.2% $1.44 6.3% 15
CCL-B-T CCL Industries 1.5% $62.67 8.0% $0.96 0.0% 21
CNR-T Canadian National Railway 2.0% $159.90 -1.8% $3.16 7.8% 27
CTC-A-T Canadian Tire 4.3% $160.19 9.3% $6.90 17.9% 12
CU-T Canadian Utilities Limited 4.9% $36.43 -1.4% $1.78 0.0% 51
DOL-T Dollarama Inc. 0.3% $78.91 -1.2% $0.22 2.3% 12
EMA-T Emera 5.1% $54.02 2.7% $2.76 3.0% 16
ENB-T Enbridge Inc. 6.6% $54.15 1.5% $3.55 3.2% 27
ENGH-T Enghouse Systems Limited 1.8% $41.76 16.9% $0.74 3.5% 16
FNV-N Franco Nevada 1.0% $136.00 -1.6% $1.36 6.3% 15
FTS-T Fortis 4.1% $55.39 0.1% $2.26 4.1% 49
IFC-T Intact Financial 2.2% $197.04 0.6% $4.40 10.0% 18
L-T Loblaws 1.4% $117.11 -2.7% $1.62 5.2% 11
MGA-N Magna 3.4% $54.14 -5.9% $1.84 2.2% 13
MRU-T Metro 1.7% $70.84 -6.1% $1.21 10.0% 28
RY-T Royal Bank of Canada 3.8% $138.76 8.4% $5.28 6.5% 12
SJ-T Stella-Jones Inc. 1.6% $48.62 -1.9% $0.80 0.0% 18
STN-T Stantec Inc. 1.0% $70.81 8.4% $0.72 2.1% 11
TD-T TD Bank 4.1% $93.01 6.1% $3.84 7.9% 12
TFII-N TFI International 1.1% $124.90 24.7% $1.40 29.6% 12
TIH-T Toromont Industries 1.4% $107.71 10.2% $1.56 2.6% 33
TRP-T TC Energy Corp. 6.5% $55.47 4.1% $3.60 0.8% 22
T-T Telus 5.2% $27.25 3.5% $1.40 5.4% 19
WCN-N Waste Connections 0.8% $135.32 2.7% $1.02 7.9% 13
Averages 3.1% 3.9% 5.2% 19

MP Market Review – February 03, 2023

Last updated by BM on February 06, 2023

Summary

  • This article is part of our weekly series (MP Market Review) highlighting the performance and activity from the previous week related to the financial markets and Canadian dividend growth companies we follow on ‘The List’.
  • Last week, ‘The List’ was up slightly with a +4.6% YTD price return (capital). Dividend growth of ‘The List’ increased to +4.7% YTD, demonstrating the rise in income over the last year.  
  • Last week, there were two dividend increases from companies on ‘The List’.
  • Last week, there were two earnings reports from companies on ‘The List’.
  • Six companies on ‘The List’ are due to report earnings this week.
  • Are you looking to build an income portfolio of your own? When you become a premium subscriber, you get exclusive access to the MP Wealth-Builder Model Portfolio (CDN) and subscriber-only content.  Learn More

“Wide diversification is only required when investors do not understand what they are doing …. Diversification may preserve wealth, but concentration builds wealth.”

– Warren Buffett

Q4 2022 earnings reporting is now underway. Be sure to check out our earnings calendar at the bottom of ‘The List’ page to see which companies beat or missed estimates.

“Diworsification” is a word coined by legendary investor Peter Lynch. It refers to owning an excessive number of stock positions for the sake of diversification.

When we were looking at comparables for our Magic Pants Wealth-Builder Portfolios we not only had a difficult time finding 100% Canadian products but also ones that were properly diversified. The Canadian market is heavily weighted with dividend-paying companies in only two sectors, Energy and Financials. Most indexes and mutual funds consisting of only Canadian stocks have between 40-50% of their portfolios invested in these two sectors alone. Because your options for quality dividend growth companies (< 50) are limited in Canada, we are careful not to overweight in any one sector when we build “The List’ and our portfolios.

We also found that almost all dividend ETFs and mutual funds contained well over one hundred companies in their portfolio. With each security added, their portfolios do become more diversified. However, each additional security diversifies its portfolios to a lesser degree than the last one. Eventually, the benefit of each new security added is more and more muted to the point of being immaterial.

While some diversification is prudent, investors should remember to focus on owning the best businesses with the largest potential returns within their risk tolerance and investment style. Be careful not to diversify just for the sake of it. Many studies show that risk is not mitigated by owning more companies.

Safety is in quality not in numbers.

Performance of ‘The List’

At the end of the post is a snapshot of ‘The List’ from last Friday’s close. Feel free to click on the ‘The List’ menu item above for a sortable version.

Last week, ‘The List’ was up slightly with a +4.6% YTD price return (capital). Dividend growth of ‘The List’ increased to +4.7% YTD, demonstrating the rise in income over the last year.

The best performers last week on ‘The List’ were TFI International (TFII-T), up +8.93%; Stella-Jones Inc. (SJ-T), up +4.57%; and Magna (MGA-N), up +4.57%.

Loblaws (L-T) was the worst performer last week, down -4.75%.

Recent News

How to beat the pros, Part 1: Choose the right number of stocks to hold (Globe & Mail)

https://www.theglobeandmail.com/investing/education/article-how-to-beat-the-pros-part-1-choose-the-right-number-of-stocks-to-hold/

“A professional portfolio manager allocating billions cannot own just 15-25 positions – the career risk in underperforming an index is too great of a force. But the small retail investor can stick to that limited number of stock holdings.”

If you ever wondered why you had never heard of dividend growth investing before, you know now. Financial advisors are hesitant to recommend this equities-only strategy for fear of losing their jobs! One losing quarter or two when others do not, and their career is in jeopardy. Professional money managers can’t afford to lose alone. They keep their jobs when they underperform in the market as long as they all do. They have done a pretty good job at this over the years.

A lot of good advice in this article.

  • Own a concentrated portfolio of 15-25 positions
  • Own quality
  • Invest for the long term


Estimated cost of Coastal GasLink pipeline surges to $14.5-billion (Globe & Mail)

https://www.theglobeandmail.com/business/article-coastal-gaslink-pipeline-cost/

“The market remains concerned regarding additional cost overruns on the project,” Scotia Capital Inc. analyst Robert Hope said in a research note. Given the uncertainty over the final cost and timing for construction completion, he added that the “project isn’t out of the woods yet.”

TC Energy (TRP-T) is one of our high-quality dividend growers from ‘The List’. Operational issues recently and now cost overruns are cause for some concern. The company announces Q4 2022 earnings next week so we hope to have more clarification then on how they plan to deal with the cost increases. For now, we are monitoring this situation closely.

Dividend Increases

Last week, there were two dividend increases from companies on ‘The List’.

Brookfield Infrastructure Partners (BIP-N) on Thursday, February 02, 2023, said it increased its 2023 quarterly dividend from $0.36 to $0.3825 per share, payable March 31, 2023, to shareholders of record on February 28, 2023.

This represents a dividend increase of +6.25%, marking the 16th straight year of dividend growth for this global infrastructure operator.

Bell Canada (BCE-T) on Thursday, February 02, 2023, said it increased its 2023 quarterly dividend from $0.92 to $0.9675 per share, payable April 17, 2023, to shareholders of record on March 15, 2023.

This represents a dividend increase of +5.2%, marking the 16th straight year of dividend growth for this quality telecom.

Earnings Releases

Six companies on ‘The List’ are due to report earnings this week.  

TFI International (TFII-N) will release its fourth-quarter 2022 results on Monday, February 6, 2023, after markets close.

Intact Financial (IFC-T) will release its fourth-quarter 2022 results on Tuesday, February 7, 2023, after markets close.

Telus (T-T) will release its fourth-quarter 2022 results on Thursday, February 9, 2023, before markets open.

Enbridge Inc. (ENB-T) will release its fourth-quarter 2022 results on Friday, February 10, 2023, before markets open.

Fortis (FTS-T) will release its fourth-quarter 2022 results on Friday, February 10, 2023, before markets open.

Magna (MGA-N) will release its fourth-quarter 2022 results on Friday, February 10, 2023, before markets open.

Last week, two companies on ‘The List’, reported their earnings.

Brookfield Infrastructure Partners (BIP-N) released its fourth-quarter 2022 results on Thursday, February 2, 2023, before markets opened.

“2022 was another successful year for Brookfield Infrastructure. We achieved organic growth exceeding our target range, recorded our highest quarterly FFO per unit, secured outsized capital deployment and replenished our capital backlog. We begin this year in a strong position to capitalize on attractive new investment opportunities amidst market uncertainty.”

 – Chief Executive Officer, Sam Pollock

Highlights:

  • The utilities segment generated FFO of $739 million, compared to $705 million in the prior year, an increase of 5%. This growth reflects an average inflation indexation of 8% that positively impacted almost our entire asset base, and the contribution associated with $485 million of capital commissioned into our rate base. Results also improved from the contribution of two recently completed Australian utility acquisitions. Partially offsetting these results were the impact of higher borrowing costs at our Brazilian utilities because of higher interest rates and incremental debt, as well as the sale of our North American district energy platform completed during 2021.
  • FFO for the transport segment was $794 million, compared to $701 million in the prior year, an increase of 13%. Results primarily benefited from inflationary tariff increases across all our businesses, higher volumes supported by strong economic activity surrounding our networks, and the commissioning of approximately $400 million in capital expansion projects during the year. Prior year results included a full contribution from our North American container terminal that we sold in June.
  • FFO for the midstream segment totaled $743 million, compared to $492 million in the previous year. This step-change is a function of the acquisition of our diversified Canadian midstream operation that we completed in the fourth quarter of 2021. Results for the base businesses improved due to elevated commodity prices, which led to increased utilization and higher market sensitive revenues.
  • The data segment generated FFO of $239 million, consistent with the prior year. Our underlying data businesses performed well as they continue to benefit from increasing customer utilization and network densification requirements. Growth was driven by additional points-of-presence and inflationary tariff escalators across our portfolio. These positive effects were partially offset by the impact of foreign exchange on our euro and Indian rupee denominated cash flows.

Outlook:

There are many views on what lies ahead for the economy. The optimist could argue that inflation has peaked and will come back within the target range by the end of this year, implying fiscal policy to date has been effective. The skeptic might be of the view that a tight labor market and continued wage pressures will make inflation tougher to abate in 2023 and that central banks will continue to raise interest rates higher than currently projected.

While we lean toward a more optimistic view of the year ahead, we expect market volatility to persist until the direction of interest rates is settled. Brookfield Infrastructure as a highly contracted, inflation protected, and well financed infrastructure company, should perform well in either scenario.

With the recent closings of HomeServe and DFMG, the ramp up of the Heartland facility over the next several quarters and elevated inflation levels, visibility into cash flow growth has rarely been stronger. This growth should be sustainable over the longer term, given our large capital backlog of organic projects and our proven ability to grow the business through accretive new investments. Favorable sector trends, which have been the catalyst for our recent acquisition activity, continue to support our investment pipeline.

The infrastructure super-cycle is creating long-term investment opportunities that will require trillions of dollars. This is creating large-scale opportunities for well capitalized players that can invest in growing operating platforms or be a partner of choice for government and corporate entities that have less access to the capital markets.

See the full Earnings Release here


Bell Canada (BCE-T) released its fourth-quarter 2022 results on Thursday, February 2, 2023, before markets opened.

“We capped off 2022 with another quarter of consistent and disciplined execution that drove a strong 3.7% increase in total revenue in Q4. We also delivered positive adjusted EBITDA growth, despite unprecedented cost pressures from inflation and record storms, an expensive and highly competitive Black Friday, and media advertising softness, which is a testament to our ability to execute under any condition.”

– Glen LeBlanc, Chief Financial Officer of BCE

Highlights:

  • Robust Q4 broadband customer growth with 330,743 total net activations — 122,621 postpaid and prepaid mobile phone, 104,447 mobile connected devices, 63,466 retail Internet and 40,209 IPTV — up 46.6%
  • 7% higher BCE revenue delivered positive adjusted EBITDA1 growth in Q4 despite $26 million in storm and inflationary cost pressures2 , increased promotional offer intensity and higher media programming costs
  • Q4 net earnings of $567 million, down 13.8%, with net earnings attributable to common shareholders of $528 million, or $0.58 per common share, down 15.9%; adjusted net earnings1 of $654 million generated adjusted EPS1 of $0.71, down 6.6%
  • Cash flows from operating activities up 18.0% in Q4 to $2,056 million, driving free cash flow1 growth of 64.2% to $376 million
  • Strong Q4 wireless operating results: revenue up 7.7%; 4.1% adjusted EBITDA growth; 41.2% higher mobile phone postpaid net activations of 154,617 as 5G coverage expands to 82% of Canadians
  • Record 854,000 new direct fibre connections in 2022 fuelled highest retail Internet net activations in 16 years of 201,762, up 32.5%, driving 8% higher residential Internet revenue; 80% of planned broadband Internet buildout program3 now completed
  • Bell Media digital revenue4 up 46% in Q4 contributing to 4.7% higher media revenue as advertising revenue grew 3.8%
  • All 2022 financial guidance targets achieved

Outlook:

The table below provides our 2023 financial guidance targets. These ranges are based on our current outlook for 2023, as well as our 2022 consolidated financial results that reflected the impact on adjusted EBITDA from inflationary pressures on fuel, utility and labour costs, as well as storm-related recovery costs, and the impact on free cash flow from historic capital expenditures to accelerate the rollout of Bell’s wireline fibre and wireless 5G networks. For 2023, we expect lower tax adjustments, higher depreciation and amortization expense and increased interest expense to drive lower adjusted EPS compared to 2022. For 2023, we expect growth in adjusted EBITDA, a reduction in contributions to post-employment benefit plans and payments under other post-employment benefit plans, and lower capital expenditures will drive higher free cash flow.

Below is a snapshot of ‘The List’ from last Friday’s close. For a sortable version of ‘The List’, please click on The List menu item.

‘The List’ is not intended to be a portfolio others replicate. Rather, its purpose is to provide investment ideas and a real-time illustration of dividend growth investing in action. It is not a ‘Buy List’ nor reflects the composition or returns of our Magic Pants Wealth-Builder (CDN) Portfolios. It is only a starting point for our analysis and discussion of dividend growth investing concepts.


The List (2023)
Last updated by BM on February 03, 2023

*Note: The following graph is wide, you can scroll to the right on your device to see more of the data.

SYMBOL COMPANY YLD PRICE YTD % DIV YTD % STREAK
AQN-N Algonquin Power & Utilities 6.9% $7.36 9.4% $0.51 -29.0% 12
ATD-T Alimentation Couche-Tard Inc. 0.9% $60.33 0.3% $0.56 19.1% 13
BCE-T Bell Canada 6.2% $61.77 2.6% $3.82 5.0% 14
BIP-N Brookfield Infrastructure Partners 4.4% $32.95 5.2% $1.44 6.3% 15
CCL-B-T CCL Industries 1.5% $62.85 8.3% $0.96 0.0% 21
CNR-T Canadian National Railway 2.0% $160.66 -1.4% $3.16 7.8% 27
CTC-A-T Canadian Tire 4.2% $165.21 12.7% $6.90 17.9% 12
CU-T Canadian Utilities Limited 4.9% $36.21 -2.0% $1.78 0.0% 51
DOL-T Dollarama Inc. 0.3% $79.25 -0.8% $0.22 2.3% 12
EMA-T Emera 5.1% $54.10 2.8% $2.76 3.0% 16
ENB-T Enbridge Inc. 6.5% $54.38 2.0% $3.55 3.2% 27
ENGH-T Enghouse Systems Limited 1.8% $40.89 14.5% $0.74 3.5% 16
FNV-N Franco Nevada 1.0% $142.14 2.9% $1.36 6.3% 15
FTS-T Fortis 4.1% $55.07 -0.5% $2.26 4.1% 49
IFC-T Intact Financial 2.1% $195.08 -0.4% $4.00 0.0% 18
L-T Loblaws 1.4% $115.24 -4.2% $1.62 5.2% 11
MGA-N Magna 2.7% $66.81 16.2% $1.80 0.0% 13
MRU-T Metro 1.7% $70.00 -7.3% $1.21 10.0% 28
RY-T Royal Bank of Canada 3.8% $138.15 7.9% $5.28 6.5% 12
SJ-T Stella-Jones Inc. 1.6% $49.64 0.1% $0.80 0.0% 18
STN-T Stantec Inc. 1.0% $71.20 9.0% $0.72 2.1% 11
TD-T TD Bank 4.2% $92.42 5.4% $3.84 7.9% 12
TFII-N TFI International 1.2% $118.89 18.7% $1.40 29.6% 12
TIH-T Toromont Industries 1.5% $106.21 8.7% $1.56 2.6% 33
TRP-T TC Energy Corp. 6.4% $56.05 5.2% $3.60 0.8% 22
T-T Telus 4.9% $28.62 8.7% $1.40 5.4% 19
WCN-N Waste Connections 0.8% $132.23 0.4% $1.02 7.9% 13
Averages 3.1% 4.6% 4.7% 19

We buy quality individual dividend growth stocks when they are sensibly priced and hold for the growing income.