“You have a pair of pants. In the left pocket, you have $100. You take $1 out of the left pocket and put in the right pocket. You now have $101. There is no diminution of dollars in your left pocket. That is one magic pair of pants.”

‘The List’ – Portfolio Review (January 2022)

Posted by BM on January 31, 2022 

Each month we walk through our valuation process using a stock on ‘The List’ that meets our minimum screen of 6.5% EPS Yld. This month is a little different as we have already reported on companies, in previous reviews, that meet this criterion and there are no new companies to add. There is however one company on ‘The List’ that is valued differently and has recently come into what we would call a ‘sensible price’ range based on its own unique historical valuation pattern. That stock is Franco Nevada Corporation (FNV-T)

Valuation is the second step in our three-step process. Buying when our quality stocks are sensibly priced will help ensure our future investment returns meet our expectations. We rely heavily on the fundamental analyzer software tool (FASTgraphs) to help us understand the fundamentals of the stocks we invest in and then read the company’s website for investor presentations and recent earnings reports to learn more.

Intro:

Franco-Nevada Corp is a precious-metals-focused royalty and investment company. The company owns a diversified portfolio of precious metals and royalty streams, which is actively managed to generate the bulk of its revenue from gold, silver, and platinum. The company does not operate mines, develop projects, or conduct exploration. Franco-Nevada’s short-term financial performance is linked to the price of commodities and the amount of production from its portfolio of producing assets. Its long-term performance is affected by the availability of exploration and development capital. The company holds a portfolio of assets, diversified by commodity, revenue type, and stage of a project, primarily located in the United States, Canada, and Australia.

Historical Graph:

FNV Historical Graph
Source: FASTgraphs

Comments:

Franco Nevada Corp. is another of our good dividend growers that trades within a narrow valuation corridor. As you can see from the Blue Line on the graph (Normal P/E) and the Black Line (Price), there is typically very little variance. Investment opportunities typically occur when the Black Line falls below the Blue Line (53.9 PE) with this quality dividend grower. The fundamentals show a company whose earnings have grown steadily over the last ten years at an annualized rate of ~12.63%.
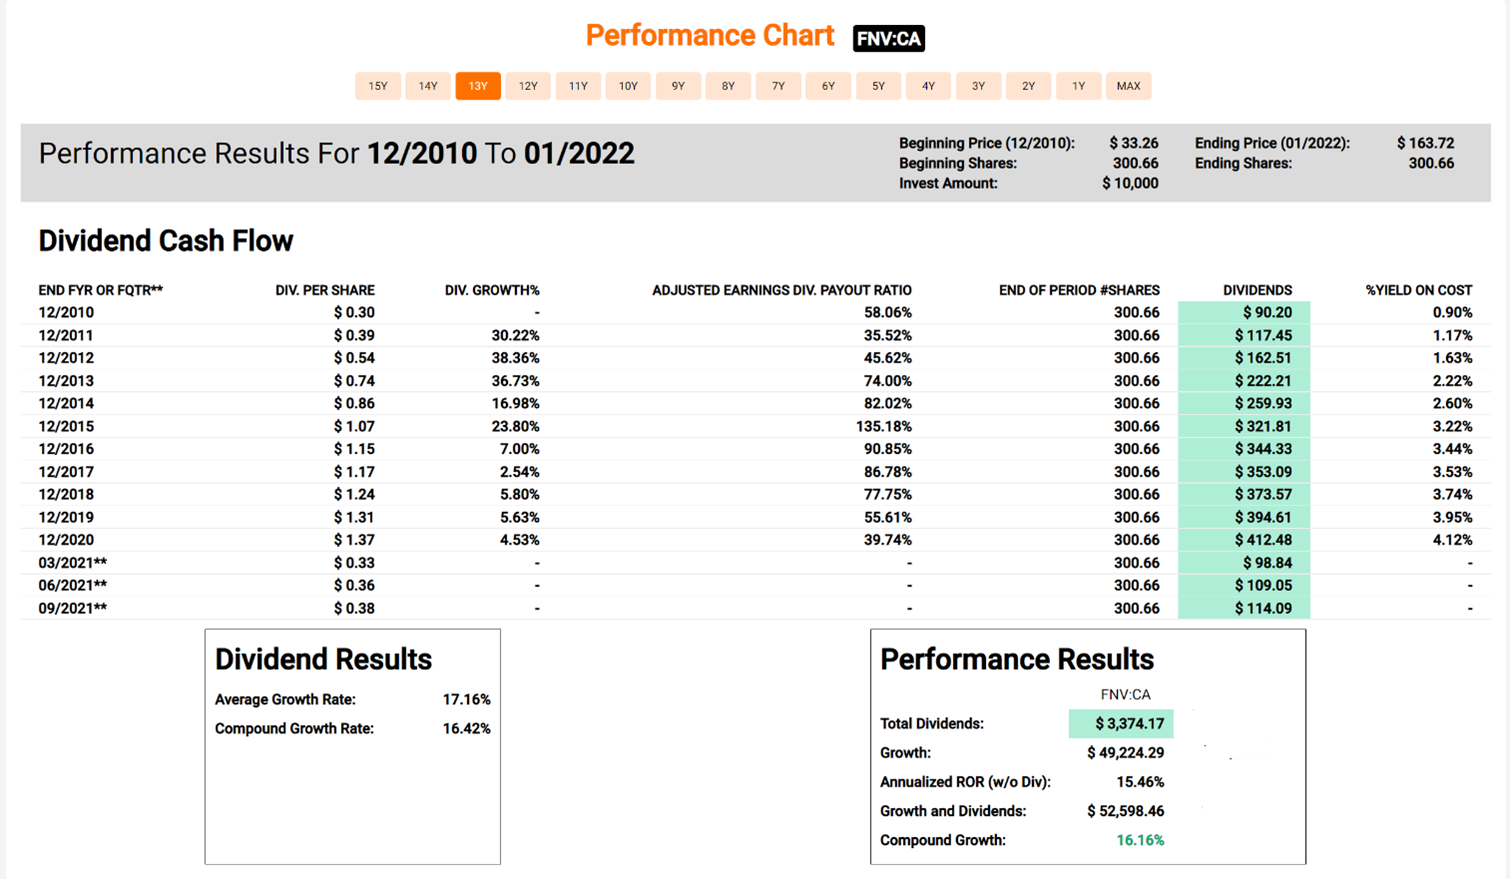
Performance Graph:

FNV Performance Graph
Source: FASTgraphs

Comments:

Franco Nevada Corp. has an annualized dividend growth rate of 16.42% over the last decade but growth has slowed over the last five years. The company also has an annualized Total Return of 16.16% over that time. FNV-T recently announced another dividend increase of 6.7% for 2022 which is more in line with the recent past.
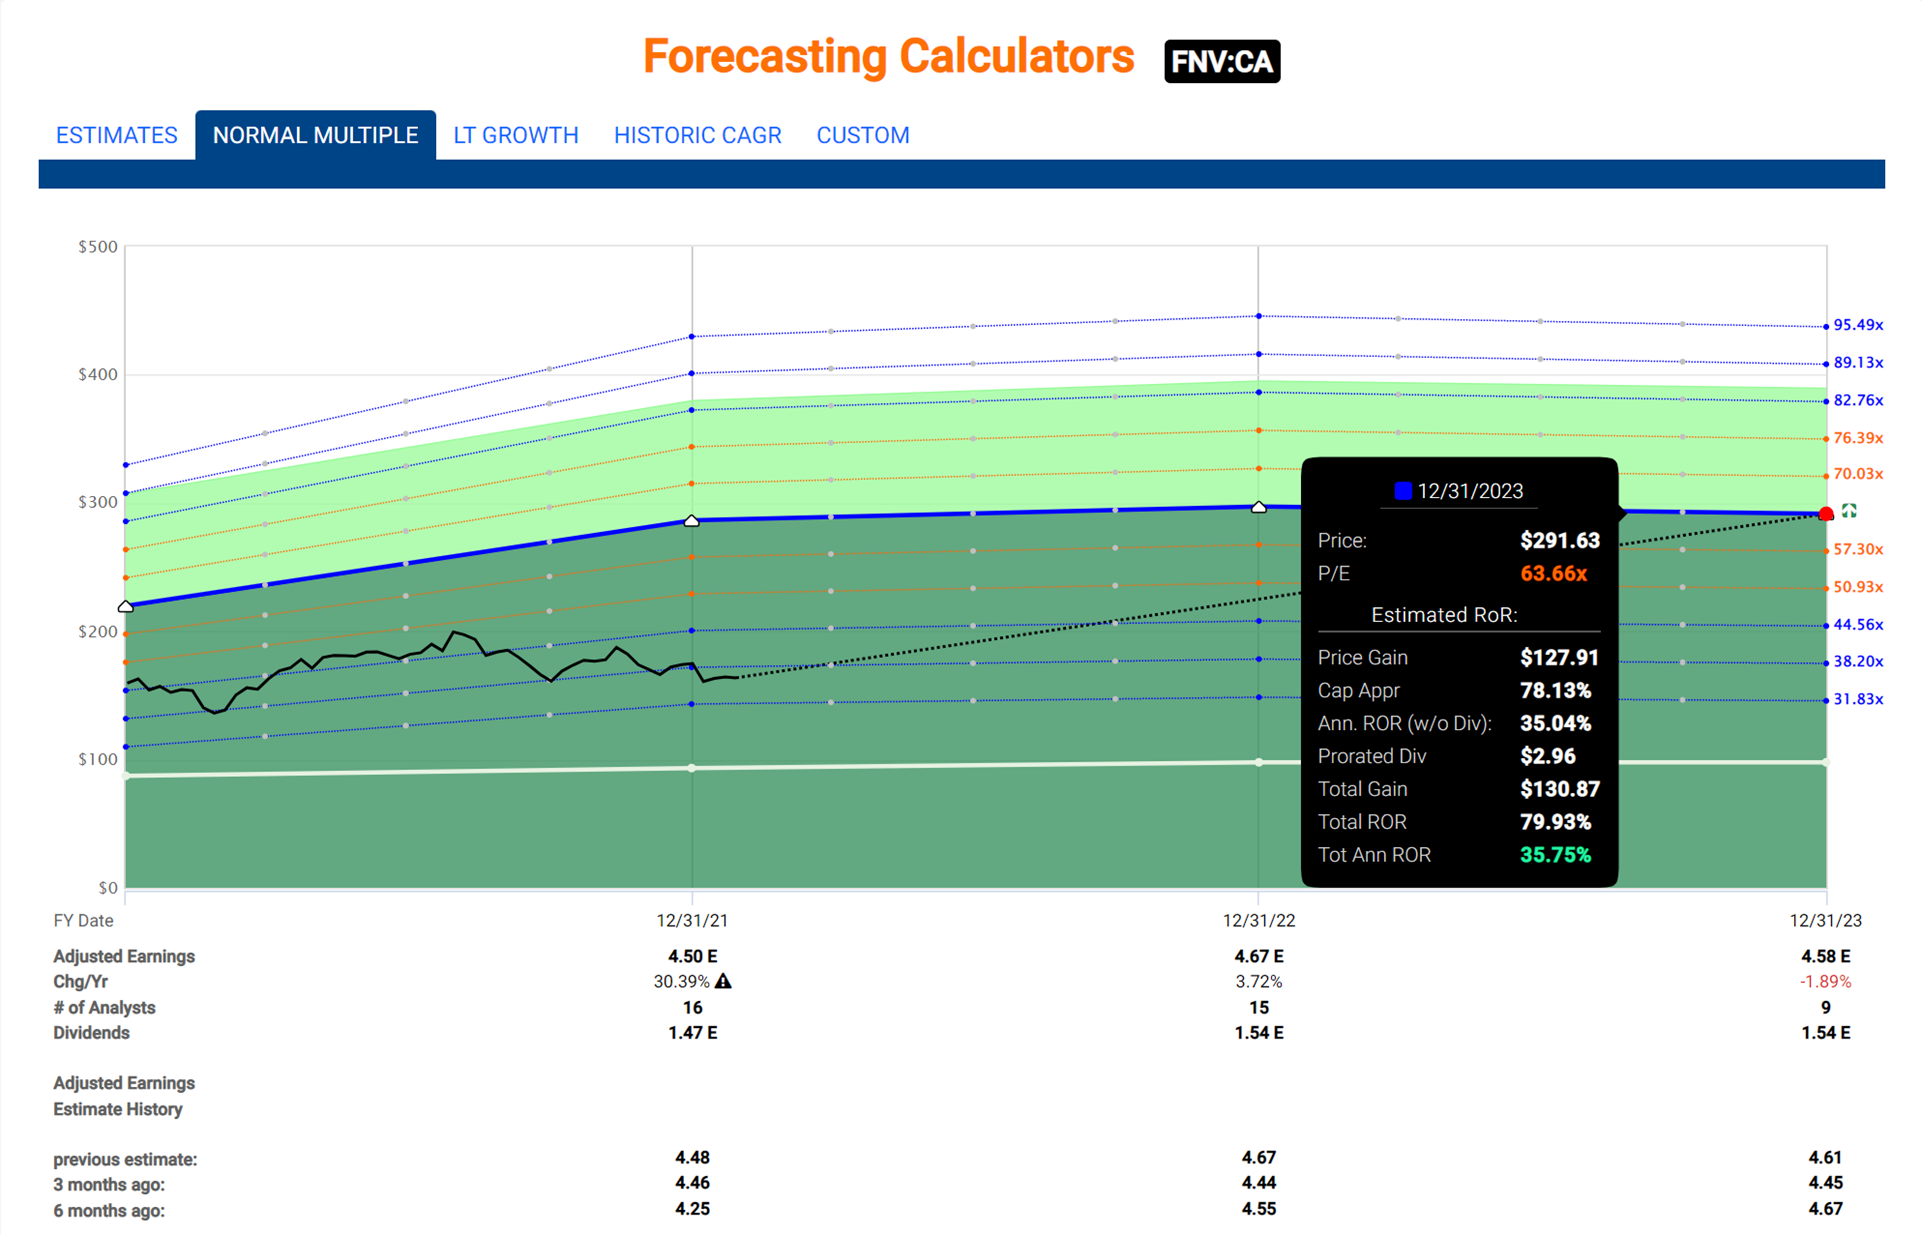
Estimated Earnings:

Source: FASTgraphs

Comments:

Using the “Normal Multiple’ estimating tool from FASTgraphs, we see a blended P/E average over the last five years of 63.66. Based on Analysts’ forecasts two years out, you can expect an annualized return of 35.75% should FNV-T trade at its five-year average blended P/E.

Blended P/E is based upon a weighted average of the most recent actual value and the closest forecast value.

Another thing I like about Franco Nevada Corp.’s earnings is that they are being revised upwards from both six months and three months ago for both 2022 and 2023. Analysts seem bullish on FNV-T in the short term.

Analyst Scorecard:

FNV Analyst Scorecard
Source: FASTgraphs

Comments:

Analyst estimates over the years are fairly accurate based on one and two-year earnings projections. Analysts’ projections have hit or beat 75% of the time on one-year estimates and 71% on two-year estimates.

Recent Earnings Report-Q3 2021:

Franco-Nevada Reports Strong Q3 Results; 2021 Energy Guidance Increased

Highlights

“Franco-Nevada delivered a strong third quarter, setting the stage for a record year in 2021. Our diversified portfolio continues to serve us well with strong contributions during the quarter from precious metals, energy and iron ore,” stated Paul Brink, President & CEO. “Higher energy prices have led us to increase our 2021 Energy guidance for the second time this year. Margins have moved higher this year due to the inflation-protected nature of our business model. Franco-Nevada is debt-free and is growing its cash balances.”

Strong Financial Position

  • No debt and $1.6 billion in available capital as of September 30, 2021
  • Generated $206.9 million in operating cash flow for the quarter
  • Quarterly dividend of $0.30/share

Sector-Leading ESG

  • Ranked #1 gold company by Sustainalytics, AA by MSCI and Prime by ISS ESG
  • Committed to the World Gold Council’s “Responsible Gold Mining Principles”
  • Partnering with our operators on community and ESG initiatives
  • Goal of 40% diverse representation at the Board and top leadership levels

Diverse, Long-Life Portfolio

  • Most diverse royalty and streaming portfolio by asset, operator, and country
  • Core assets outperforming since time of acquisition
  • Growth in long-life reserves

Growth and Optionality

  • Acquisitions, mine expansions and new mines driving growth
  • 1-million-ounce increase in Measured and Indicated Mineral Resources at Detour Lake
  • Long-term options in gold, copper and nickel
  • Noront consolidation likely to accelerate development of Ring of Fire properties

Summary:

Franco Nevada Corp. is one of only two companies in our ‘Double-Double Club’ and has been a stellar performer from a total return perspective for many years now. Although Franco Nevada is weighted heavily in the gold sector, it has been much more stable than the price of gold has been. Those of us who follow macro investing believe that gold may have its day again soon and FNV-T is an excellent way to benefit. The current yield is low at ~1% but growth is acceptable and if you believe that gold is a currency you want exposure to, then you will want to look closely at adding FNV-T to your dividend growth portfolio.

Franco Nevada Corp. appears to be sensibly priced based on historical metrics. It is well below its blended P/E at this point. Both its forecasted earnings growth and dividend growth appear to be trending along recent historical norms. Throw in a recent dividend increase (14 years and counting) and there is a lot to like about FNV-T.   

MP Market Review – January 28, 2022

Posted by BM on January 31, 2022

“We are going to be buyers of things over time. And if you’re going to be buyers of groceries over time, you like grocery prices to go down. If you’re going to be buying cars over time, you like car prices to go down. We buy businesses. We buy pieces of businesses: stocks. And we’re going to be much better off if we can buy those things at an attractive price than if we can’t.” – Warren Buffett

We received our first earnings reports from ‘The List’ in 2022 and they were good ones. Both MRU-T and CNR-T had earning beats and announced dividend increases. This will likely continue over the next quarter, and we should have a very good year for dividend growth. Dividends on ‘The List’ are already up over 6% YTD and we are only a month into the new year. Price volatility however is likely to continue as much of the general stock markets previous years capital gains will likely be eroded before finding their way again. It is comforting to know that we still get paid (dividends) regardless of what the market does in the short term. Buying and holding for the future cash flow is what we do as dividend growth investors. We are waiting and watching for good entry points to buy more of our good dividend growers at sensible prices.

Performance of ‘The List’

The best performers last week on ‘The List’ were Metro (MRU-T) up 6.1%; Loblaws (L-T) up 6.0%; Dollarama Inc. (DOL-T) up 4.5%.

Brookfield Infrastructure Partners (BIP-N) was the worst performer this week, down -3.6%.

‘The List’ was up this week 1.0% with a -1.9% YTD price return loss (capital) and an average of 6.1% in dividend increases (income) reported so far in 2022.

Dividend Increases

There were three companies on ‘The List’ that announced dividend increases this past week.

Metro Inc. (MRU-T) on Tuesday said it increased its 2022 quarterly dividend from $0.250 to $0.275 per share, payable March 7, 2022, to shareholders of record on Feb. 10, 2022.

This represents a dividend increase of 10%, marking the 27th straight year of dividend growth for this quality food retailer.

Canadian National Railway (CNR-T) on Tuesday said it increased its 2022 quarterly dividend from $0.615 to $0.7325 per share, payable March 31, 2022, to shareholders of record on Mar. 10, 2022.

This represents a dividend increase of 19%, marking the 26th straight year of dividend growth for this quality railroad.

Franco Nevada (FNV-N) on Thursday said it increased its 2022 quarterly dividend from $0.30 to $0.32 per share, payable March 31, 2022, to shareholders of record on Mar. 17, 2022.

This represents a dividend increase of 6.7%, marking the 14th straight year of dividend growth for this quality precious-metals and energy royalty company.

Earnings Releases

There were two earnings releases announced from companies on ‘The List’ this past week.

Metro Beats Estimates, Upgrades Outlook and Raises Dividend

07:38 AM EST, 01/25/2022 (MT Newswires) — Grocer Metro Inc. (MRU-T) on Tuesday reported Q1 2022 earnings and also hiked its quarterly dividend by 10%, to $0.275 per share.

The supermarket chain recorded quarterly revenue of $4.3 billion, slightly below the Capital IQ consensus mean forecast of $4.33 billion. Metro had reported $4.27 billion in revenue for the year ago period. Food same-store sales were down 1.4% versus the same quarter last year (up 10% in 2021). Online food sales were flat versus last year (up about 170% in 2021). Metro’s food basket inflation was 3.5%. Pharmacy same-store sales were up 7.7% (1.3% in 2021), with a 7.1% increase in prescription drugs due to a rise in physician visits and a 8.9% increase in front-store sales supported by OTC growth, mainly Cough & Cold products, and the lower sales last year as a result of the labour conflict at the Jean Coutu distribution center

Net earnings were $207.7 million, or $0.88 per diluted share, compared with net earnings of $191.2 million, or $0.76 per diluted share, last year.

Adjusted net earnings were $214.2 million, or $0.88 per adjusted share, beating a Capital IQ average forecast of $0.87 per share. Metro had reported adjusted earnings of $197.7 million, or $0.79 per share for the previous corresponding quarter.

Outlook

In the short term, food sales are expected to remain relatively stable as restaurant closures and work from home advisories persist. On the pharmacy side, Mretro expect sales to increase versus the prior year with launch of COVID-19 rapid test distribution in its network coupled with less restrictive government measures as 2021 was unfavorably impacted by a six-week ban on the sale of non-essential goods in Quebec. The industry continues to experience cost inflationary pressures, particularly in cost of goods, and labour shortages which have increased with the latest strain of COVID. Labour shortages are also affecting suppliers and logistics providers which in turn impact the grocery supply chain and it is difficult to predict how long this situation will last, Metro said.

CNR Appoints New CEO After Earnings Beat and Dividend Increase

04:39 PM EST, 01/25/2022 (MT Newswires) — Canadian National Railway (CNR-T) was up 2.1% in after hours New York trading after the company on Tuesday said its fourth-quarter profit rose 17% on a 2.6% rise in revenue as it boosted its dividend and put a share-buyback program in place as it announced a replacement for its retiring chief executive.

The railway said it earned C$1.2 billion, or C$1.69 per share, in the quarter, up from C$1.02 billion, or C$1.43, in the year-prior period. Adjusted profit, which excludes most one-time items, rose 18% to C$1.21 billion, or C$1.71, topping the average analyst estimate for the measure of C$1.53 per share, according to Capital IQ.

Revenue rose to C$3.75 billion from C$3.66 billion, while the railway’s adjusted operating ratio, a closely watched efficiency measure for which lower is better, fell to a record 57.9%, down 3.5 percentage points from the year-prior quarter.

“The last months of 2021 allowed us to tangibly demonstrate our resilience, our ability to make significant progress against the goals of our Strategic Plan, and what it means to build the premier railway of the 21 st century. Our previous strategic investments in safety, technology, and capacity enabled us to continue delivering high-quality service to customers while generating profitable growth and enhanced value to shareholders,” chief executive JJ Ruest said in a release.

Ruest plans to retire in response to shareholder pressure following the company’s failed bid for the Kansas City Southern Railroad, which was blocked by regulators. The railroad on Tuesday announced he will be replaced by Tracy Robinson, who is an executive vice president at TC Energy (TRP-T) and president of its Coastal GasLink pipeline unit. She had previously spent three decades working at rival Canadian Pacific Railway (CP-T). Her appointment begins on Feb.28.

“We are thrilled to have Tracy join CN as President and CEO and are confident that CN has the right team to lead it into the next phase of growth. She brings more than 35 years of operational management, strategy development, and project execution experience to drive growth and profitability,” board chair Robert Pace said in a release.

Canadian National said it plans to spend C$5 billion repurchasing as many as 42-million shares over the 12 months beginning Feb.1 through a normal-course issuer bid. It is also raising its quarterly dividend by 19%, to C$0.7325 per share, with the first higher payout coming March 31 to shareholders of record on March 10.

CN said it expects earnings per share to rise 20% in 2022 and is targeting a rise in free cash flow to C$4 billion this year from C$3.3 billion in 2021.

Recent News

South of the border the Federal Reserve held another meeting. The central bank strongly suggested that it will raise interest rates in March. The last time the Fed raised rates was more than three years ago.

We also got the Q4 GDP report, which showed that the U.S. economy had its best year for growth since 1984.

Rising rates are generally not good for the stock market especially now that growth has peaked and is slowing. The U.S. market is a lot more ‘tech heavy’, with frothy valuations, than the dividend growth stocks we follow in Canada so we don’t expect as much of a correction but there will be volatility.

Here are a couple of companies on ‘The List’ due to report earnings this week:

Brookfield Infrastructure Partners (BIP-N) is scheduled to report earnings Wednesday Feb. 02

Bell Canada (BCE-T) is scheduled to report earnings Friday Feb. 04

Below is a snapshot of ‘The List’ from last Friday’s close. For a sortable version of ‘The List’ please click on The List menu item.

‘The List’ is not meant to be a template for investors to copy exactly. Rather, its purpose is to provide investment ideas and a real-time illustration of dividend growth investing in action. It is not a ‘Buy List’, only a starting point for our analysis and discussion.

The List (2022)
Last updated by BM on January 31, 2022

*Note: The following graph is wide, you can scroll to the right on your device to see more of the data.

SYMBOL COMPANY YLD PRICE YTD % DIV YTD % STREAK
AQN-N Algonquin Power & Utilities 4.9% $13.99 -2.5% $0.68 2.3% 11
ATD-T Alimentation Couche-Tard Inc. 0.9% $49.74 -4.5% $0.44 18.1% 12
BCE-T Bell Canada 5.3% $66.44 0.8% $3.50 1.2% 13
BIP-N Brookfield Infrastructure Partners 3.5% $58.25 -4.6% $2.04 0.0% 14
CCL-B-T CCL Industries 1.3% $65.33 -3.6% $0.84 0.0% 20
CNR-T Canadian National Railway 1.9% $153.05 -1.2% $2.93 19.1% 26
CTC-A-T Canadian Tire 2.9% $178.36 -2.6% $5.20 10.6% 11
CU-T Canadian Utilities Limited 4.8% $36.39 -0.6% $1.76 0.0% 50
DOL-T Dollarama Inc. 0.3% $64.39 1.5% $0.20 1.7% 11
EMA-T Emera 4.4% $60.52 -3.3% $2.65 2.9% 15
ENB-T Enbridge Inc. 6.5% $53.00 7.0% $3.44 3.0% 26
ENGH-T Enghouse Systems Limited 1.5% $43.00 -6.2% $0.64 4.1% 15
FNV-N Franco Nevada 1.0% $128.34 -5.7% $1.28 10.3% 14
FTS-T Fortis 3.6% $59.80 -1.1% $2.14 4.4% 48
IFC-T Intact Financial 2.1% $169.98 3.8% $3.64 7.1% 17
L-T Loblaws 1.5% $98.04 -4.6% $1.46 6.6% 10
MGA-N Magna 2.2% $77.68 -4.8% $1.72 0.0% 12
MRU-T Metro 1.6% $67.46 0.6% $1.10 10.0% 27
RY-T Royal Bank of Canada 3.4% $143.18 4.6% $4.80 11.1% 11
SJ-T Stella-Jones Inc. 1.8% $39.68 -2.5% $0.72 0.0% 17
STN-T Stantec Inc. 1.0% $66.64 -5.1% $0.66 0.0% 10
TD-T TD Bank 3.6% $100.21 0.9% $3.56 12.7% 11
TFII-T TFI International 1.1% $120.07 -14.4% $1.36 17.4% 11
TIH-T Toromont Industries 1.3% $106.15 -6.6% $1.40 6.1% 32
TRP-T TC Energy Corp. 5.3% $65.61 9.8% $3.48 1.8% 21
T-T Telus 4.4% $29.89 0.4% $1.31 4.4% 18
WCN-N Waste Connections 0.7% $123.54 -7.8% $0.92 8.9% 12
Averages 2.7% -1.9% 6.1% 18

MP Market Review – January 21, 2022

Posted by BM on January 24, 2022

“This is the one thing I can never understand. To refer to a personal taste of mine, I’m going to buy hamburgers for the rest of my life. When hamburgers go down in price, we sing the ‘Hallelujah Chorus’ in the Buffett household. When hamburgers go up, we weep. For most people, it’s the same way with everything in life they will be buying–except stocks. When stocks go down and you can get more for your money, people don’t like them anymore.” – Warren Buffett

Another negative week for stock markets to begin the New Year. Canadian markets have been spared much of the carnage south of the border with tech heavy indexes now down double digits year to date. Canadian tech company Shopify (SHOP-T) however followed suit with the US tech drawdown and is now down 36% since January 1. If you are an investor now in these high-tech stocks, then you are betting that growth will continue. We trimmed our ‘expensive’ positions in some of our Magic Pants Wealth-Builder portfolios over the past year and more recently. Waiting to buy some cheap ‘hamburgers’ soon.

Looking to get paid no matter what the markets do in the short run is one of the reasons we switched to dividend growth investing years ago. When markets start reacting to all the negative narratives out there, we take comfort in the income our portfolios produce and wait for buying opportunities to increase our income even further. When prices drop, yields rise which means we get more income for our money. Having a watchlist ready is key to taking advantage of market downturns. Fortunately, we have the Magic Pants list (The List) to monitor for buying opportunities.  

Performance of ‘The List’

The best performers last week on ‘The List’ were Intact Financial (IFC-T) up 2.3%; Brookfield Infrastructure Partners (BIP-N) up 1.5%; Algonquin Power & Utilities (AQN-T) up 1.3%.

Magna (MGA-N) was the worst performer this week, down -12.1%.

‘The List’ was down this week -2.0% with a -2.9% YTD price return loss (capital) and an average of 4.7% dividend increase (income).

Dividend Increases

There were no dividend increases announced from companies on ‘The List’ this past week.

Earnings Releases

There were no earnings releases announced from companies on ‘The List’ this past week.

Canadian National Railway (CNR.TO) is scheduled to report this week on Tuesday, January 25, 2022

Metro Inc. (MRU.TO) is scheduled to report this week on Tuesday, January 25, 2022

Recent News

CN Rail Price Target Increased to $168 at Raymond James ahead of earnings

11:38 AM EST, 01/21/2022 (MT Newswires) — Raymond James raised its price target on Canadian National Railway Ltd. (CNR.TO, CNI) to $168 from $158 on Friday.

Analyst Steve Hansen maintained a Market Perform rating on shares of the Class I railway ahead of its fourth quarter results.

Hansen said CN is expected to see more healthy and normal traffic growth in 2023, and an increased effort on internal cost control.

“In the more immediate term, however, we continue to see traffic growth as challenged, with 4Q21 & 1H22 still grappling with lingering weather-related issues (floods & frost), a drought-afflicted Canadian harvest, and broader supply-chain congestion affecting key categories such as Intermodal & Auto,” the analyst said in a note to clients.

“Against this volatile backdrop, with leadership issues still unresolved, we view CN’s share price as reasonably valued at current levels,” Hansen said.

Metro Price Target Raised to $68 at ATB Ahead of Earnings Results

11:21 AM EST, 01/20/2022 (MT Newswires) — ATB Capital Markets raised its price target on Metro Inc. (MRU.TO) to $68 from $65.

Analyst Kenric Tyghe maintained a Sector Perform rating on shares of the Montreal-based food retailer ahead of its fiscal first quarter result on January 25.

“While our estimates for the quarter are unchanged ahead of the results, we have made (modest) positive revisions to both upcoming quarters through FY2022 and FY2023, reflecting both higher (for longer) than initially expected food inflation (concentrated in fresh) and the traction of company specific supply chain and store initiatives,” Tyghe said in a note to clients.

“The pace of food from stores inflation (Food CPI) not only accelerated further in December for a print of 5.7% (and 4.8% for the calendar quarter), but the supply shocks and pressures driving the elevated levels of food inflation are not yet easing,” the analyst said.

Below is a snapshot of ‘The List’ from last Friday’s close. For a sortable version of ‘The List’ please click on The List menu item.

‘The List’ is not meant to be a template for investors to copy exactly. Rather, its purpose is to provide investment ideas and a real-time illustration of dividend growth investing in action. It is not a ‘Buy List’, only a starting point for our analysis and discussion.

The List (2022)
Last updated by BM on January 21, 2022

*Note: The following graph is wide, you can scroll to the right on your device to see more of the data.

SYMBOL COMPANY YLD PRICE YTD % DIV YTD % STREAK
AQN-N Algonquin Power & Utilities 4.9% $14.02 -2.3% $0.68 2.3% 11
ATD-T Alimentation Couche-Tard Inc. 0.9% $48.57 -6.8% $0.44 18.1% 12
BCE-T Bell Canada 5.3% $65.47 -0.7% $3.50 1.2% 13
BIP-N Brookfield Infrastructure Partners 3.4% $60.44 -1.1% $2.04 0.0% 14
CCL-B-T CCL Industries 1.3% $64.60 -4.7% $0.84 0.0% 20
CNR-T Canadian National Railway 1.6% $154.54 -0.2% $2.46 0.0% 26
CTC-A-T Canadian Tire 2.9% $178.49 -2.6% $5.20 10.6% 11
CU-T Canadian Utilities Limited 4.9% $35.70 -2.5% $1.76 0.0% 50
DOL-T Dollarama Inc. 0.3% $61.62 -2.8% $0.20 1.7% 11
EMA-T Emera 4.4% $59.77 -4.5% $2.65 2.9% 15
ENB-T Enbridge Inc. 6.7% $51.35 3.7% $3.44 3.0% 26
ENGH-T Enghouse Systems Limited 1.4% $44.48 -3.0% $0.64 4.1% 15
FNV-N Franco Nevada 0.9% $130.62 -4.0% $1.20 3.4% 14
FTS-T Fortis 3.6% $58.95 -2.5% $2.14 4.4% 48
IFC-T Intact Financial 2.2% $164.30 0.4% $3.64 7.1% 17
L-T Loblaws 1.6% $92.46 -10.0% $1.46 6.6% 10
MGA-N Magna 2.2% $78.29 -4.0% $1.72 0.0% 12
MRU-T Metro 1.6% $63.56 -5.2% $1.00 0.0% 27
RY-T Royal Bank of Canada 3.3% $144.65 5.7% $4.80 11.1% 11
SJ-T Stella-Jones Inc. 1.8% $39.94 -1.8% $0.72 0.0% 17
STN-T Stantec Inc. 1.0% $65.54 -6.6% $0.66 0.0% 10
TD-T TD Bank 3.5% $100.30 1.0% $3.56 12.7% 11
TFII-T TFI International 1.1% $121.70 -13.2% $1.36 17.4% 11
TIH-T Toromont Industries 1.3% $107.16 -5.7% $1.40 6.1% 32
TRP-T TC Energy Corp. 5.5% $63.09 5.6% $3.48 1.8% 21
T-T Telus 4.5% $29.40 -1.2% $1.31 4.4% 18
WCN-N Waste Connections 0.7% $122.70 -8.5% $0.92 8.9% 12
Averages 2.7% -2.9% 4.7% 18

Q4 2021 Earnings Calendar-Intro

Posted by JM on January 21, 2021 

Benjamin Graham once remarked that earnings are the principal factor driving stock prices.

Each quarter we will provide readers with weekly earnings updates of stocks on ‘The List’ during the calendar earnings season. Q4 2021 has now ended, and companies are now beginning to report.

Earnings growth and dividend growth tend to go hand in hand so this information can tell us a lot about future dividend growth of our quality companies. Monitoring our dividend growers periodically is part of the process and reading the quarterly earnings releases is a good place to start.

Some of our dividend growers from ‘The List’ have reported quarterly earnings already, based on their fiscal year, with the majority of Q4 2021 earnings scheduled to report in February 2022.

The complete chart can be found below the updated List by selecting ‘The List’ menu item at the top of the site home page.

Q4 Estimates and Results:

SYMBOL COMPANY DATE ESTIMATE RESULT
ATD-B-T Alimentation Couche-Tard Inc. 23-Nov $0.65 $0.65 0.0%
RY-T Royal Bank of Canada 1-Dec $2.81 $2.71 -3.6%
TD-T TD Bank 2-Dec $1.96 $2.09 6.6%
DOL-T Dollarama Inc. 8-Dec $0.57 $0.61 7.0%
ENGH-T Enghouse Systems Limited 15-Dec $0.44 $0.54 22.7%

Although most companies on ‘The List’ will probably exceed earnings expectations once again in Q4, macro investors are predicting a slow down in the rate of change of earnings growth in 2022. This will impact valuations and put downward pressure on prices. With very few of our quality dividend growers currently in their ‘sensible’ price range, we are waiting patiently for an opportunity soon to add to our positions.

MP Market Review – January 14, 2022

Posted by BM on January 17, 2022

Q4 Earnings season is upon us. Companies start to report next week. Earnings should exceed expectations once again, but most investors feel that the near-term future will be far less bright. The markets tend to be forward looking so maybe some of the pessimism early in 2022 is starting to show. We will be cautious with what we buy as dividend growth investors but always have the comfort of our rising cash flow as market valuations revert to the mean.  

Performance of ‘The List’

The best performers last week on ‘The List’ were Enghouse Systems Limited (ENGH-T) up 4.6%; Magna (MGA-N) up 4.1%; Royal Bank (RY-T) up 3.9%.

TFI International (TFII-T) was the worst performer again this week, down -6.8% and -13.5% YTD.

‘The List’ was basically flat this week down .1% with a .9% YTD price return loss (capital) and an average of 4.7% dividend increase (income).

Dividend Increases

There were no dividend increases announced from companies on ‘The List’ this past week.

Earnings Releases

There were no earnings releases announced from companies on ‘The List’ this past week.

Recent News

Magna International Says Adding More Than 120 Engineers from Boston-Based Optimus Ride

Magna (MG.TO, MGA-N), one of the world’s largest suppliers in the automotive space and a mobility technology company, on Tuesday said it has added more than 120 employees of Optimus Ride, a provider of autonomous vehicle and mobility solutions located in Boston, to enhance Magna’s capabilities in the field of advanced driver assistance systems (ADAS).

According to news reports, Magna entered into an agreement with Optimus Ride to hire the engineers and to acquire its self-driving vehicle technology and intellectual property rights. Terms were not published but media reports said Magna had sent over 140 “engineering-related” job offers and more than 120 accepted them.

“Growing our engineering bench strength in sensing hardware and software helps accelerate our path forward in a rapidly growing ADAS market,” said John O’Hara, President of Magna Electronics, in a statement.

The contributions expected from the Optimus Ride employees will be valuable as Magna builds on its strengths and position as a global ADAS provider with comprehensive capabilities, the company added.

The team remains in Boston’s Seaport district, establishing a Boston-based engineering center and presence for Magna.

“As advancements in autonomy continue, we saw an opportunity to bring in additional expertise to support current programs as well as future customer needs. We are happy to welcome the Optimus Ride employees to the Magna family,” added O’Hara

Below is a snapshot of ‘The List’ from last Friday’s close. For a sortable version of ‘The List’ please click on The List menu item.

‘The List’ is not meant to be a template for investors to copy exactly. Rather, its purpose is to provide investment ideas and a real-time illustration of dividend growth investing in action. It is not a ‘Buy List’, only a starting point for our analysis and discussion.

The List (2022)
Last updated by BM on January 14, 2022

*Note: The following graph is wide, you can scroll to the right on your device to see more of the data.

SYMBOL COMPANY YLD PRICE YTD % DIV YTD % STREAK
AQN-N Algonquin Power & Utilities 4.9% $13.84 -3.6% $0.68 2.3% 11
ATD-T Alimentation Couche-Tard Inc. 0.9% $51.38 -1.4% $0.44 18.1% 12
BCE-T Bell Canada 5.3% $66.45 0.8% $3.50 1.2% 13
BIP-N Brookfield Infrastructure Partners 3.4% $59.57 -2.5% $2.04 0.0% 14
CCL-B-T CCL Industries 1.3% $67.01 -1.2% $0.84 0.0% 20
CNR-T Canadian National Railway 1.6% $154.97 0.1% $2.46 0.0% 26
CTC-A-T Canadian Tire 2.8% $184.49 0.7% $5.20 10.6% 11
CU-T Canadian Utilities Limited 4.9% $35.55 -2.9% $1.76 0.0% 50
DOL-T Dollarama Inc. 0.3% $63.00 -0.6% $0.20 1.7% 11
EMA-T Emera 4.4% $60.28 -3.7% $2.65 2.9% 15
ENB-T Enbridge Inc. 6.6% $52.30 5.6% $3.44 3.0% 26
ENGH-T Enghouse Systems Limited 1.4% $46.34 1.0% $0.64 4.1% 15
FNV-N Franco Nevada 0.9% $130.04 -4.5% $1.20 3.4% 14
FTS-T Fortis 3.6% $58.88 -2.6% $2.14 4.4% 48
IFC-T Intact Financial 2.3% $160.59 -1.9% $3.64 7.1% 17
L-T Loblaws 1.5% $99.20 -3.4% $1.46 6.6% 10
MGA-N Magna 1.9% $89.03 9.1% $1.72 0.0% 12
MRU-T Metro 1.5% $66.77 -0.4% $1.00 0.0% 27
RY-T Royal Bank of Canada 3.3% $147.29 7.6% $4.80 11.1% 11
SJ-T Stella-Jones Inc. 1.8% $40.80 0.3% $0.72 0.0% 17
STN-T Stantec Inc. 1.0% $67.62 -3.7% $0.66 0.0% 10
TD-T TD Bank 3.5% $102.46 3.1% $3.56 12.7% 11
TFII-T TFI International 1.1% $121.20 -13.5% $1.36 17.4% 11
TIH-T Toromont Industries 1.3% $106.02 -6.7% $1.40 6.1% 32
TRP-T TC Energy Corp. 5.5% $62.80 5.1% $3.48 1.8% 21
T-T Telus 4.4% $29.82 0.2% $1.31 4.4% 18
WCN-N Waste Connections 0.7% $125.62 -6.3% $0.92 8.9% 12
Averages 2.7% -0.9% 4.7% 18

The 90% Balance Rule

Posted by BM on January 14, 2022

In November last year we wrote a post about Peter Lynch’s Stay-in-Stocks Strategy that he first introduced in 1995. The withdrawal strategy assumes 8% growth in share prices and dividends with a starting dividend yield of 3%. The strategy will generate $50,000 of income each year from a $500,000 portfolio of dividend growth stocks. The average withdrawal rate in this strategy works out to about 8% over the 20 year period.

As a follow up to that article we came across a study titled ‘Income Withdrawal Sustainability using Large Cap Value Portfolio Historical Period 1932 – 2019. An Alternative Strategy for Income Harvesting’.

In the study the author assumes a 7% withdrawal rate using only large cap stocks as part of his portfolio. Some pay dividends and some do not. The concerns voiced in the study are the same as all investors…will we outlive our investments or “spend down” our principal to zero?

Over the period from 1932 – 2019, seventy-one “rolling” twenty-year periods were tested starting at the beginning of the calendar year. Eleven periods, or 15% of total, ended with the portfolio balance falling to zero (failure) at some point along the period.

Lynch’s returns and strategy were based on averages and as we all know, that sometimes can come back and hurt you as it did in this study, 15% of the time.

The most interesting part of the study was the adjustment the author made to improve on the 15% failure rate. The one change is called the ‘90% Balance Rule’.

“If, after the income withdrawal is taken (at the end of each year), the portfolio balance has fallen below “90%” of the original starting amount, then the annual withdrawal taken is reduced by 50%. In subsequent years, the portfolio balance is then monitored for a rise back above the 90% of the original starting amount, at which point a “7%” income withdrawal can be reinstated.

For example, the investor starts with an initial amount of $100K invested in Large Cap value portfolio. At the end of the first year, the portfolio value rises to $110K, so the investor takes a $7K withdrawal. At the end of the second year, with a portfolio loss and $7k income withdrawal the balance falls to $94K, yet still above $90K ( the “90%” of initial starting amount at the beginning of year one ). However, at the end of year three, the portfolio return and income withdrawal reduce the balance to $87K, and therefore, the income withdrawal is reduced to $3500. When the portfolio “gains” and income withdrawal equate to the portfolio values rising back above $90K, then the year’s income withdrawal can be increased “back to” $7K ( 7%).

A compelling feature of this method is that at the end of the year, taking into consideration the portfolio’s “balance level” and year’s return, an investor has a solid grasp as to what dollar amount that their income withdrawal is, and can plan their forward year’s expense budgeting accordingly. They can spread their withdrawal out over the course of the year in equal parts (quarterly for example) or take a larger portion of the withdrawal earlier or later, if emergency needs arise.”

By incorporating the 90% Balance Rule over all 20-year periods of the test sample, 96% of finishing portfolio balances ended above initial starting level with no portfolio “failures”. The other interesting observation was that in a high majority (82%) of the twenty-year periods required none or only one reduction in the withdrawal rate.

The author goes on to recommend that investors may want to take additional steps to compensate for a period of lower income, derived from reduced withdrawal rates, by building a ‘safe money’ bucket or having access to other sources of ‘backup’ income.

With so many investors on the sidelines over the last few years, incorporating Lynch’s ‘Stay-in-Stocks DGI Strategy’ with a 90% Balance Rule adjustment may be just what conservative investors are looking for if they fear a market correction or crash is just around the corner.

MP Market Review – January 7, 2022

Posted by BM on January 10, 2022

Attached is our new list for 2022. Two of our dividend growers did not grow their dividend in 2021 (BNS-T and EQB-T) so they have been removed from this year’s list. Replacing them are Loblaws (L-T) and Stantec Inc. (STN-T).

We were hesitant to remove Bank of Nova Scotia and Equitable Bank from ‘The List’ (due to pandemic restrictions placed on them by Canada’s banking regulator which were out of their control) but the recorded dividends in 2020 were the same as in 2021. We wanted to be consistent with one of the criteria (> ten years of consecutive dividend growth) we came up with to assemble ‘The List’ so they were removed.

Performance of ‘The List’

The best performers last week on ‘The List’ were Magna (MGA-N) up 4.9%; Royal Bank (RY-T) up 3.6%; Enbridge (ENB-T) up 3.5%

TFI International (TFII-T) was the worst performer, down -7.3%.

‘The List’ was down 1.1% this past week with a -1.1% YTD price return gain (capital) and an average of 4.7% dividend increase (income) in 2022 already.

Dividend Increases

There were no dividend increases announced from companies on ‘The List’ this past week.

Earnings Releases

There were no earnings releases announced from companies on ‘The List’ this past week.

Recent News

CCL Industries Acquires McGavigan Holdings for CCL Design

CCL Industries Inc. (CCL-B-T), a world leader in specialty label, security and packaging solutions for global corporations, government institutions, small businesses and consumers, announced today it has acquired privately owned McGavigan Holdings Ltd. (“McGavigan”), a leading supplier of ‘in mould’ decorated components for automotive interiors.

McGavigan supports its global automotive customer base from a long-established manufacturing plant in the U.K. and a recently completed, wholly owned greenfield facility in China, where a significant majority of its operations are based. Capabilities include state-of-the-art clean rooms with technical screen printing, high precision forming, injection moulding and automation technologies.

For the calendar year 2021, consolidated sales and adjusted EBITDA are estimated to be $55.7 million and $14.6 million, respectively. The purchase price consideration, net of cash acquired, and debt assumed, is approximately $105.5 million.

Geoffrey T. Martin, President and Chief Executive Officer of CCL Industries Inc., commented, “We have known McGavigan and its key people for many years, and are very pleased to welcome the team to CCL where they will continue to focus on innovative specialty product designs for automotive interiors. This acquisition significantly expands our presence in the automotive sector in China and brings important new product and technology platforms to our CCL Design global network, headed by Derek Cumming, Group Vice President.”

Below is a snapshot of ‘The List’ from last Friday’s close. For a sortable version of ‘The List’ please click on The List menu item.

‘The List’ is not meant to be a template for investors to copy exactly. Rather, its purpose is to provide investment ideas and a real-time illustration of dividend growth investing in action. It is not a ‘Buy List’, only a starting point for our analysis and discussion.

The List (2022)
Last updated by BM on January 7, 2022

*Note: The following graph is wide, you can scroll to the right on your device to see more of the data.

SYMBOL COMPANY YLD PRICE YTD % DIV YTD % STREAK
AQN-N Algonquin Power & Utilities 4.8% $14.18 -1.2% $0.68 2.3% 11
ATD-T Alimentation Couche-Tard Inc. 0.9% $50.20 -3.6% $0.44 18.1% 12
BCE-T Bell Canada 5.3% $65.87 -0.1% $3.50 1.2% 13
BIP-N Brookfield Infrastructure Partners 3.5% $58.89 -3.6% $2.04 0.0% 14
CCL-B-T CCL Industries 1.3% $65.99 -2.7% $0.84 0.0% 20
CNR-T Canadian National Railway 1.6% $156.10 0.8% $2.46 0.0% 26
CTC-A-T Canadian Tire 2.9% $179.87 -1.8% $5.20 10.6% 11
CU-T Canadian Utilities Limited 4.9% $35.63 -2.7% $1.76 0.0% 50
DOL-T Dollarama Inc. 0.3% $61.86 -2.4% $0.20 1.7% 11
EMA-T Emera 4.3% $60.96 -2.6% $2.65 2.9% 15
ENB-T Enbridge Inc. 6.7% $51.28 3.5% $3.44 3.0% 26
ENGH-T Enghouse Systems Limited 1.4% $44.29 -3.4% $0.64 4.1% 15
FNV-N Franco Nevada 0.9% $127.31 -6.5% $1.20 3.4% 14
FTS-T Fortis 3.6% $58.84 -2.7% $2.14 4.4% 48
IFC-T Intact Financial 2.2% $164.95 0.8% $3.64 7.1% 17
L-T Loblaws 1.4% $102.14 -0.6% $1.46 6.6% 10
MGA-N Magna 2.0% $85.56 4.9% $1.72 0.0% 12
MRU-T Metro 1.5% $67.32 0.4% $1.00 0.0% 27
RY-T Royal Bank of Canada 3.4% $141.75 3.6% $4.80 11.1% 11
SJ-T Stella-Jones Inc. 1.8% $40.55 -0.3% $0.72 0.0% 17
STN-T Stantec Inc. 1.2% $54.97 -1.3% $0.66 0.0% 10
TD-T TD Bank 3.6% $100.14 0.8% $3.56 12.7% 11
TFII-T TFI International 1.0% $130.01 -7.3% $1.36 17.4% 11
TIH-T Toromont Industries 1.2% $112.08 -1.4% $1.40 6.1% 32
TRP-T TC Energy Corp. 5.6% $61.68 3.3% $3.48 1.8% 21
T-T Telus 4.4% $29.66 -0.3% $1.31 4.4% 18
WCN-N Waste Connections 0.7% $130.24 -2.8% $0.92 8.9% 12
Averages 2.7% -1.1% 4.7% 18

MP Market Review – December 31, 2021

Posted by BM on January 3, 2022

Our new list for 2022 will be published the week of January 10, 2022.

Performance of ‘The List’

The best performers this week on ‘The List’ were Brookfield Infrastructure Partners (BIP-T) up 3.5%; Waste Connections Inc. (WCN-T) up 3.1%; Franco Nevada (FNV-T) up 2.1%

TC Energy Corp. (TRP-T) was the worst performer, down -2.7%.

‘The List’ as a whole was up .8% this past week with a 19.8% YTD price return gain (capital) and an average of 7.8% dividend increase (income) in 2021.

Dividend Increases

There were no dividend increases announced from companies on ‘The List’ this past week.

Earnings Releases

There were no earnings releases announced from companies on ‘The List’ this past week.

Recent News

The last trading week of the year was a slow one in Canada and there wasn’t a lot of earth-shattering news on the financial front. As this was the first year we published ‘The List’ on our blog, we have lots to summarize. Once we recheck all the numbers I will publish last year’s version of ‘The List’ one more time this week with comments.

Although most investors would have been happy with a 20% return plus dividends, the intent of ‘The List’ was not to be a portfolio to copy exactly with equal weightings in each stock. It is more of a real-time illustration of dividend growth investing in action. We have found it a lot easier to coach our process when we are using real dividend growth companies as examples.

In 2022 we will be launching the subscription service for our Magic Pants Wealth-Builder Portfolio (CDN) where we will be using real money and inviting the blog reader to follow along and build their own portfolios as we do an even deeper dive into our process. The process has generated excellent income growth and capital returns for the last decade, and we would like to share with you how we did it. More details to come.

Below is a snapshot of ‘The List’ from last Friday’s close. For a sortable version of ‘The List’ please click on The List menu item.

‘The List’ is not meant to be a template for investors to copy exactly. Rather, its purpose is to provide investment ideas and a real-time illustration of dividend growth investing in action. It is not a ‘Buy List’, only a starting point for our analysis and discussion.

The List (2021)
Last updated by BM on December 31, 2021

*Note: The following graph is wide, you can scroll to the right on your device to see more of the data.

SYMBOL COMPANY YLD PRICE YTD % DIV YTD % STREAK
AQN-N Algonquin Power & Utilities 4.6% $14.45 -11.1% $0.67 10.0% 10
ATD-T Alimentation Couche-Tard Inc. 0.7% $53.00 21.5% $0.37 25.2% 11
BCE-T Bell Canada 5.3% $65.81 19.7% $3.46 5.1% 12
BIP-N Brookfield Infrastructure Partners 3.4% $60.81 22.9% $2.04 2.5% 13
BNS-T Bank of Nova Scotia 4.0% $89.55 32.2% $3.60 0.0% 10
CCL-B-T CCL Industries 1.2% $67.83 17.0% $0.84 16.7% 19
CNR-T Canadian National Railway 1.6% $155.38 11.0% $2.46 7.0% 25
CTC-A-T Canadian Tire 2.6% $181.44 9.1% $4.70 3.3% 10
CU-T Canadian Utilities Limited 4.8% $36.69 18.6% $1.76 1.0% 49
DOL-T Dollarama Inc. 0.3% $63.31 21.2% $0.20 12.4% 10
EMA-T Emera 4.1% $63.22 17.8% $2.58 3.8% 14
ENB-T Enbridge Inc. 6.8% $49.41 21.0% $3.34 3.1% 25
ENGH-T Enghouse Systems Limited 1.3% $48.43 -22.0% $0.62 19.4% 14
EQB-T Equitable Group Inc 1.1% $68.91 31.2% $0.74 0.0% 10
FNV-N Franco Nevada 0.8% $138.29 5.0% $1.16 12.6% 13
FTS-T Fortis 3.4% $61.03 17.0% $2.05 4.1% 47
IFC-T Intact Financial 2.1% $164.42 9.8% $3.40 2.4% 16
MGA-N Magna 2.1% $80.94 16.1% $1.72 7.5% 11
MRU-T Metro 1.5% $67.32 16.9% $1.00 13.6% 26
RY-T Royal Bank of Canada 3.2% $134.25 28.2% $4.32 0.7% 10
SJ-T Stella-Jones Inc. 1.8% $40.01 -13.9% $0.72 20.0% 16
TD-T TD Bank 3.3% $96.98 34.8% $3.16 1.6% 10
TFII-T TFI International 0.8% $141.87 117.1% $1.16 8.4% 10
TIH-T Toromont Industries 1.2% $114.36 29.2% $1.32 6.5% 31
TRP-T Trans Canada 5.8% $58.83 12.7% $3.42 5.6% 20
T-T Telus 4.2% $29.79 17.1% $1.25 8.2% 17
WCN-N Waste Connections 0.6% $136.27 34.7% $0.85 11.2% 11
Averages 2.7% 19.8% 7.8% 17

We buy quality individual dividend growth stocks when they are sensibly priced and hold for the growing income.