“You have a pair of pants. In the left pocket, you have $100. You take $1 out of the left pocket and put in the right pocket. You now have $101. There is no diminution of dollars in your left pocket. That is one magic pair of pants.”

MP Market Review – September 23, 2022

Last updated by BM on September 26, 2022

Summary

  • This article is part of our weekly series (MP Market Review) highlighting the performance and activity from the previous week related to the financial markets and Canadian dividend growth companies we follow on ‘The List’.
  • Last week, ‘The List’ was down sharply with a minus -6.0% YTD price return (capital). Dividend growth of ‘The List’ remains at +10.2% YTD, demonstrating the rise in income over the last year.
  • Last week, there were no dividend increases from companies on ‘The List’.
  • Last week, there were no earnings reports from companies on ‘The List’.
  • No companies on ‘The List’ are due to report earnings this week.
  • Are you looking to build an income portfolio of your own? When you become a premium subscriber, you get exclusive access to the MP Wealth-Builder Model Portfolio (CDN) and subscriber-only content. Start building real wealth today!  Learn More

 “Fortunes are made by buying right and holding on.”

 – Tom Phelps

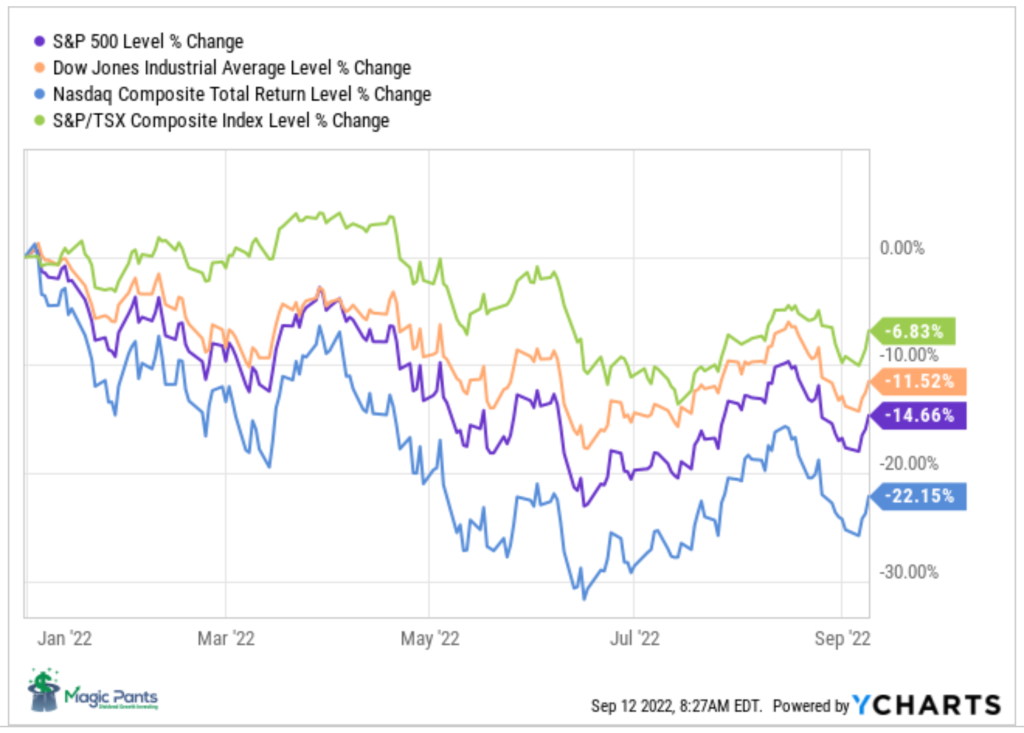
Last week in the markets was difficult to watch as many of the indexes plummeted further as the reality of an upcoming recession has finally sunk in. The TSX Composite Index finally went below -10% for the first time this year.

Although it is difficult to look for optimism, we need to remember that as dividend growth investors we do things a bit differently. We see volatile markets as opportunities to either prune or add to our positions. In the case of a downward trending market, we look to buy more income when our quality companies go on sale.

In the ‘Recent News’ section of this week’s review, there is a good article on dividend investing in uncertain times. Although our historical returns are similar, we are much less active than the ‘Stable Dividend portfolio’ strategy. It is interesting to note that many of our companies on ‘The List’ have found their way into Mr. Rothery’s portfolio currently.

One of the charts we like in the article is the chart that displays the volatility of the ‘Stable Dividend Portfolio’ versus the index.

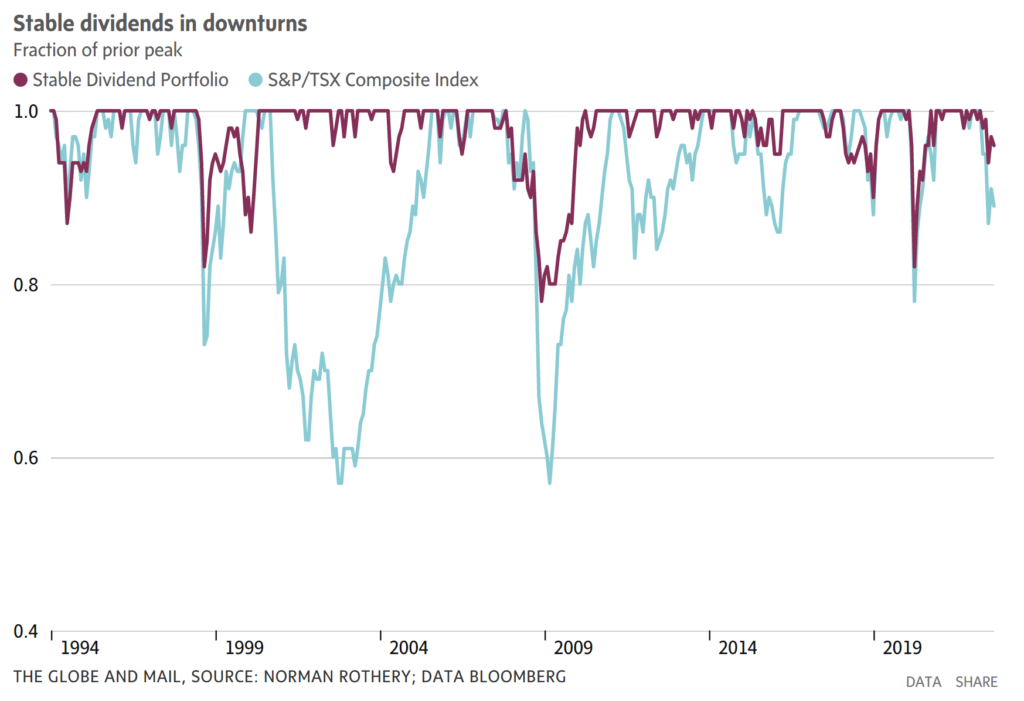
This data seems to support our own experience with ‘The List’ as our YTD capital returns are down much less than the decline in the TSX Composite index.

Saying you are down only half as much as the index is not that comforting to most retirees, but it at least means that the climb back up will be shorter. Our growing yields seem to act as a floor for declining prices. In addition, we still have our growing dividend income to cover our expenses and have fun with, until things turn around.

In the case of our model portfolio, we believe our patience will pay off very soon and we can enjoy even more of our newfound income when we start or add to our positions at ‘sensible prices’.

Performance of ‘The List’

At the end of the post is a snapshot of ‘The List’ from last Friday’s close. Feel free to click on the ‘The List’ menu item above for a sortable version.

Last week, ‘The List’ was down sharply with a minus -6.0% YTD price return (capital). Dividend growth of ‘The List’ remains at +10.2% YTD, demonstrating the rise in income over the last year.

The best performers last week on ‘The List’ were all negative. Dollarama Inc. (DOL-T), down -0.30%; Emera (EMA-T), down -0.92%; and CCL Industries (CCL-B-T), down -1.05%.

Magna (MGA-N) was the worst performer last week, down -8,68%.

Recent News

How the Stable Dividend portfolio fares in uncertain times (Globe & Mail)

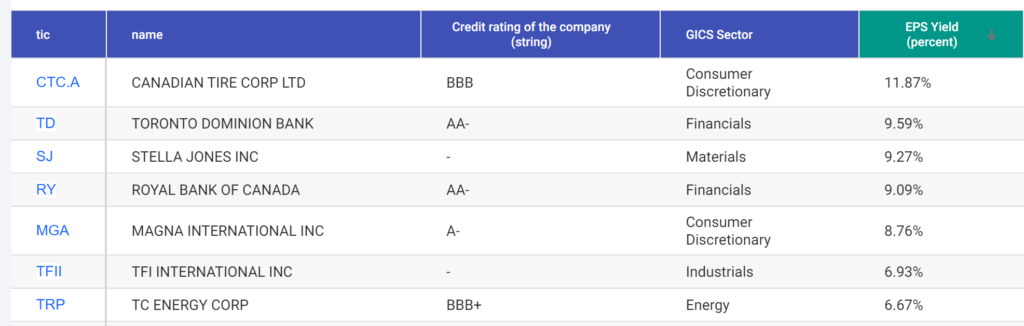
“That brings me to the Stable Dividend portfolio. It picks 20 stocks from the dividend-paying portfolio that were the least volatile over the preceding 260 days. That is, their prices varied the least compared to other dividend stocks in recent months. The hope is that they’ll continue to offer a relatively smooth ride in the future.”

The strategy puts an equal amount of money in each of the 20 stocks and is rebalanced monthly. The portfolio has had an average 14.5% annual return over the last twenty years. If you chose to rebalance the portfolio only once a year, the return is still very good (13.6% annualized return).

Although the criteria are different from ours (recent volatility vs growing dividends) it is interesting to notice that about 50% of the stocks on ‘The List’ and on the ‘Stable Dividend’ portfolio are currently the same.

We like our more passive approach better as our capital grows at about the same rate, our income continues to compound and we pay fewer taxes along the way.

The terrifying – and highly profitable – journey of a bank stock (Globe & Mail)

“The purpose of this exercise is to demonstrate that, when you own an excellent company, you are much better off holding the shares through thick and thin than trying to trade your way through the market’s gyrations. I don’t know anyone who can do that reliably, but I know plenty of people who try.”

In this article, the author walks you through the ride of the share price of Canada’s largest bank over the last twenty years. Although there have been a few recessions, and dividend freezes (no cuts) the capital return easily beats the index.

“Royal Bank’s total return over that time, including dividends, was 12.45 per cent on an annualized basis. To put that into dollars, your initial $10,000 investment would have grown to $104,618 – a gain of 946 per cent – before tax.”

Imagine your returns if you had pruned a little at the top and bought a little back after each dividend freeze. I wonder how much our income would have grown during the same time period?

No companies on ‘The List’ are due to report earnings this week.

Dividend Increases

Last week, there were no dividend increases from companies on ‘The List’.

Earnings Releases

Last week, there were no earnings reports from companies on ‘The List’.


Below is a snapshot of ‘The List’ from last Friday’s close. For a sortable version of ‘The List’, please click on The List menu item.

‘The List’ is not meant to be a template for investors to copy exactly. Instead, its purpose is to provide investment ideas and a real-time illustration of dividend growth investing in action. It is not a ‘Buy List’ nor does it reflect the composition or returns of our Magic Pants Wealth-Builder (CDN) Portfolio. It is only a starting point for our analysis and discussion.

The List (2022)
Last updated by BM on September 23, 2022

*Note: The following graph is wide, you can scroll to the right on your device to see more of the data.

SYMBOL COMPANY YLD PRICE YTD % DIV YTD % STREAK
AQN-N Algonquin Power & Utilities 5.6% $12.49 -13.0% $0.70 5.4% 11
ATD-T Alimentation Couche-Tard Inc. 0.8% $54.53 4.7% $0.44 18.1% 12
BCE-T Bell Canada 5.9% $61.45 -6.8% $3.64 4.0% 13
BIP-N Brookfield Infrastructure Partners 3.6% $39.61 -2.7% $1.44 5.9% 14
CCL-B-T CCL Industries 1.5% $65.11 -4.0% $0.96 14.3% 20
CNR-T Canadian National Railway 1.9% $150.97 -2.5% $2.93 19.1% 26
CTC-A-T Canadian Tire 3.9% $149.92 -18.2% $5.85 24.5% 11
CU-T Canadian Utilities Limited 4.5% $39.45 7.8% $1.78 1.0% 50
DOL-T Dollarama Inc. 0.3% $76.52 20.7% $0.22 9.2% 11
EMA-T Emera 4.4% $60.48 -3.4% $2.65 2.9% 15
ENB-T Enbridge Inc. 6.7% $51.64 4.2% $3.44 3.0% 26
ENGH-T Enghouse Systems Limited 2.5% $28.53 -37.8% $0.72 16.3% 15
FNV-N Franco Nevada 1.1% $114.13 -16.1% $1.28 10.3% 14
FTS-T Fortis 3.8% $56.19 -7.1% $2.14 2.9% 48
IFC-T Intact Financial 2.0% $197.32 20.5% $4.00 17.6% 17
L-T Loblaws 1.4% $111.98 9.0% $1.54 12.4% 10
MGA-N Magna 3.6% $50.11 -38.6% $1.80 4.7% 12
MRU-T Metro 1.6% $69.84 4.2% $1.10 12.2% 27
RY-T Royal Bank of Canada 4.0% $123.40 -9.8% $4.96 14.8% 11
SJ-T Stella-Jones Inc. 2.1% $37.85 -7.0% $0.80 11.1% 17
STN-T Stantec Inc. 1.2% $59.42 -15.3% $0.71 6.8% 10
TD-T TD Bank 4.2% $84.37 -15.1% $3.56 12.7% 11
TFII-N TFI International 1.2% $91.00 -17.8% $1.08 12.5% 11
TIH-T Toromont Industries 1.6% $95.56 -15.9% $1.52 15.2% 32
TRP-T TC Energy Corp. 6.0% $59.21 -0.9% $3.57 4.4% 21
T-T Telus 4.7% $28.38 -4.6% $1.33 6.2% 18
WCN-N Waste Connections 0.7% $139.72 4.2% $0.92 8.9% 12
Averages 3.0% -6.0% 10.2% 18

MP Market Review – September 16, 2022

Last updated by BM on September 19, 2022

Summary

  • This article is part of our weekly series (MP Market Review) highlighting the performance and activity from the previous week related to the financial markets and Canadian dividend growth companies we follow on ‘The List’.
  • Last week, ‘The List’ was down slightly with a minus -2.6% YTD price return (capital). Dividend growth of ‘The List’ remains at +10.2% YTD, demonstrating the rise in income over the last year.
  • Last week, there were no dividend increases from companies on ‘The List’.
  • Last week, there were no earnings reports from companies on ‘The List’.
  • No companies on ‘The List’ are due to report earnings this week.
  • Are you looking to build an income portfolio of your own? When you become a premium subscriber, you get exclusive access to the MP Wealth-Builder Model Portfolio (CDN) and subscriber-only content. Start building real wealth today!  Learn More

“Dividend growth investing (DGI) is not a way to “get rich quickly”, but it is a way to produce a safe, reliable, dependable, rising stream of cash to help pay for your retirement, without ever selling a single share.”

– Robert Allan Schwartz, Seeking Alpha Contributor

The markets continue to be volatile and trend downwards. Try not to focus on the narratives in the news and follow the process. This DGI anecdote should help.

When reading the article in the Globe & Mail on three dividend growth stocks to hold forever, I couldn’t help but comment on our own experience with dividend growth investing over the last ten years.

As dividend growth investors, we like to invest in high-quality companies with enduring competitive advantages, long operating histories, shareholder-aligned management, and large markets that provide opportunities for long-term growth. These businesses maintain reasonable payout ratios, generate consistent free cash flow, and have healthy balance sheets, providing a sturdy foundation for consistent dividend increases.

Like the article, we agree that Fortis is one of the highest quality dividend growth stocks in Canada with a dividend growth streak of 48 years, Fortis (FTS) has increased its dividend every year now for almost five decades.

To demonstrate how dividend growth investing works for a portfolio of dividend growth stocks, let’s look at some data from our Magic Pants Wealth-Builder Portfolio (CDN) portfolio back in 2012 and compare it to today.

Our initial four stock portfolio in 2012:

There is a lot of significant data to grasp from a small chart like this. Our portfolio yield now (Growth YLD) is 6.55%. That is how much we earn today from dividends alone on the money we invested in 2012. Our dividend growth and price growth are aligned at 96% and 101%. This means that both our income and capital have doubled in the last decade. It doesn’t stop there either as dividend growth will more than likely continue and drive our capital growth even higher.

As our timeline progresses, our holdings get safer and safer and throw off even more cash. Our risk becomes negligible as our margin of safety grows with our yield. My mentor, Tom Connolly, has a word for stocks that perform like these; ‘bondified’. After a decade or two, maybe sooner, these stocks offer an attractive alternative to fixed income instruments such as government bonds and can be counted as the fixed income portion of your portfolio.

With decade-long returns like this and some of our quality dividend growers now paying higher yields (due to recent price declines) than they did in 2012, we will soon be buying more of these wealth-building machines and not fretting so much about what is in the news.

If a DGI strategy interests you, please subscribe to our Magic Pants DGI Premium Membership, and you can learn how to build a robust dividend growth portfolio of your own.

We provide real-time trade alerts. So, you won’t miss any of the action!

Performance of ‘The List’

At the end of the post is a snapshot of ‘The List’ from last Friday’s close. Feel free to click on the ‘The List’ menu item above for a sortable version.

Last week, ‘The List’ was down slightly with a minus -2.6% YTD price return (capital). Dividend growth of ‘The List’ remains at +10.2% YTD, demonstrating the rise in income over the last year.

The best performers last week on ‘The List’ were Enghouse Systems Limited (ENGH-T), up +0.91%; Intact Financial (IFC-T), up +0.72%; and Enbridge Inc. (ENB-T), down -0.09%.

TFI International (TFII-N) was the worst performer last week, down -9.26%.

Recent News

Surprise jump in U.S. inflation sends stock markets tumbling (Globe & Mail)

More bad news on the inflation front this past week. We would hardly call the data a ‘surprise’ though. Have you filled up your car with gasoline, bought groceries, went out for dinner or paid rent lately?  It seems everything continues to become more expensive.

“This means the Fed and other central banks will likely turn even more aggressive in their determination to wrestle inflation back to about 2 per cent, even if they hurt economic activity.”

When economic activity is hurt, economies go into recession. The Canadian economy is not immune to central bank actions. We still have a long way to go in our own ‘quantitative tightening’ (QT) process.

Three dividend growth stocks to hold forever (Globe & Mail)

The three stocks mentioned in the article are worthy candidates (FTS-T, BIP-N and TD-T). They are however just a small subset of the companies on ‘the List’ we publish and follow each week.

There are some terrific quotes in the article we believe are important to remember.

“One of the biggest investing myths is that you have to put in a lot of work to achieve great results. Without exhaustive research and a knack for savvy trading, you’ll never build lasting wealth and achieve financial independence, or so many investors believe. Nonsense.”

“Many investors know that the buy-and-hold approach makes sense, in theory. Yet they can’t resist the urge to make changes to their portfolios. When a stock rises, they sell to lock in their profit. When a stock tanks, they take their lumps and move on to the next shiny object. The underlying assumption is that they must trade to win at investing. This notion is reinforced by financial websites and ads for discount brokers that feature the latest whiz-bang trading tools.”

“But if you own great companies, the best approach is to do nothing. Stock prices always bounce around in the short run, but over the long run excellent businesses will reward you with capital appreciation and rising dividends.”

As dividend growth investors we believe in purchasing only the highest quality companies and rarely sell. Our strategy is not about trading. We focus on the rising cash flow and the capital appreciation that will follow.

No companies on ‘The List’ are due to report earnings this week.

Dividend Increases

Last week, there were no dividend increases from companies on ‘The List’.

Earnings Releases

Last week, there were no earnings reports from companies on ‘The List’.


Below is a snapshot of ‘The List’ from last Friday’s close. For a sortable version of ‘The List’, please click on The List menu item.

‘The List’ is not meant to be a template for investors to copy exactly. Instead, its purpose is to provide investment ideas and a real-time illustration of dividend growth investing in action. It is not a ‘Buy List’ nor does it reflect the composition or returns of our Magic Pants Wealth-Builder (CDN) Portfolio. It is only a starting point for our analysis and discussion.


The List (2022)
Last updated by BM on September 16, 2022

*Note: The following graph is wide, you can scroll to the right on your device to see more of the data.

SYMBOL COMPANY YLD PRICE YTD % DIV YTD % STREAK
AQN-N Algonquin Power & Utilities 5.3% $13.20 -8.0% $0.70 5.4% 11
ATD-T Alimentation Couche-Tard Inc. 0.7% $59.08 13.4% $0.44 18.1% 12
BCE-T Bell Canada 5.8% $62.29 -5.5% $3.64 4.0% 13
BIP-N Brookfield Infrastructure Partners 3.6% $40.55 -0.4% $1.44 5.9% 14
CCL-B-T CCL Industries 1.5% $65.80 -2.9% $0.96 14.3% 20
CNR-T Canadian National Railway 1.9% $154.61 -0.2% $2.93 19.1% 26
CTC-A-T Canadian Tire 3.7% $157.76 -13.9% $5.85 24.5% 11
CU-T Canadian Utilities Limited 4.4% $40.43 10.4% $1.78 1.0% 50
DOL-T Dollarama Inc. 0.3% $76.75 21.0% $0.22 9.2% 11
EMA-T Emera 4.3% $61.04 -2.5% $2.65 2.9% 15
ENB-T Enbridge Inc. 6.3% $54.42 9.9% $3.44 3.0% 26
ENGH-T Enghouse Systems Limited 2.4% $29.88 -34.8% $0.72 16.3% 15
FNV-N Franco Nevada 1.1% $118.21 -13.1% $1.28 10.3% 14
FTS-T Fortis 3.8% $56.85 -6.0% $2.14 2.9% 48
IFC-T Intact Financial 2.0% $202.66 23.8% $4.00 17.6% 17
L-T Loblaws 1.4% $113.80 10.8% $1.54 12.4% 10
MGA-N Magna 3.3% $54.87 -32.7% $1.80 4.7% 12
MRU-T Metro 1.5% $71.28 6.3% $1.10 12.2% 27
RY-T Royal Bank of Canada 3.9% $126.45 -7.6% $4.96 14.8% 11
SJ-T Stella-Jones Inc. 2.0% $40.97 0.7% $0.80 11.1% 17
STN-T Stantec Inc. 1.1% $62.42 -11.1% $0.71 6.8% 10
TD-T TD Bank 4.0% $87.93 -11.5% $3.56 12.7% 11
TFII-N TFI International 1.1% $94.91 -14.3% $1.08 12.5% 11
TIH-T Toromont Industries 1.5% $101.02 -11.1% $1.52 15.2% 32
TRP-T TC Energy Corp. 5.7% $62.39 4.5% $3.57 4.4% 21
T-T Telus 4.6% $28.77 -3.3% $1.33 6.2% 18
WCN-N Waste Connections 0.6% $144.81 8.0% $0.92 8.9% 12
Averages 2.9% -2.6% 10.2% 18

MP Market Review – September 09, 2022

Last updated by BM on September 12, 2022

Summary

  • This article is part of our weekly series (MP Market Review) highlighting the performance and activity from the previous week related to the financial markets and Canadian dividend growth companies we follow on ‘The List’.
  • Last week, ‘The List’ was up a with a minus -0.2% YTD price return (capital). Dividend growth of ‘The List’ remains at +10.2% YTD, demonstrating the rise in income over the last year.
  • Last week, there were no dividend increases from companies on ‘The List’.
  • Last week, there were two earnings reports from companies on ‘The List’.
  • No companies on ‘The List’ are due to report earnings this week.
  • Are you looking to build an income portfolio of your own? When you become a premium subscriber, you get exclusive access to the MP Wealth-Builder Model Portfolio (CDN) and subscriber-only content. Start building real wealth today!  Learn More

To make money in stocks, you need to have the vision to see them, the courage to buy them and the patience to hold them. Patience is the rarest of the three.”

– George F. Bakers

We talked a lot about patience earlier in the year when the Central Banks began their quantitative tightening into a slowing economy. So far, we seem to have been correct. Markets continue their downward trend.

In the quote above, Mr. Bakers talks about the “ …patience to hold them”, in reference to stocks. We agree. Even when markets are heading south, holding onto your good dividend growers is key to our success. The time to trim a position was late last year, not when markets are down.

If a DGI strategy interests you, please subscribe to our Magic Pants DGI Premium Membership, and you can learn how to build a robust dividend growth portfolio of your own.

We provide real-time trade alerts. So, you won’t miss any of the action!

Performance of ‘The List’

Last week, ‘The List’ was up with a minus -0.2% YTD price return (capital). Dividend growth of ‘The List’ remains at +10.2% YTD, demonstrating the rise in income over the last year.

The best performers last week on ‘The List’ were CCL Industries (CCL-T), up +6.91%; Intact Financial (IFC-T), up +5.15%; and Waste Connections (WCN-N), up +4.16%.

Enghouse Systems Limited (ENGH-T) was the worst performer last week, down -7.67%.

Recent News

Bullish on Alimentation Couche-Tard Inc. (Globe & Mail)

“Behaviour indicators including the rising 40wMA and the rising trend line confirm the bullish status. There is good support near $54-55; only a sustained decline below $52-53 would be negative.

Point & Figure measurements provide targets of $64 and $69. Higher targets are visible.”

We see articles about ‘bullish’ sentiment in the market almost every day. It makes you wonder who to believe. A process to help determine a sensible price helps decipher the narratives.

ATD-T is one of our quality dividend growers, so we pay attention. The company is still slightly overvalued based on historical fundamentals. We are being patient on this one.

Canada’s jobless rate jumps to 5.4% as hiring falls for third consecutive month (Globe & Mail)

“Canada has now seen three consecutive months of job losses, something that hasn’t historically happened outside of a recession,” said Royce Mendes, head of macro strategy at Desjardins Securities, in a note to clients. “The deterioration in the job market appears to be occurring faster than anticipated.”

The signs are all there. Canada is headed for a recession. How deep and how long are yet to be determined. Are your investments ready?

A dividend growth strategy is one way to protect both your capital and income during recessions.

No companies on ‘The List’ are due to report earnings this week.

Dividend Increases

Last week, there were no dividend increases from companies on ‘The List’.

Earnings Releases

Enghouse Systems Limited (ENGH-T) and Dollarama Inc. (DOL-T) released earnings last week. ENGH-T with its third-quarter 2022 results and DOL-T with its second-quarter 2023 results. Let’s start with Enghouse Systems.

Enghouse Systems Limited (ENGH-T)

“Revenue for the third quarter of 2022 was $102.1 million with results from operating activities of $29.8 million and cash flows from operating activities, excluding changes in working capital of $34.1 million. As a result, we closed the quarter with $229.5 million in cash, cash equivalents, and short-term investments with no external debt. This was accomplished while completing two acquisitions for $6.1 million, paying quarterly dividends of $10.3 million and repurchasing $9.0 million of common stock from shareholders. We remain focused on operating a profitable, cash-flow-positive business generating the necessary capital to fund our acquisition strategy without the need for financing.”

Stephen J. Sadler Chairman of the Board and Chief Executive Officer

Highlights:

Financial and operational highlights for the three and nine months ended July 31, 2022 compared to the three and nine months ended July 31, 2021 are as follows:

  • Revenue achieved was $102.1 and $319.5 million, respectively, compared to revenue of $117.6 and $354.1 million;
  • Results from operating activities was $29.8 and $96.5 million, respectively, compared to $38.5 and $116.1 million; • Net income was $18.1 and $57.5 million, respectively, compared to $21.2 and $62.6 million;
  • Adjusted EBITDA was $32.5 and $104.8 million, respectively, compared to $41.7 and $126.4 million;
  • Cash flows from operating activities excluding changes in working capital was $34.1 and $107.3 million, respectively, compared to $41.1 and $125.4 million.

Outlook:

“Enghouse completed two acquisitions late in the quarter, purchasing Competella AB on June 23, 2022 and NTW Software GmbH on July 6, 2022. Competella AB offers a complete contact center platform focused on the Scandinavian and Swiss markets with both a SaaS and on-premise solution. NTW Software GmbH provides an attendant console and contact center offering for organizations that have adopted the Cisco communications platform. Both acquisitions augment our contact center offerings and broaden our cloud hosted solutions portfolio. We believe that acquisition valuations are becoming more favourable in this environment as rising interest rates increases debt servicing costs and reduces profitability for many companies in the technology segment.”

See the full Earnings Release here


Dollarama (DOL-T)

“Our strong performance in the first half of Fiscal 2023 reflects a sustained consumer response to our unique value proposition, especially for everyday essentials, as Canadians from all walks of life adapt to a high-inflation environment. As a result, we are increasing our assumption for annual comparable store sales growth to between 6.5% and 7.5%,” said Neil Rossy, President and CEO.

Highlights:

  • Sales increased by 18.2% to $1,217.1 million
  • Comparable store sales increased by 13.2%
  • EBITDA increased by 25.8% to $369.4 million, or 30.4% of sales, compared to 28.5% of sales
  • Operating income increased by 30.3% to $287.4 million, or 23.6% of sales, compared to 21.4% of sales
  • Diluted net earnings per common share increased by 37.5% to $0.66 from $0.48
  • 13 net new stores opened, compared to 13 net new stores
  • 3,690,894 common shares repurchased for cancellation for $274.9 million

Outlook:

“As we strive to provide Canadians with a wide variety of merchandise, I am pleased with our progress rebuilding our inventory, thereby ensuring that our conveniently located stores are well-stocked for our customers ahead of key seasons in the second half of the fiscal year,” Mr. Rossy added.

See the full Earnings Release here


Below is a snapshot of ‘The List’ from last Friday’s close. For a sortable version of ‘The List’, please click on The List menu item.

‘The List’ is not meant to be a template for investors to copy exactly. Instead, its purpose is to provide investment ideas and a real-time illustration of dividend growth investing in action. It is not a ‘Buy List’ nor does it reflect the composition or returns of our Magic Pants Wealth-Builder (CDN) Portfolio. It is only a starting point for our analysis and discussion.


The List (2022)
Last updated by BM on September 09, 2022

*Note: The following graph is wide, you can scroll to the right on your device to see more of the data.

SYMBOL COMPANY YLD PRICE YTD % DIV YTD % STREAK
AQN-N Algonquin Power & Utilities 5.1% $13.77 -4.0% $0.70 5.4% 11
ATD-T Alimentation Couche-Tard Inc. 0.7% $59.42 14.0% $0.44 18.1% 12
BCE-T Bell Canada 5.7% $63.71 -3.3% $3.64 4.0% 13
BIP-N Brookfield Infrastructure Partners 3.4% $42.25 3.7% $1.44 5.9% 14
CCL-B-T CCL Industries 1.4% $69.04 1.8% $0.96 14.3% 20
CNR-T Canadian National Railway 1.8% $158.88 2.6% $2.93 19.1% 26
CTC-A-T Canadian Tire 3.6% $160.51 -12.4% $5.85 24.5% 11
CU-T Canadian Utilities Limited 4.3% $41.02 12.0% $1.78 1.0% 50
DOL-T Dollarama Inc. 0.3% $80.59 27.1% $0.22 9.2% 11
EMA-T Emera 4.2% $62.48 -0.2% $2.65 2.9% 15
ENB-T Enbridge Inc. 6.3% $54.47 10.0% $3.44 3.0% 26
ENGH-T Enghouse Systems Limited 2.4% $29.61 -35.4% $0.72 16.3% 15
FNV-N Franco Nevada 1.0% $125.97 -7.4% $1.28 10.3% 14
FTS-T Fortis 3.7% $58.44 -3.4% $2.14 2.9% 48
IFC-T Intact Financial 2.0% $201.21 22.9% $4.00 17.6% 17
L-T Loblaws 1.3% $117.46 14.3% $1.54 12.4% 10
MGA-N Magna 3.1% $57.99 -28.9% $1.80 4.7% 12
MRU-T Metro 1.5% $72.18 7.7% $1.10 12.2% 27
RY-T Royal Bank of Canada 3.9% $127.68 -6.7% $4.96 14.8% 11
SJ-T Stella-Jones Inc. 1.9% $41.20 1.3% $0.80 11.1% 17
STN-T Stantec Inc. 1.1% $63.93 -8.9% $0.71 6.8% 10
TD-T TD Bank 4.0% $88.07 -11.4% $3.56 12.7% 11
TFII-N TFI International 1.0% $104.59 -5.6% $1.08 12.5% 11
TIH-T Toromont Industries 1.5% $104.77 -7.8% $1.52 15.2% 32
TRP-T TC Energy Corp. 5.6% $63.26 5.9% $3.57 4.4% 21
T-T Telus 4.5% $29.33 -1.4% $1.33 6.2% 18
WCN-N Waste Connections 0.6% $146.40 9.2% $0.92 8.9% 12
Averages 2.8% -0.2% 10.2% 18

MP Market Review – September 02, 2022

Last updated by BM on September 05, 2022

Summary

  • This article is part of our weekly series (MP Market Review) highlighting the performance and activity from the previous week related to the financial markets and Canadian dividend growth companies we follow on ‘The List’.
  • Last week, ‘The List’ was down slightly with a minus -1.9% YTD price return (capital). Dividend growth of ‘The List’ remains at +10.2% YTD, demonstrating the rise in income over the last year.
  • Last week, there were no dividend increases from companies on ‘The List’.
  • Last week, there was one earnings report from companies on ‘The List’.
  • Two companies on ‘The List’ are due to report earnings this week.
  • Are you looking to build an income portfolio of your own? When you become a premium subscriber, you get exclusive access to the MP Wealth-Builder Model Portfolio (CDN) and subscriber-only content. Start building real wealth today!  Learn More

“The desirability of a business with extraordinary economic characteristics can be ruined by the price you pay for it.”

– Charlie Munger

We haven’t done our Monthly Portfolio Reviews in a couple of months because ‘The List’ hasn’t changed much. Companies that meet our minimum valuation criteria have remained the same. What has changed, however, is the price we could have purchased them at. For example, Royal Bank (RY-T) and TD Bank (TD-T) have both found their way into our model portfolio on price weakness recently.

During our monthly reviews, we highlight companies on ‘The List’ that meet our minimum criteria of 6.5% EPS yield. Here is the screen from last Friday’s close:

Once a company shows up on our screen, we dive deeper to learn more about what is causing the price weakness and whether the current price meets our other valuation measures. If we like what we see, we enter a position. There are a few exciting candidates on ‘The List’ we are researching right now.

To find out when we buy or sell a position in our model portfolios, subscribe today and build your dividend growth portfolios alongside ours.

Performance of ‘The List’

Last week, ‘The List’ was down slightly with a minus -1.9% YTD price return (capital). Dividend growth of ‘The List’ remains at +10.2% YTD, demonstrating the rise in income over the last year.

The best performers last week on ‘The List’ were Alimentation Couche-Tard Inc. (ATD-T), up +4.19%; Metro (MRU-T), up +1.00%; and Waste Connections (WCN-N), up +0.65%.

Canadian National Railway (CNR-T) was the worst performer last week, down -4.7%.

Recent News

Bell to buy Distributel, the latest industry acquisition (Globe & Mail)

“Distributel has vocally opposed Bell in terms of wholesale rates and other arenas, like site blocking,” said Andy Kaplan-Myrth, vice-president of regulatory and carrier affairs for TekSavvy Solutions Inc., a telecom based in Chatham, Ont. “This acquisition is a clear loss of independence that will prevent them from taking those positions in the future.”

Interesting take on this latest acquisition from Bell Canada (BCE-T).  In 2019 the CRTC ruled in favour of a rate reduction that big telecoms could charge smaller internet service providers like Distributel. The big telecoms appealed, and the decision was reversed.

The CRTC was warned at that time that small internet service providers would not be able to compete if the prices were raised but chose to reverse the decision anyway.

“In a recent letter to the CRTC, TekSavvy renewed its warnings that small telecommunications companies would go out of business or be acquired in the current telecom landscape, leaving consumers with fewer options and higher bills. The company alleged in its letter that the big telecoms engage in predatory pricing, selling internet to their own flanker brands at cheaper rates than they charge independent competitors.”

As an investor, it appears Bell Canada (BCE-T) came out on top in this battle. One of our quality factors is market capitalization. With BCE-T having a market cap of ~60 billion dollars, they tend to have some added leverage in these disputes.

Bank of Canada expected to raise interest rate for fifth time at pivotal moment for economy (Globe & Mail)

“Inflation appears to have peaked but it’s still running hot and a supersized rate hike from the Bank of Canada next week is widely expected.”

The more expensive it is to borrow money, the less incentive there is for consumers and businesses to borrow and buy things. Central banks hope this will slow the economy and cool inflation. A slowing economy will affect earnings which then puts downward pressure on prices.

Good entry points (sensible prices) on our quality dividend growers could be getting closer!

Two companies on ‘The List’ are due to report earnings this week.  

Enghouse Systems Limited (ENGH-T) will release its third-quarter 2022 results on Thursday, September 8, 2022, after markets close.

Dollarama Inc. (DOL-T) will release its second-quarter 2023 results on Friday, September 9, 2022, before markets open.

Dividend Increases

Last week, there were no dividend increases from companies on ‘The List’.

Earnings Releases

One company on ‘The List’, Alimentation Couche-Tard Inc. (ATD-T), reported their first quarter 2023 earnings last week.  ATD-T is another of a handful of companies on ‘The List’ that follows an off-cycle reporting schedule

Alimentation Couche-Tard Inc. (ATD-T)

“In the face of continued and historic inflationary conditions and high fuel prices, we are pleased to report strong results this quarter, especially in convenience where we had healthy same stores sales in our U.S. market. We also continued to generate robust fuel margins across all of our platforms. In this period of high inflation and high prices, we remain focused on delivering a strong and consistent value to our customers and on maintaining cost discipline in our operations” said Brian Hannasch, President and Chief Executive Officer of Alimentation Couche-Tard.

Highlights:

  • Net earnings were $872.4 million, or $0.85 per diluted share for the first quarter of fiscal 2023 compared with $764.4 million, or $0.71 per diluted share for the first quarter of fiscal 2022. Adjusted net earnings1 were approximately $875.0 million compared with $758.0 million for the first quarter of fiscal 2022. Adjusted diluted net earnings per share1 were $0.85, representing an increase of 19.7% from $0.71 for the corresponding quarter of last year.
  • Total merchandise and service revenues of $4.1 billion, an increase of 0.1%. Same-store merchandise revenues increased by 3.5% in the United States, by 2.8% in Europe and other regions1, and decreased by 1.3% in Canada.
  • Merchandise and service gross margin1 decreased by 0.3% in the United States to 33.9%, and increased by 0.5% in Europe and other regions to 38.9%, and by 0.8% in Canada to 33.1%.
  • Same-store road transportation fuel volumes decreased by 4.0% in the United States, by 3.7% in Europe and other regions, and increased by 0.4% in Canada.
  • Road transportation fuel gross margin1 of 49.00¢ per gallon in the United States, an increase of 12.25¢ per gallon, US 12.26¢ per liter in Europe and other regions, an increase of US 1.94¢ per liter, and CA 14.04¢ per liter in Canada, an increase of CA 3.12¢ per liter. Fuel margins remained healthy throughout the network, due to favorable market conditions and the continued work on the optimization of the supply chain.
  • Despite the growth in expenses of 9.4%, the Corporation has deployed strategic efforts to mitigate costs increases and inflationary pressures, which is demonstrated by the normalized growth of expenses1 of 7.3%, remaining below inflation.
  • Sequential improvement of the leverage ratio1 at 1.31 : 1, and of the return on capital employed1 at 15.9%, both driven by strong earnings.
  • On April 22, 2022, the Corporation renewed its share repurchase program which allows it to repurchase up to 10.0% of the public float. Under the renewed program, shares for a net amount of $478.0 million were repurchased during the quarter.
  • On August 30, 2022, subsequent to the end of the quarter, the Corporation also announces that, following satisfaction of closing conditions, it has closed its proposed acquisition of Cape D’Or Holdings Limited, Barrington Terminals Limited and other related holding entities in Atlantic Canada.

Outlook:

Claude Tessier, Chief Financial Officer, added: “We delivered another impressive quarter highlighted by increases of 10.6% in adjusted EBITDA and 19.7% in adjusted diluted net earnings per share compared to the first quarter of fiscal 2022, bringing our last four quarters adjusted EBITDA to more than $5.4 billion. Our customary cost discipline, combined with an improving labor market, have allowed us to limit the normalized growth of expenses to 7.3%, compared to the first quarter of last year, more than 1% below inflation, which was particularly notable once again this quarter. Our financial position remains strong, highlighted by our leverage ratio1 of 1.31, providing us with opportunities for the future. I am especially proud of our teams’ execution this quarter which resulted in sequential improvements on both of our key return metrics.”

See the full Earnings Release here


Below is a snapshot of ‘The List’ from last Friday’s close. For a sortable version of ‘The List’, please click on The List menu item.

‘The List’ is not meant to be a template for investors to copy exactly. Instead, its purpose is to provide investment ideas and a real-time illustration of dividend growth investing in action. It is not a ‘Buy List’ nor does it reflect the composition or returns of our Magic Pants Wealth-Builder (CDN) Portfolio. It is only a starting point for our analysis and discussion.


The List (2022)
Last updated by BM on September 02, 2022

*Note: The following graph is wide, you can scroll to the right on your device to see more of the data.

SYMBOL COMPANY YLD PRICE YTD % DIV YTD % STREAK
AQN-N Algonquin Power & Utilities 5.1% $13.70 -4.5% $0.70 5.4% 11
ATD-T Alimentation Couche-Tard Inc. 0.7% $59.46 14.1% $0.44 18.1% 12
BCE-T Bell Canada 5.7% $63.57 -3.6% $3.64 4.0% 13
BIP-N Brookfield Infrastructure Partners 3.5% $41.18 1.1% $1.44 5.9% 14
CCL-B-T CCL Industries 1.5% $64.58 -4.7% $0.96 14.3% 20
CNR-T Canadian National Railway 1.9% $153.76 -0.7% $2.93 19.1% 26
CTC-A-T Canadian Tire 3.7% $157.65 -13.9% $5.85 24.5% 11
CU-T Canadian Utilities Limited 4.4% $40.24 9.9% $1.78 1.0% 50
DOL-T Dollarama Inc. 0.3% $80.29 26.6% $0.22 9.2% 11
EMA-T Emera 4.3% $61.31 -2.0% $2.65 2.9% 15
ENB-T Enbridge Inc. 6.3% $54.31 9.6% $3.44 3.0% 26
ENGH-T Enghouse Systems Limited 2.2% $32.07 -30.1% $0.72 16.3% 15
FNV-N Franco Nevada 1.1% $121.59 -10.7% $1.28 10.3% 14
FTS-T Fortis 3.7% $58.25 -3.7% $2.14 2.9% 48
IFC-T Intact Financial 2.1% $191.36 16.9% $4.00 17.6% 17
L-T Loblaws 1.3% $117.33 14.2% $1.54 12.4% 10
MGA-N Magna 3.2% $56.42 -30.8% $1.80 4.7% 12
MRU-T Metro 1.6% $70.77 5.6% $1.10 12.2% 27
RY-T Royal Bank of Canada 4.0% $123.04 -10.1% $4.96 14.8% 11
SJ-T Stella-Jones Inc. 2.0% $40.03 -1.6% $0.80 11.1% 17
STN-T Stantec Inc. 1.1% $61.52 -12.4% $0.71 6.8% 10
TD-T TD Bank 4.2% $85.53 -13.9% $3.56 12.7% 11
TFII-N TFI International 1.0% $103.31 -6.7% $1.08 12.5% 11
TIH-T Toromont Industries 1.5% $101.33 -10.9% $1.52 15.2% 32
TRP-T TC Energy Corp. 5.7% $63.11 5.7% $3.57 4.4% 21
T-T Telus 4.5% $29.71 -0.2% $1.33 6.2% 18
WCN-N Waste Connections 0.7% $140.55 4.8% $0.92 8.9% 12
Averages 2.9% -1.9% 10.2% 18

We buy quality individual dividend growth stocks when they are sensibly priced and hold for the growing income.