MP Market Review – March 25, 2022
Last updated by BM on March 28, 2022
“Risk comes from not knowing what you are doing.” – Warren Buffett
You could almost quote Warren Buffett every week. Buffett has been the source of so many valuable insights into investing during his lifetime that you can never go wrong reading anything he writes. It seems there is always some tidbit of wisdom no matter what the market is doing.
While others may see the current market as ‘risky’, we do not. We embrace these types of markets because it gives us more opportunities to execute our process. Our DGI strategy has built-in risk-reduction. Risk for us is more about what is in our portfolio and what we paid for it. Both of which we do well.
Dividend growth investing, although not without short-term price volatility, is inherently one of the best risk mitigation strategies you will find.
Performance of ‘The List’
‘The List’ metrics were the same as last week with a 2.0% YTD price return (capital) and dividend growth stabilizing at an average increase of 9.1% in income so far in fiscal 2022.
The best performers last week on ‘The List’ were TC Energy (TRP-T) up 5.2%; Canadian National Railway (CNR-T) up 3.2%; and Enbridge (ENB-T) up 2.4%.
CCL Industries (CCL-B-T) was the worst performer lasts week, down -4.7%.
There were no companies on ‘The List’ that announced an earnings release.
Recent News
The biggest news in Canada last week was the power-sharing deal announced between the Liberals and NDP. A political deal that will see the New Democratic Party prop up the minority Liberals until the next election.
In it, the Liberals appear more committed than ever to begin impacting the profits and earnings of some of Canada’s largest industries (Banks, REITs and Pharmacies to begin). The Banks will more than likely receive a surtax on profits over a certain amount and REITs, although details are not out yet, may not receive as favorable tax treatment as they do now. The national Pharmacare initiative, trumpeted by the NDP, could see pharmacies lose some of their earnings to the new program.
Last August, the Canadian Bankers Association criticized the Liberal plan for singling out financial services.
“The proposed tax increase would reduce income that would otherwise benefit the majority of Canadians who are bank shareholders, either directly through share ownership or indirectly through pension and mutual funds, including the Canada Pension Plan,” the group said in a statement at the time, adding that pension funds and RRSPs are some of the main beneficiaries of the billions of dollars that the banks pay in dividends each year.
Canadians own shares and receive dividends in pharmacies and REITs as well. We are never shocked when we hear about politicians screaming ‘tax the rich’ to get reelected or stay in power. It is a narrative we hear often today with very little substance to prove it even works in practice. Nonetheless, it is a short-term narrative that we will monitor closely for any opportunities within our portfolios.
One company on ‘The List’ is due to report earnings this week:
Dollarama Inc. (DOL-T) is scheduled to report earnings for Q4 and Fiscal Year 2022 before the market opens Wednesday, Mar. 30.
Dividend Increases
There were no dividend increases from companies on ‘The List’ this past week.
Earnings Releases
There were no earnings releases to report on this past week.
Below is a snapshot of ‘The List’ from last Friday’s close. For a sortable version of ‘The List’ please click on The List menu item.
‘The List’ is not meant to be a template for investors to copy exactly. Rather, its purpose is to provide investment ideas and a real-time illustration of dividend growth investing in action. It is not a ‘Buy List’ nor does it reflect the composition or returns of our Magic Pants Wealth-Builder CDN Portfolio. It is only a starting point for our analysis and discussion.
The List (2022)
Last updated by BM on March 25, 2022
*Note: The following graph is wide, you can scroll to the right on your device to see more of the data.
| SYMBOL | COMPANY | YLD | PRICE | YTD % | DIV | YTD % | STREAK |
|---|---|---|---|---|---|---|---|
| AQN-N | Algonquin Power & Utilities | 4.4% | $15.45 | 7.7% | $0.68 | 2.3% | 11 |
| ATD-T | Alimentation Couche-Tard Inc. | 0.8% | $54.30 | 4.2% | $0.44 | 18.1% | 12 |
| BCE-T | Bell Canada | 5.4% | $67.92 | 3.0% | $3.68 | 5.1% | 13 |
| BIP-N | Brookfield Infrastructure Partners | 3.4% | $64.06 | 4.9% | $2.16 | 5.9% | 14 |
| CCL-B-T | CCL Industries | 1.7% | $56.08 | -17.3% | $0.96 | 14.3% | 20 |
| CNR-T | Canadian National Railway | 1.7% | $169.73 | 9.6% | $2.93 | 19.1% | 26 |
| CTC-A-T | Canadian Tire | 2.8% | $186.41 | 1.8% | $5.20 | 10.6% | 11 |
| CU-T | Canadian Utilities Limited | 4.7% | $37.42 | 2.2% | $1.78 | 1.0% | 50 |
| DOL-T | Dollarama Inc. | 0.3% | $67.53 | 6.5% | $0.20 | 1.7% | 11 |
| EMA-T | Emera | 4.4% | $60.51 | -3.3% | $2.65 | 2.9% | 15 |
| ENB-T | Enbridge Inc. | 6.0% | $57.79 | 16.7% | $3.44 | 3.0% | 26 |
| ENGH-T | Enghouse Systems Limited | 1.8% | $39.71 | -13.4% | $0.72 | 16.3% | 15 |
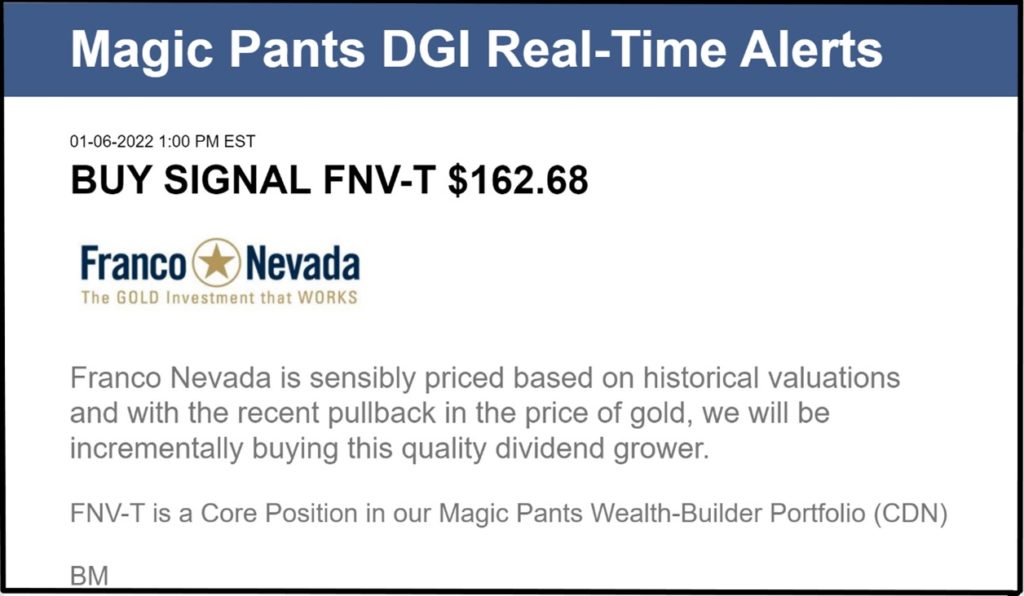
| FNV-N | Franco Nevada | 0.8% | $158.09 | 16.2% | $1.28 | 10.3% | 14 |
| FTS-T | Fortis | 3.5% | $60.33 | -0.2% | $2.14 | 4.4% | 48 |
| IFC-T | Intact Financial | 2.2% | $184.94 | 13.0% | $4.00 | 17.6% | 17 |
| L-T | Loblaws | 1.3% | $109.47 | 6.6% | $1.46 | 6.6% | 10 |
| MGA-N | Magna | 2.8% | $63.56 | -22.1% | $1.80 | 4.7% | 12 |
| MRU-T | Metro | 1.6% | $70.32 | 4.9% | $1.10 | 10.0% | 27 |
| RY-T | Royal Bank of Canada | 3.4% | $141.28 | 3.2% | $4.80 | 11.1% | 11 |
| SJ-T | Stella-Jones Inc. | 2.1% | $37.95 | -6.7% | $0.80 | 11.1% | 17 |
| STN-T | Stantec Inc. | 1.1% | $63.00 | -10.2% | $0.71 | 6.8% | 10 |
| TD-T | TD Bank | 3.5% | $101.81 | 2.5% | $3.56 | 12.7% | 11 |
| TFII-T | TFI International | 1.0% | $131.43 | -6.2% | $1.36 | 17.4% | 11 |
| TIH-T | Toromont Industries | 1.3% | $114.58 | 0.8% | $1.52 | 15.2% | 32 |
| TRP-T | TC Energy Corp. | 4.9% | $72.37 | 21.2% | $3.57 | 4.4% | 21 |
| T-T | Telus | 4.1% | $32.12 | 7.9% | $1.31 | 4.4% | 18 |
| WCN-N | Waste Connections | 0.7% | $134.88 | 0.6% | $0.92 | 8.9% | 12 |
| Averages | 2.7% | 2.0% | 9.1% | 18 |