“You have a pair of pants. In the left pocket, you have $100. You take $1 out of the left pocket and put in the right pocket. You now have $101. There is no diminution of dollars in your left pocket. That is one magic pair of pants.”

MP Market Review – December 29, 2023

Last updated by BM on January 1, 2024

Summary 

  • This is a weekly installment of our MP Market Review series, which provides updates on the financial markets and Canadian dividend growth companies we monitor on ‘The List’.
  • Last week, ‘The List’ was up with a 2023 price return of +5.8% (capital). Dividends increased by +8.7% in 2023, highlighting the growth in the dividend (income).
  • Last week, there were no dividend announcements from companies on ‘The List’.
  • Last week, there were no earnings reports from companies on ‘The List’.
  • No companies on ‘The List’ are due to report earnings this week.

The List (2023)

The Magic Pants List includes 27 Canadian dividend growth stocks. Each has raised their dividend annually for the last ten years (or longer) and has a market cap of over a billion dollars. Based on these criteria, companies on ‘The List’ are added or removed annually, on January 1. Prices and dividends are updated weekly.

While ‘The List’ does not function as a portfolio on its own, it serves as an excellent initial reference for individuals looking to diversify their investments and achieve higher returns in the Canadian stock market. Through our newsletter, readers gain a deeper understanding of how to implement and benefit from our Canadian dividend growth investing strategy.

If you’re interested in creating your own dividend growth income portfolio, consider subscribing to our premium service. Subscribers gain access to buy/sell alerts and exclusive content available only to subscribers.

Performance of ‘The List’

Last week, ‘The List’ was up with a 2023 price return of +5.8% (capital). Dividends increased by +8.7% in 2023, highlighting the dividend (income) growth over the last calendar year.

The best performers last week on ‘The List’ were TFI International (TFII-N), up +2.77%; Metro (MRU-T), up +1.96%; and Stantec Inc. (STN-T), up +1.82%.

TC Energy Corp. (TRP-T) was the worst performer last week, down -2.36%.

SYMBOL COMPANY YLD PRICE YTD % DIV YTD % STREAK
AQN-N Algonquin Power & Utilities 8.0% $6.32 -6.1% $0.51 -29.0% 12
ATD-T Alimentation Couche-Tard Inc. 0.8% $76.76 27.6% $0.60 26.8% 13
BCE-T Bell Canada 7.4% $52.17 -13.4% $3.87 5.2% 14
BIP-N Brookfield Infrastructure Partners 4.4% $31.49 0.5% $1.44 6.3% 15
CCL-B-T CCL Industries 1.8% $59.59 2.7% $1.06 10.4% 21
CNR-T Canadian National Railway 1.9% $166.55 2.3% $3.16 7.8% 27
CTC-A-T Canadian Tire 4.9% $140.72 -4.0% $6.90 17.9% 12
CU-T Canadian Utilities Limited 5.6% $31.89 -13.7% $1.79 1.0% 51
DOL-T Dollarama Inc. 0.3% $95.49 19.6% $0.27 23.8% 12
EMA-T Emera 5.5% $50.30 -4.4% $2.79 4.0% 16
ENB-T Enbridge Inc. 7.4% $47.70 -10.6% $3.55 3.2% 27
ENGH-T Enghouse Systems Limited 2.4% $35.10 -1.7% $0.85 18.2% 16
FNV-N Franco Nevada 1.2% $110.81 -19.8% $1.36 6.3% 15
FTS-T Fortis Inc. 4.2% $54.51 -1.5% $2.29 5.3% 49
IFC-T Intact Financial 2.2% $203.86 4.1% $4.40 10.0% 18
L-T Loblaws 1.4% $128.28 6.6% $1.74 10.3% 11
MGA-N Magna 3.1% $59.08 2.7% $1.84 2.2% 13
MRU-T Metro 1.8% $68.59 -9.1% $1.21 10.0% 28
RY-T Royal Bank of Canada 4.0% $134.00 4.7% $5.34 7.7% 12
SJ-T Stella-Jones Inc. 1.2% $77.12 55.5% $0.92 15.0% 18
STN-T Stantec Inc. 0.7% $106.38 62.8% $0.77 8.5% 11
TD-T TD Bank 4.5% $85.62 -2.3% $3.84 7.9% 12
TFII-N TFI International 1.1% $135.98 35.8% $1.45 25.0% 12
TIH-T Toromont Industries 1.5% $116.10 18.8% $1.72 10.3% 33
TRP-T TC Energy Corp. 7.2% $51.76 -2.9% $3.72 3.3% 22
T-T Telus Corp. 6.1% $23.58 -10.4% $1.43 7.3% 19
WCN-N Waste Connections 0.7% $149.27 13.3% $1.05 10.5% 13
Averages 3.4% 5.8% 8.7% 19

Six Canadian stocks on ‘The List’ declare earnings and dividends in US dollars and are inter-listed on a US exchange in US dollars. The simplest way to display dividend and price metrics for these stocks is to show their US exchange symbols along with their US dividends and price. The stocks I am referring to have a -N at the end of their symbols. You can still buy their Canadian counterparts (-T), but your dividends will be converted into CDN dollars and will fluctuate based on the exchange rate.

DGI Clipboard

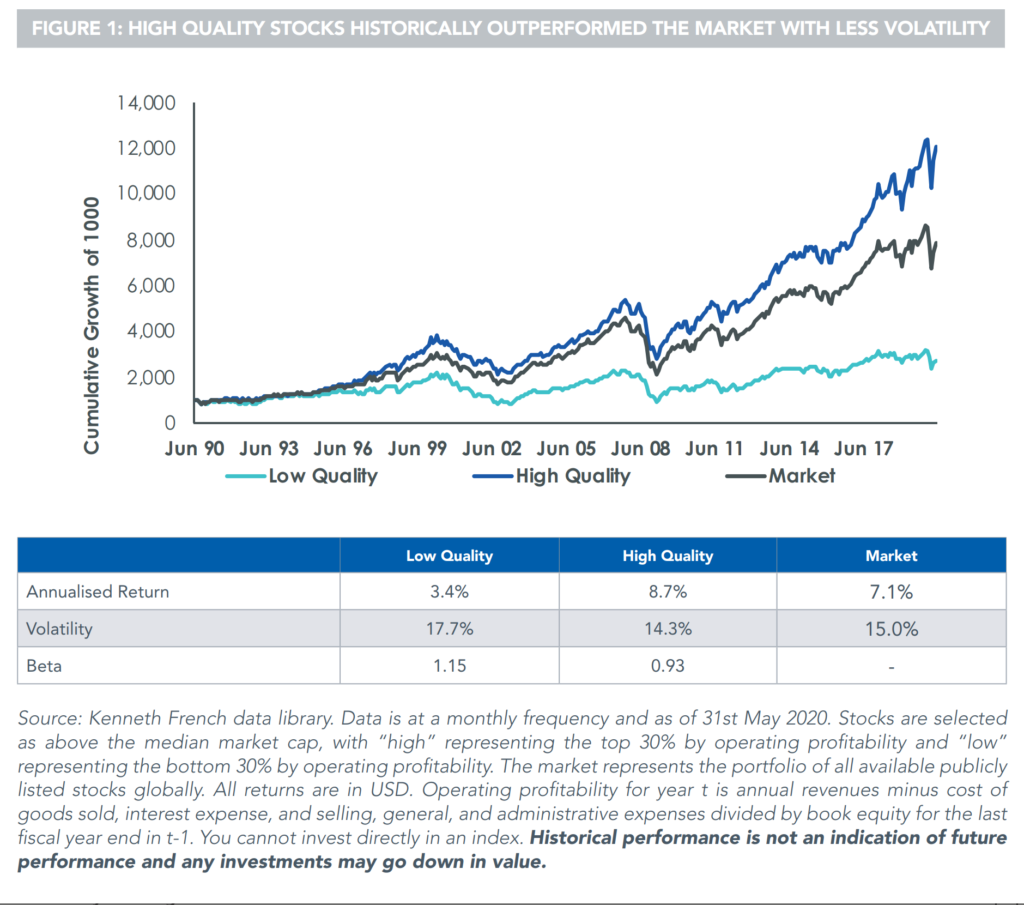
“If you look for companies that can raise their dividends year after year without milking operations, you will automatically be lead to high quality stocks.” 

– Edmund Faltermayer, Fortune magazine, October 1990

Our watchlist of the top Canadian dividend growth stocks for 2024

The year 2023 is now in the past. Last week, I presented the criteria for constructing our watchlist:

  1. Dividend growth streak: 10 years or more.
  2. Market cap: Minimum one billion dollars.
  3. Diversification: Limit of five companies per sector, preferably two per industry.
  4. Cyclicality: Exclude REITs and pure-play energy companies due to high cyclicality.

While ‘The List’ does not function as a portfolio on its own, it serves as an excellent initial reference for individuals looking to diversify their investments and achieve higher returns in the Canadian stock market. Through our newsletter, readers gain a deeper understanding of how to implement and benefit from our Canadian dividend growth investing strategy.

Here is ‘The List’ for 2024:

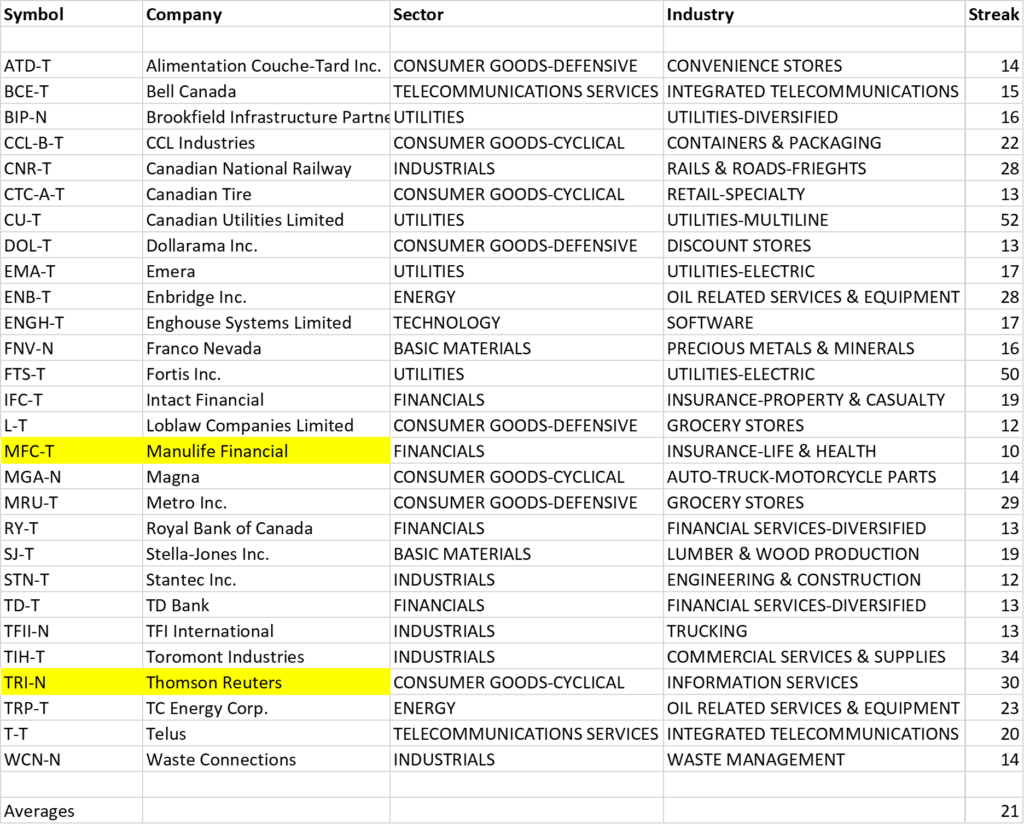
We have removed Algonquin Power & Utilities (AQN-N) from ‘The List’ as it reduced its dividend in 2023 and no longer qualifies. In its place, we have added two new companies: Manulife Financial (MFC-T) and Thomson Reuters (TRI-N) for 2024.

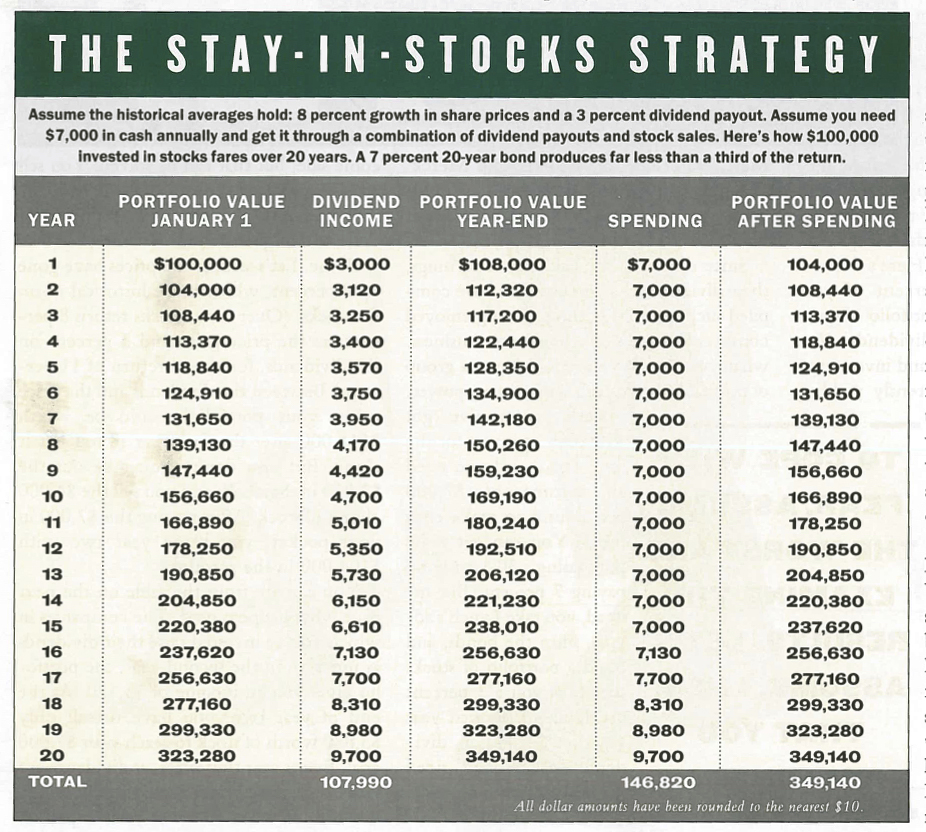
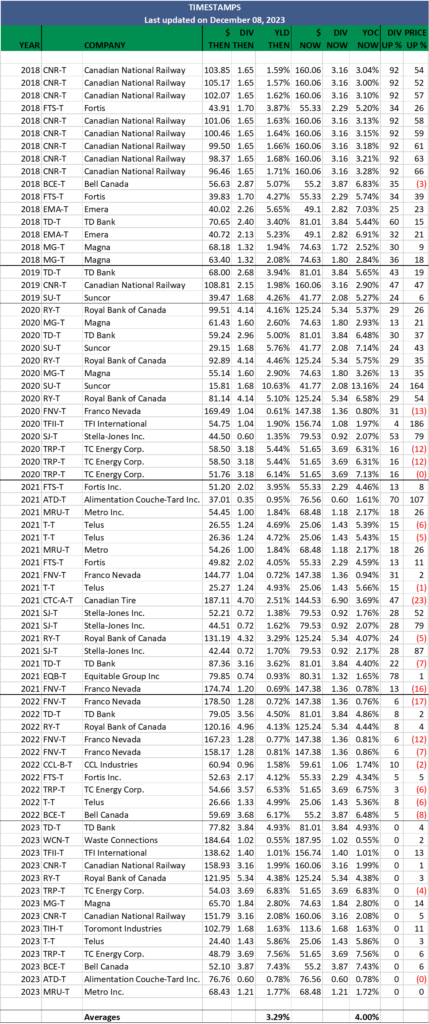
Manulife Financial recently met our minimum criteria of 10 consecutive years of dividend growth, transforming itself from a high-yield, slow-growth life insurance company to one with a high-growth global wealth and asset management business. Manulife boasts a ten-year dividend growth streak, starting with a yield of 5.0% and a 10-year annualized dividend growth rate of approximately 10%. Over the past decade, it has proven to be an above-average income generator, with a historical growth yield (yield on cost) of 7% on a purchase made ten years ago. Holding onto strong dividend growers for the long term can indeed surpass average historical market returns with dividends alone.

Thomson Reuters was previously on ‘The List’ but exhibited more characteristics of a ‘growth-only’ stock due to its sluggish dividend growth. However, the company has recently accelerated its dividend growth rate at a double-digit pace, prompting us to reinstate it on ‘The List.’ We are also optimistic about the company’s significant investments in artificial intelligence in its product offerings and acquisitions. Thomson Reuters holds a thirty-year dividend growth streak, starting with a yield of 1.3%, and a 5-year annualized dividend growth rate of approximately 5.3%. It has delivered above-average total returns (15.7% CAGR) over the past decade, challenging the notion that market-beating returns are impossible with a dividend growth investing strategy.

Under our set criteria, companies on ‘The List’ are reviewed annually on January 1, leading to additions or removals. Weekly updates ensure that prices and dividends remain current. ‘The List’ for 2024 comprises 28 companies strategically diversified across nine sectors within the Canadian economy.

If you have not yet joined as a paid subscriber of the blog to receive DGI Alerts on the activity and content related to our model portfolio, it’s not too late. Click Here. 

Recent News 

After a long period of low rates, the time has come for older investors to be even more prudent (Globe & Mail)

https://www.theglobeandmail.com/investing/investment-ideas/article-after-a-long-period-of-low-rates-the-time-has-come-for-older-investors/

This former portfolio manager with four decades of experience had this familiar advice for older investors:

In order to protect their nest eggs when there is less time to bounce back from losses, older investors should decrease their equity exposure and increase the income portion, particularly in their bond weightings.”

How often have we encountered the recommendation to shift our portfolios towards a 60/40 split between equities and bonds as retirement approaches? The reality is that over time, losses in bonds tend to surpass those in any stock market correction.

I think my mentor, Tom Connolly, said it best:

“If you are new to dividend growth investing and hold a few bonds, I’d keep them for a while…until the dividend income starts to grow…until you realize what’s going on. Once your growth yield (yield on cost) gets close to the yield on your bonds, you’ll know what to do.”

First Quantum Comments on Developments in Panama (Franco Nevada Corporation Royalty Stream)

https://www.first-quantum.com/English/announcements/announcements-details/2023/First-Quantum-Provides-Update-on-Cobre-Panama/default.aspx

In a surprise ruling on November 28, 2023, the Supreme Court of Panama has ruled that the agreement (Law 406) between the government and the mines owner, First Quantum Minerals, was unconstitutional and the agreement is void. As of now, there will be a transition process for the closure of the Cobre Panama mine.

Franco-Nevada management has stated that in the event of a prolonged dispute, the mine operators would likely opt for arbitration to settle the matter. This is precisely what transpired.

First Quantum Minerals has formally notified the government of its intent to commence arbitration to uphold its rights under international law as per the Canada-Panama Free Trade Agreement. Additionally, First Quantum has initiated arbitration proceedings before the International Court of Arbitration to safeguard its rights under the 2023 concession agreement, endorsed by the Government of Panama earlier this year. The arbitration agreement specifies Miami, Florida, as the venue for arbitration. Historically, international arbitrators have tended to rule in favor of mining companies in similar disputes.

Although the past month has been frustrating for investors, the current stock price of Franco-Nevada now reflects the complete write-off of the Cobre Panama royalty stream. We believe this reaction is overdone, and the decision will likely be reversed for several reasons.

Next year’s elections (May 2024) will significantly influence the resolution. The mine contributes approximately 5% to the country’s GDP and supports at least 40,000 jobs. The new government is unlikely to overlook this critical political and revenue source. Additionally, this is not the first occurrence of such a situation. In 2017, the agreement between the mine and its owner was declared unconstitutional, and the decision was subsequently reversed.

We will keep our subscribers informed of any new developments.

Dividend Increases

“The growth of dividend paying ability is of significance in the determination of a stock’s quality, or general safety…”

– Arnold Bernhard (the founder of Value Line)

No companies on ‘The List’ had dividend announcements last week.


Earnings Releases

Benjamin Graham once remarked that earnings are the principal factor driving stock prices.

Each quarter, we will provide readers with weekly earnings updates of stocks on ‘The List’ during the calendar earnings season. 

The updated earnings calendar can be found here.

No earnings reports from companies on ‘The List’ this week

Last week, there were no earnings reports from companies on ‘The List’.


MP Market Review – December 22, 2023

Last updated by BM on December 25, 2023

Summary 

  • This is a weekly installment of our MP Market Review series, which provides updates on the financial markets and Canadian dividend growth companies we monitor on ‘The List’.
  • Last week, ‘The List’ was up with a YTD price return of +5.1% (capital). Dividends have increased by +9.1% YTD, highlighting the growth in the dividend (income).  
  • Last week, there were no dividend announcements from companies on ‘The List’.
  • Last week, there were no earnings reports from companies on ‘The List’.
  • No companies on ‘The List’ are due to report earnings this week. 

The List (2023)

The Magic Pants List includes 27 Canadian dividend growth stocks. Each has raised their dividend annually for the last ten years (or longer) and has a market cap of over a billion dollars. Based on these criteria, companies on ‘The List’ are added or removed annually, on January 1. Prices and dividends are updated weekly.

While ‘The List’ does not function as a portfolio on its own, it serves as an excellent initial reference for individuals looking to diversify their investments and achieve higher returns in the Canadian stock market. Through our newsletter, readers gain a deeper understanding of how to implement and benefit from our Canadian dividend growth investing strategy.

If you’re interested in creating your own dividend growth income portfolio, consider subscribing to our premium service. Subscribers gain access to buy/sell alerts and exclusive content available only to subscribers.

Performance of ‘The List’

Last week, ‘The List’ was up with a YTD price return of +5.1% (capital). Dividends have increased by +9.1% YTD, highlighting the growth in the dividend (income).

The best performers last week on ‘The List’ were TFI International (TFII-N), up +11.43%; Loblaws (L-T), up +6.31%; and Brookfield Infrastructure Partners (BIP-N), up +5.21%.

Telus Corp. (T-T) was the worst performer last week, down -2.80%.

SYMBOL COMPANY YLD PRICE YTD % DIV YTD % STREAK
AQN-N Algonquin Power & Utilities 7.9% $6.44 -4.3% $0.51 -29.0% 12
ATD-T Alimentation Couche-Tard Inc. 0.8% $76.76 27.6% $0.60 26.6% 13
BCE-T Bell Canada 7.5% $51.41 -14.6% $3.87 5.2% 14
BIP-N Brookfield Infrastructure Partners 4.4% $31.68 1.1% $1.44 6.3% 15
CCL-B-T CCL Industries 1.8% $59.70 2.8% $1.06 10.4% 21
CNR-T Canadian National Railway 1.9% $165.67 1.7% $3.16 7.8% 27
CTC-A-T Canadian Tire 4.9% $139.97 -4.5% $6.90 17.9% 12
CU-T Canadian Utilities Limited 5.7% $31.48 -14.8% $1.79 1.0% 51
DOL-T Dollarama Inc. 0.3% $94.19 17.9% $0.27 23.8% 12
EMA-T Emera 5.7% $49.43 -6.1% $2.82 5.0% 16
ENB-T Enbridge Inc. 7.4% $47.82 -10.3% $3.55 3.2% 27
ENGH-T Enghouse Systems Limited 2.4% $35.51 -0.6% $0.85 18.2% 16
FNV-N Franco Nevada 1.2% $111.24 -19.5% $1.36 6.3% 15
FTS-T Fortis Inc. 4.2% $53.96 -2.5% $2.29 5.3% 49
IFC-T Intact Financial 2.2% $200.23 2.3% $4.40 10.0% 18
L-T Loblaws 1.4% $126.06 4.8% $1.74 13.2% 11
MGA-N Magna 3.1% $59.03 2.6% $1.84 2.2% 13
MRU-T Metro 1.8% $67.27 -10.9% $1.21 12.0% 28
RY-T Royal Bank of Canada 4.0% $133.67 4.4% $5.34 7.7% 12
SJ-T Stella-Jones Inc. 1.2% $75.93 53.1% $0.92 15.0% 18
STN-T Stantec Inc. 0.7% $104.48 59.9% $0.77 8.5% 11
TD-T TD Bank 4.5% $85.12 -2.9% $3.84 7.9% 12
TFII-N TFI International 1.1% $132.32 32.1% $1.40 29.6% 12
TIH-T Toromont Industries 1.5% $115.63 18.3% $1.68 10.5% 33
TRP-T TC Energy Corp. 7.0% $53.01 -0.5% $3.69 3.4% 22
T-T Telus Corp. 6.1% $23.29 -11.5% $1.43 7.4% 19
WCN-N Waste Connections 0.7% $147.33 11.9% $1.05 10.5% 13
Averages 3.4% 5.1% 9.1% 19

Six Canadian stocks on ‘The List’ declare earnings and dividends in US dollars and are inter-listed on a US exchange in US dollars. The simplest way to display dividend and price metrics for these stocks is to show their US exchange symbols along with their US dividends and price. The stocks I am referring to have a -N at the end of their symbols. You can still buy their Canadian counterparts (-T), but your dividends will be converted into CDN dollars and will fluctuate based on the exchange rate.

DGI Clipboard

“Success in investing begins with a watchlist – the carefully chosen stocks that have the potential to transform your financial future.”

– Anonymous

Making ‘The List’ and checking it twice

Many of the most important concepts I learned about running a business came from two of my mentors, Bill Gates and Warren Buffett. Both Gates and Buffett believe that focus, concentration on key goals, and the ability to say “no” to distractions are crucial elements in achieving success in their respective fields.

Creating a focused watchlist helps me stay invested and reduces distractions compared to following the entire market. It simplifies updating key metrics regularly and gaining a deeper understanding of selected companies. Starting the year with a watchlist of Canadian dividend growth stocks, I monitor their performance over twelve months to identify potential investment candidates, although I may not invest in all of them.

To begin our selection, we start with a review of the listed companies on The Toronto Stock Exchange (TSX). The TSX is one of the world’s largest stock exchanges and the third largest in North America. It is home to over 1500 companies across all sectors of the Canadian economy.

‘The List’ criteria are simple:

  1. Dividend growth streak: 10 years or more.
  2. Market cap: Minimum one billion dollars.
  3. Diversification: Limit of five companies per sector, preferably two per industry.
  4. Cyclicality: Exclude REITs and pure-play energy companies due to high cyclicality.

By screening for the first two criteria, ten years of consecutive dividend growth and a market cap of one billion dollars or more, we winnow our candidates down to only 57 companies (less than 4% of the companies on the TSX).

We delve into the last two criteria, diversification, and cyclicality, aiming for our list to represent the Canadian economy and serve as a coaching tool for our DGI strategy. Many Canadian investors are overly concentrated in a few sectors or tend to chase trends, resulting in diminished returns during economic shifts. Applying these criteria enables us to compare companies within a sector using quality indicators, resulting in approximately 30 companies on ‘The List’ (2% of TSX-listed companies).

One of the first things I learned about dividend growth investing (DGI) is that it is a risk-reduction strategy. By its nature, DGI forces investors into higher-quality names. After all, for a company’s management to commit to a dividend payout policy, the company needs to generate cash to pay the dividends. As it turns out, high-quality companies are more likely to be profitable and generate cash to pay dividends consistently.

Not all stocks on ‘The List’ will enter our MP Wealth-Builder Model Portfolio (CDN), but the majority will. Clearly defining your goals and objectives makes ‘The List’ an excellent starting point for any DGI journey.

I prefer keeping ‘The List’ under 30 companies for easier monitoring of quality dividend growers. Last year, it comprised 27 stocks. I rarely remove any the next year unless they don’t meet our initial criteria or undergo a significant business model change. For instance, Algonquin Power & Utilities Corp. (AQN-N) cut its dividend last year. As a result, (AQN-N) will be removed from the list in 2024, and at least one new stock will be added.

Although the markets can be volatile and price growth uncertain in the short term, the same is not true about dividend growth. Dividend growth is highly predictable. Since I have been creating a public watchlist, the average dividend growth of the companies on ‘The List’ has far exceeded inflation. This growing and inflation-protected income is one of the more magical things about a dividend growth investing strategy.

Next week, I will unveil ‘The List’ for 2024.

If you have not yet joined as a paid subscriber of the blog to receive DGI Alerts on the activity and content related to our model portfolio, it’s not too late. Click Here. 

Recent News 

Dividend portfolios: the gift that keeps on giving (Globe & Mail)

https://www.theglobeandmail.com/investing/markets/inside-the-market/article-dividend-portfolios-the-gift-that-keeps-on-giving/

Opening Christmas presents is a treat for children, but these days I’d rather have my stocking stuffed with dividends and kept well away from the fire. After all, dividends can pay for a comfortable retirement and many happy holidays.”

All of the dividend portfolios the author tracks have outperformed the index over the long term.

Tiff Macklem isn’t ready to bring the same holiday cheer that Jay Powell is (Globe & Mail)

https://www.theglobeandmail.com/business/commentary/article-tiff-macklem-isnt-ready-to-bring-the-same-holiday-cheer-that-jay/

“It’s still too early to consider cutting our policy rate,” he said. “Until we see evidence that we are clearly on a path back to two-per-cent inflation, I expect Governing Council will continue to debate whether monetary policy is restrictive enough, and how long it needs to remain restrictive to restore price stability.”

According to the author, Canada’s declining productivity gives Mr. Macklem less wiggle room than Cousin Jay south of the border and less likely to let his policy guard down anytime soon.

Canadian logistics firm TFI International to buy Daseke in $1.1-billion deal, including debt (Globe & Mail)

https://www.theglobeandmail.com/business/article-canadian-logistics-firm-tfi-international-to-buy-daseke-in-11-billion/

“The combined company’s truckload segment is expected to generate about $3.6 billion in annual total revenue on a pro forma basis and would become one of the largest truckload businesses in Canada, TFI said.”

TFI International has been an excellent total return performer. Growing through strategic acquisitions and integrating them well has been how this quality dividend grower continues to outperform its peers.

Dividend Increases

“The growth of dividend paying ability is of significance in the determination of a stock’s quality, or general safety…”

– Arnold Bernhard (the founder of Value Line)

No companies on ‘The List’ had dividend announcements last week.


Earnings Releases

Benjamin Graham once remarked that earnings are the principal factor driving stock prices.

Each quarter, we will provide readers with weekly earnings updates of stocks on ‘The List’ during the calendar earnings season. 

The updated earnings calendar can be found here.

No earnings reports from companies on ‘The List’ this week

Last week, there were no earnings reports from companies on ‘The List’.


MP Market Review – December 15, 2023

Last updated by BM on December 18, 2023

Summary 

  • This is a weekly installment of our MP Market Review series, which provides updates on the financial markets and Canadian dividend growth companies we monitor on ‘The List’.
  • Last week, ‘The List’ was down with a YTD price return of +3.0% (capital). Dividends have increased by +9.1% YTD, highlighting the growth in the dividend (income).  
  • Last week, there were no dividend announcements from companies on ‘The List’.
  • Last week, there were two earnings reports from companies on ‘The List’.
  • No companies on ‘The List’ are due to report earnings this week. 

The List (2023)

The Magic Pants List includes 27 Canadian dividend growth stocks. Each has raised their dividend annually for the last ten years (or longer) and has a market cap of over a billion dollars. Based on these criteria, companies on ‘The List’ are added or removed annually, on January 1. Prices and dividends are updated weekly.

While ‘The List’ does not function as a portfolio on its own, it serves as an excellent initial reference for individuals looking to diversify their investments and achieve higher returns in the Canadian stock market. Through our newsletter, readers gain a deeper understanding of how to implement and benefit from our Canadian dividend growth investing strategy.

If you’re interested in creating your own dividend growth income portfolio, consider subscribing to our premium service. Subscribers gain access to buy/sell alerts and exclusive content available only to subscribers.

Performance of ‘The List’

Last week, ‘The List’ was down with a YTD price return of +3.0% (capital). Dividends have increased by +9.1% YTD, highlighting the growth in the dividend (income).

The best performers last week on ‘The List’ were Brookfield Infrastructure Partners (BIP-N), up +6.92%; Algonquin Power & Utilities (AQN-N), up +6.59%; and Waste Connections (WCN-N), up +5.12%.

Dollarama Inc. (DOL-T) was the worst performer last week, down -9.68%.

SYMBOL COMPANY YLD PRICE YTD % DIV YTD % STREAK
AQN-N Algonquin Power & Utilities 7.8% $6.47 -3.9% $0.51 -29.0% 12
ATD-T Alimentation Couche-Tard Inc. 0.8% $76.76 27.6% $0.60 26.6% 13
BCE-T Bell Canada 7.5% $51.78 -14.0% $3.87 5.2% 14
BIP-N Brookfield Infrastructure Partners 4.4% $30.11 -3.9% $1.44 6.3% 15
CCL-B-T CCL Industries 1.8% $58.73 1.2% $1.06 10.4% 21
CNR-T Canadian National Railway 2.0% $161.01 -1.1% $3.16 7.8% 27
CTC-A-T Canadian Tire 4.9% $141.56 -3.4% $6.90 17.9% 12
CU-T Canadian Utilities Limited 5.7% $31.70 -14.2% $1.79 1.0% 51
DOL-T Dollarama Inc. 0.3% $90.00 12.7% $0.27 23.8% 12
EMA-T Emera 5.7% $49.56 -5.8% $2.82 5.0% 16
ENB-T Enbridge Inc. 7.5% $47.36 -11.2% $3.55 3.2% 27
ENGH-T Enghouse Systems Limited 2.4% $34.68 -2.9% $0.85 18.2% 16
FNV-N Franco Nevada 1.2% $111.11 -19.6% $1.36 6.3% 15
FTS-T Fortis Inc. 4.2% $54.89 -0.8% $2.29 5.3% 49
IFC-T Intact Financial 2.2% $200.24 2.3% $4.40 10.0% 18
L-T Loblaws 1.5% $118.58 -1.5% $1.74 13.2% 11
MGA-N Magna 3.2% $56.66 -1.5% $1.84 2.2% 13
MRU-T Metro 1.8% $65.53 -13.2% $1.21 12.0% 28
RY-T Royal Bank of Canada 4.1% $131.39 2.6% $5.34 7.7% 12
SJ-T Stella-Jones Inc. 1.3% $72.78 46.8% $0.92 15.0% 18
STN-T Stantec Inc. 0.8% $101.95 56.1% $0.77 8.5% 11
TD-T TD Bank 4.6% $83.52 -4.7% $3.84 7.9% 12
TFII-N TFI International 1.2% $118.75 18.6% $1.40 29.6% 12
TIH-T Toromont Industries 1.5% $113.55 16.2% $1.68 10.5% 33
TRP-T TC Energy Corp. 7.1% $52.00 -2.4% $3.69 3.4% 22
T-T Telus Corp. 6.0% $23.96 -9.0% $1.43 7.4% 19
WCN-N Waste Connections 0.7% $145.41 10.4% $1.05 10.5% 13
Averages 3.4% 3.0% 9.1% 19

Six Canadian stocks on ‘The List’ declare earnings and dividends in US dollars and are inter-listed on a US exchange in US dollars. The simplest way to display dividend and price metrics for these stocks is to show their US exchange symbols along with their US dividends and price. The stocks I am referring to have a -N at the end of their symbols. You can still buy their Canadian counterparts (-T), but your dividends will be converted into CDN dollars and will fluctuate based on the exchange rate.

DGI Clipboard

“The dividend is such an important factor in the success of many stocks, that you could hardly go wrong by making an entire portfolio of companies that have raised their dividends for 10 to 20 years in a row.”

Peter Lynch, Beating the Street p. 49

Spend income not capital

Renowned investor and author Peter Lynch advocated for dividend growth companies, demonstrating in a chart how an investor could annually withdraw 7% in an all-stock portfolio without depleting their funds. The chart highlights the flexibility in retirement funding choices.

For years, financial planners have promoted the ‘4% Rule’ in retirement planning. Switching to a 60/40 mix of bonds and stocks and withdrawing 4% of your hard-earned capital increases the likelihood of outliving your money. For many, this necessitates significant savings during their working years and some sleepless nights in retirement as their income stops growing and they rely more and more on capital performance.

Lynch grasped how dividends drive portfolio performance, and his ‘Stay in Stocks’ strategy emphasizes this belief. Many financial planners overlook that dividend companies are safer and continue to grow their dividends in retirement, making them more attractive than other stocks or fixed income as a source of growing income.

Nevertheless, a study on withdrawal strategies, that encapsulated seventy-one “rolling” twenty-year periods, concluded that there is still a chance of your portfolio balance falling to zero along the way. Lynch’s returns and strategy were based on averages, and as we know, that can sometimes backfire, as evidenced in this study, occurring 15% of the time.

By incorporating one change, the study’s author found that he could increase the success of Lynch’s ‘Stay in Stocks’ strategy to 100%. This change, termed the ‘90% Balance Rule,’ stipulates that if, after the income withdrawal is taken at the end of each year, the portfolio balance falls below 90% of the original starting amount, the annual withdrawal is reduced by 50%. In subsequent years, the portfolio balance is monitored for a rise back above 90% of the original starting amount, at which point a 7% income withdrawal can be reinstated.

Applying the ‘90% Balance Rule’ over all 20-year periods of the test sample resulted in 96% of finishing portfolio balances ending above the initial starting level with no portfolio failures. Another notable observation was that a high majority (82%) of the twenty-year periods required none or only one reduction in the withdrawal rate.

The author recommends that investors may want to take additional steps to compensate for a period of lower income derived from reduced withdrawal rates, such as building a ‘safe money’ bucket or having access to other sources of backup income.

While sustaining oneself solely on dividend income, without capital withdrawals, is achievable for some, for the majority, a DGI plan that combines both income and capital withdrawals while preserving the original capital, and incorporating the ‘90% Balance Rule,’ may be more realistic.

If you have not yet joined as a paid subscriber of the blog to receive DGI Alerts on the activity and content related to our model portfolio, it’s not too late. Click Here. 

Recent News 

U.S. Federal Reserve keeps key interest rate unchanged, foresees three cuts next year (Globe & Mail)

https://www.theglobeandmail.com/business/international-business/us-business/article-us-federal-reserve-may-shed-light-on-prospects-for-rate-cuts-in-2024/

On Wednesday, the Federal Reserve maintained steady rates and hinted at potential interest rate cuts next year. However, on Friday, there was a market pullback. The stock market’s volatility is evident – investors oscillate between optimism and pessimism. It’s crucial to avoid being swayed by these fluctuations and instead concentrate on the fundamentals of quality companies. Focus on earnings, dividends, and outlooks for a more accurate signal of the market’s direction.

Everyone knows stock market predictions are awful. So why make them and should investors care? (Globe & Mail)

https://www.theglobeandmail.com/investing/personal-finance/household-finances/article-everyone-knows-stock-market-predictions-are-awful-so-why-make-them-and/

“I looked at 10 different firms’ one-year forecasts for the S&P 500 over the past 10 years and found that every single one of them missed the mark by more than 10 percentage points per year, on average.”

Expect many inaccurate short-term stock market prediction articles. Favor a long-term investment strategy aligned with historical success for goal achievement.

Dollarama profit jumps 31.4% as shoppers continue to look to discount retailers for inflation relief (Globe & Mail)

https://www.theglobeandmail.com/business/article-dollarama-profit-jumps-314-as-shoppers-continue-to-look-to-discount/

Dollarama’s recent earnings report had positive aspects, yet the stock declined nearly 10% last week. Analysts view the company as fully valued after a remarkable performance. If the pullback is excessive, investors could find an opportunity to purchase shares in this reputable retailer at a reasonable price.

Dividend Increases

“The growth of dividend paying ability is of significance in the determination of a stock’s quality, or general safety…”

– Arnold Bernhard (the founder of Value Line)

No companies on ‘The List’ had dividend announcements last week.


Earnings Releases

Benjamin Graham once remarked that earnings are the principal factor driving stock prices.

Each quarter, we will provide readers with weekly earnings updates of stocks on ‘The List’ during the calendar earnings season. 

The updated earnings calendar can be found here.

No earnings reports from companies on ‘The List’ this week

Last week, there were two earnings reports from companies on ‘The List’.

Dollarama Inc. (DOL-T) released its third-quarter fiscal 2024 results before markets opened on Wednesday, December 13, 2023. 

“Sustained consumer demand for our broad range of affordable everyday products and strong execution in the third quarter of Fiscal 2024 drove double-digit same store sales growth for a sixth consecutive quarter as well as over 31% earnings per share growth. Our financial and operational performance year-to-date reflects the strength and relevance of our value proposition and business model in a challenging macro-economic context.”

– Neil Rossy, President and Chief Executive Officer

Highlights:

  • 1% increase in comparable store sales
  • 0% growth in EBITDA to $478.8 million, or 32.4% of sales
  • Diluted net earnings per common share up 31.4% to $0.92
  • Fiscal 2024 guidance for comparable store sales growth increased to between 11.0% to 12.0%

Outlook:

Based on our performance fiscal year-to-date and assuming continued positive customer response to our product offering, value proposition and in-store merchandising in the fourth quarter of Fiscal 2024, the Corporation has increased its full-year comparable store sales guidance to a range of 11.0% to 12.0%. All other guidance ranges and underlying assumptions remain unchanged.

Source: (DOL-T) Q2-2024 Quarterly Report


Enghouse Systems Limited (ENGH-T) released its fourth-quarter and fiscal 2023 results after markets closed on Thursday, December 14, 2023.

In fiscal 2023 we achieved a significant milestone by expanding our revenue, increasing our cash reserves and also deploying $55.2 million on acquisitions. We are pleased to announce record annual SaaS and Maintenance services revenue of $297.6 million, an increase of $39.4 million or 15.2% compared to the prior year. SaaS and maintenance services are an important strategic source of revenue characterized by their predictable and recurring nature. They now represent 65.6% of total revenues for the year compared to 60.4% in the prior year.”

– Stephen J. Sadler, Chairman and Chief Executive Officer

Highlights:

  • Revenue increased 13.9% to $123.1 million.
  • Recurring revenue, which includes SaaS and maintenance services, grew 35.0% to $87.2 million.
  • Operating profits improved from $33.1 to $35.7 million, while achieving a 30.8% EBITDA margin.

Outlook:

With cash reserves of $240.4 million and no external debt, we continue to actively pursue opportunities to strategically deploy our cash reserves on acquisitions and return cash to our shareholders in the form of dividends.

Source: (ENGH-T) Q4-2023 Quarterly Report


MP Market Review – December 08, 2023

Last updated by BM on December 11, 2023

Summary 

  • This is a weekly installment of our MP Market Review series, which provides updates on the financial markets and Canadian dividend growth companies we monitor on ‘The List’.
  • Last week, ‘The List’ was up with a YTD price return of +3.7% (capital). Dividends have increased by +9.1% YTD, highlighting the growth in the dividend (income).
  • Last week, there were no dividend announcements from companies on ‘The List’.
  • Last week, there were no earnings reports from companies on ‘The List’.
  • Two companies on ‘The List’ are due to report earnings this week.      

The List (2023)

The Magic Pants List includes 27 Canadian dividend growth stocks.  Each have raised their dividend annually for the last ten years (or longer) and have a market cap of over a billion dollars. Based on these criteria, companies on ‘The List’ are added or removed annually, on January 1. Prices and dividends are updated weekly.

While ‘The List’ does not function as a portfolio on its own, it serves as an excellent initial reference for individuals looking to diversify their investments and achieve higher returns in the Canadian stock market. Through our newsletter, readers gain a deeper understanding of how to implement and benefit from our Canadian dividend growth investing strategy.

If you’re interested in creating your own dividend growth income portfolio, consider subscribing to our premium service. Subscribers gain access to buy/sell alerts and exclusive content available only to subscribers.

Performance of ‘The List’

Last week, ‘The List’ was up with a YTD price return of +3.7% (capital). Dividends have increased by +9.1% YTD, highlighting the growth in the dividend (income).

The best performers last week on ‘The List’ were Loblaws (L-T), up +4.96%; CCL Industries (CCL-B-T), up +3.56%; and Stantec Inc. (STN-T), up +3.08%.

TFI International (TFII-N) was the worst performer last week, down -5.27%.

SYMBOL COMPANY YLD PRICE YTD % DIV YTD % STREAK
AQN-N Algonquin Power & Utilities 8.3% $6.07 -9.8% $0.51 -29.0% 12
ATD-T Alimentation Couche-Tard Inc. 0.8% $76.76 27.6% $0.60 26.6% 13
BCE-T Bell Canada 7.0% $55.20 -8.4% $3.87 5.2% 14
BIP-N Brookfield Infrastructure Partners 4.4% $28.16 -10.1% $1.44 6.3% 15
CCL-B-T CCL Industries 1.8% $59.61 2.7% $1.06 10.4% 21
CNR-T Canadian National Railway 2.0% $160.06 -1.7% $3.16 7.8% 27
CTC-A-T Canadian Tire 4.8% $144.53 -1.4% $6.90 17.9% 12
CU-T Canadian Utilities Limited 5.7% $31.58 -14.5% $1.79 1.0% 51
DOL-T Dollarama Inc. 0.3% $99.65 24.8% $0.27 23.8% 12
EMA-T Emera 5.7% $49.10 -6.7% $2.82 5.0% 16
ENB-T Enbridge Inc. 7.5% $47.46 -11.0% $3.55 3.2% 27
ENGH-T Enghouse Systems Limited 2.5% $33.63 -5.8% $0.85 18.2% 16
FNV-N Franco Nevada 1.3% $108.49 -21.5% $1.36 6.3% 15
FTS-T Fortis Inc. 4.1% $55.33 0.0% $2.29 5.3% 49
IFC-T Intact Financial 2.1% $210.25 7.4% $4.40 10.0% 18
L-T Loblaws 1.4% $124.05 3.1% $1.74 13.2% 11
MGA-N Magna 3.4% $54.92 -4.5% $1.84 2.2% 13
MRU-T Metro 1.8% $68.48 -9.3% $1.21 12.0% 28
RY-T Royal Bank of Canada 4.3% $125.24 -2.2% $5.34 7.7% 12
SJ-T Stella-Jones Inc. 1.2% $79.53 60.4% $0.92 15.0% 18
STN-T Stantec Inc. 0.7% $105.03 60.8% $0.77 8.5% 11
TD-T TD Bank 4.7% $81.01 -7.6% $3.84 7.9% 12
TFII-N TFI International 1.2% $115.30 15.2% $1.40 29.6% 12
TIH-T Toromont Industries 1.5% $113.60 16.3% $1.68 10.5% 33
TRP-T TC Energy Corp. 7.1% $51.65 -3.1% $3.69 3.4% 22
T-T Telus Corp. 5.7% $25.06 -4.8% $1.43 7.4% 19
WCN-N Waste Connections 0.8% $138.33 5.0% $1.05 10.5% 13
Averages 3.4% 3.7% 9.1% 19

Six Canadian stocks on ‘The List’ declare earnings and dividends in US dollars and are inter-listed on a US exchange in US dollars. The simplest way to display dividend and price metrics for these stocks is to show their US exchange symbols along with their US dividends and price. The stocks I am referring to have a -N at the end of their symbols. You can still buy their Canadian counterparts (-T), but your dividends will be converted into CDN dollars and will fluctuate based on the exchange rate.

DGI Clipboard

“You are never going to be successful with every single investment. But if you can consistently keep the odds in your favor over time, you can become the casino and not the guy blowing his paycheck drinking watered-down cocktails at The Flamingo.”

– Daryl Jones, HEDGEYE

Be the casino not the gambler

In a standard game of blackjack played with a single deck and employing basic strategy, the house edge typically hovers around 0.5%. This implies that, on average, the casino maintains a slight advantage over the player. However, variations such as multiple decks, rule adjustments, and player decisions can significantly sway the odds in favour of the casino.

For many investors, navigating the stock market may feel akin to sitting at a blackjack table, especially for those seeking short-term capital gains.

Dividend growth investors take a more disciplined approach. They follow a fundamental strategy and adopt a longer-term investing horizon, distinguishing them from other investors. They can afford to patiently await the fruition of their strategy while enjoying the growth of their income.

History has shown that the longer the holding period, with all equities, the more likelihood of a positive return. The chart highlights one of the major differences between how the industry pros invest (Wall Street/Bay Street) and investors with a longer-term investing horizon.

In reviewing our trades (timestamps) over the past six years of our dividend growth investing journey, we see this scenario play out.

The data in our historical DGI timestamp chart can be summarized further by dividing the number of trades with positive returns by the number of trades made for each year. The results support our research into why dividend growth investing is one of the best ways to build wealth. First, a rising dividend income stream will eventually lead to rising stock prices—secondly, the longer the holding period the more significant and more predictable the returns.

Year 1 2023: 86% (12/14)              # of positive price returns are volatile.

Year 2 2022: 30% (3/10)

Year 3 2021: 59% (10/17)              # of positive price returns stabilizing.                        

Year 4 2020: 71% (10/14)

Year 5 2019: 100% (3/3)               # of positive price returns are highly predictable.

Year 6 2018: 94% (15/16)

Like the casino example, we are able to tilt the odds in our favour with DGI, and by extending our investment time horizon (rule adjustment), we enhance the odds of a positive outcome even further.

If you have not yet joined as a paid subscriber of the blog to receive DGI Alerts on the activity and content related to our model portfolio, it’s not too late. Click Here. 

Recent News 

Bank of Canada holds key interest rate steady but warns ready to hike again (Globe & Mail)

https://www.theglobeandmail.com/business/article-bank-of-canada-interest-rate-december/

“Governing council is still concerned about risks to the outlook for inflation and remains prepared to raise the policy rate further if needed.”

With many homeowners now facing higher mortgage renewal rates and a slowing economy, the probability of a recession taking hold in 2024 seems more likely. Whether it will be a ‘soft landing’ or not remains to be seen.

Profits in Canadian grocery sector set to exceed record in 2023, expert says (Globe & Mail)

https://www.theglobeandmail.com/business/article-profits-in-canadian-grocery-sector-set-to-exceed-record-in-2023-expert/

“New research by the centre found that food retailers are now earning more than twice as much profit as they did pre-pandemic.”

After our recent purchase of Metro Inc. (MRU-T) in our model portfolio, this headline appears to be good news. The problem is that the ‘tax the rich’ crowd in Ottawa are zeroing in on the industry for short-term political gain.

Eric La Fleche, president and CEO of Metro Inc. is scheduled to present during the first half of the committee meeting today.

Dividend Increases

“The growth of dividend paying ability is of significance in the determination of a stock’s quality, or general safety…”

– Arnold Bernhard (the founder of Value Line)

No companies on ‘The List’ had dividend announcements last week.


Earnings Releases

Benjamin Graham once remarked that earnings are the principal factor driving stock prices.

Each quarter, we will provide readers with weekly earnings updates of stocks on ‘The List’ during the calendar earnings season. 

The updated earnings calendar can be found here.

Two earnings reports from companies on ‘The List’ this week

Dollarama Inc. (DOL-T) will release its third-quarter fiscal 2024 results on Wednesday, December 13, 2023, before markets open. 

Enghouse Systems Limited (ENGH-T) will release its fourth-quarter and fiscal 2023 results on Thursday, December 14, 2023, after markets close.

Last week, no earnings reports from companies on ‘The List’.


MP Market Review – December 01, 2023

Last updated by BM on December 04, 2023

Summary 

  • This is a weekly installment of our MP Market Review series, which provides updates on the financial markets and Canadian dividend growth companies we monitor on ‘The List’.
  • Last week, ‘The List’ was up with a YTD price return of +3.4% (capital). Dividends have increased by +9.0% YTD, highlighting the growth in the dividend (income).
  • Last week, four dividend announcements from companies on ‘The List’.
  • Last week, three earnings reports from companies on ‘The List’.
  • No companies on ‘The List’ are due to report earnings this week.      

The List (2023)

The Magic Pants List includes 27 Canadian dividend growth stocks.  Each have raised their dividend annually for the last ten years (or longer) and have a market cap of over a billion dollars. Based on these criteria, companies on ‘The List’ are added or removed annually, on January 1. Prices and dividends are updated weekly.

While ‘The List’ does not function as a portfolio on its own, it serves as an excellent initial reference for individuals looking to diversify their investments and achieve higher returns in the Canadian stock market. Through our newsletter, readers gain a deeper understanding of how to implement and benefit from our Canadian dividend growth investing strategy.

If you’re interested in creating your own dividend growth income portfolio, consider subscribing to our premium service. Subscribers gain access to buy/sell alerts and exclusive content available only to subscribers.

Performance of ‘The List’

Last week, ‘The List’ was up with a YTD price return of +3.4% (capital). Dividends have increased by +9.0% YTD, highlighting the growth in the dividend (income).

The best performers last week on ‘The List’ were Stantec Inc. (STN-T), up +6.64%; Algonquin Power & Utilities (AQN-N), up +4.81%; and Waste Connections (WCN-N), up +4.74%.

Franco Nevada (FNV-N) was the worst performer last week, down -3.74%.

SYMBOL COMPANY YLD PRICE YTD % DIV YTD % STREAK
AQN-N Algonquin Power & Utilities 8.0% $6.32 -6.1% $0.51 -29.0% 12
ATD-T Alimentation Couche-Tard Inc. 0.8% $76.93 27.9% $0.60 26.6% 13
BCE-T Bell Canada 7.1% $54.39 -9.7% $3.87 5.2% 14
BIP-N Brookfield Infrastructure Partners 4.4% $27.75 -11.4% $1.44 6.3% 15
CCL-B-T CCL Industries 1.8% $57.56 -0.8% $1.06 10.4% 21
CNR-T Canadian National Railway 2.0% $160.23 -1.6% $3.16 7.8% 27
CTC-A-T Canadian Tire 4.8% $142.86 -2.5% $6.90 17.9% 12
CU-T Canadian Utilities Limited 5.8% $30.82 -16.6% $1.79 1.0% 51
DOL-T Dollarama Inc. 0.3% $99.42 24.5% $0.27 23.8% 12
EMA-T Emera 5.8% $48.37 -8.1% $2.82 5.0% 16
ENB-T Enbridge Inc. 7.5% $47.47 -11.0% $3.55 3.2% 27
ENGH-T Enghouse Systems Limited 2.5% $34.33 -3.9% $0.85 18.2% 16
FNV-N Franco Nevada 1.2% $113.16 -18.1% $1.36 6.3% 15
FTS-T Fortis Inc. 4.2% $54.84 -0.9% $2.29 5.3% 49
IFC-T Intact Financial 2.1% $210.80 7.7% $4.40 10.0% 18
L-T Loblaws 1.5% $118.19 -1.8% $1.74 13.2% 11
MGA-N Magna 3.3% $55.68 -3.2% $1.84 2.2% 13
MRU-T Metro 1.8% $68.32 -9.5% $1.21 10.0% 28
RY-T Royal Bank of Canada 4.3% $122.94 -4.0% $5.34 7.7% 12
SJ-T Stella-Jones Inc. 1.2% $78.30 57.9% $0.92 15.0% 18
STN-T Stantec Inc. 0.8% $101.89 56.0% $0.77 8.5% 11
TD-T TD Bank 4.7% $81.91 -6.6% $3.84 7.9% 12
TFII-N TFI International 1.2% $121.72 21.6% $1.40 29.6% 12
TIH-T Toromont Industries 1.5% $113.05 15.7% $1.68 10.5% 33
TRP-T TC Energy Corp. 7.2% $51.06 -4.2% $3.69 3.4% 22
T-T Telus Corp. 5.7% $24.98 -5.1% $1.43 7.4% 19
WCN-N Waste Connections 0.8% $139.63 6.0% $1.05 10.5% 13
Averages 3.4% 3.4% 9.0% 19

Six Canadian stocks on ‘The List’ declare earnings and dividends in US dollars and are inter-listed on a US exchange in US dollars. The simplest way to display dividend and price metrics for these stocks is to show their US exchange symbols along with their US dividends and price. The stocks I am referring to have a -N at the end of their symbols. You can still buy their Canadian counterparts (-T), but your dividends will be converted into CDN dollars and will fluctuate based on the exchange rate.

DGI Clipboard

“It is far better to buy a great business at a fair price than a fair business at a great price”

– Warren Buffett

Less is better: quality not quantity for safely building wealth.

It is no coincidence that our dividend growth investing strategy incorporates identifying individual ‘quality’ companies as the first step in our process. Study after study backs our strategy that the best way to have long-term investment success is to select a few individual quality stocks and hold for the growing income. Buying quantity (think ETF) does not reduce risk, it only lowers your returns. Risk is in the price we pay not in how many stocks we own.

Understanding this key difference in what we do and what others don’t, is the key to our long-term success.

Although we don’t have a formal quality rating system, we identify quality individual companies by looking for indicators that have shown themselves to be highly predictive of long-term success. Stocks with strong business models and steady financial results over time are the ones we eventually invest in. We also value the independent research from services that sell information for a living (Value Line, S&P Credit Ratings). For more information on all our quality indicators read our post ‘Finding Quality Dividend Growth Stocks’ which was recently updated.

Because of our focus on quality, you will see us sometimes open a position in a company when it reaches a sensible price as opposed to one that has a great price.


There were a few significant events this past week which we will touch on in this issue. First the passing of Charlie Munger, Buffets right hand man. Secondly, bank earnings were released. Finally, an update on the Cobre Panama mine where the Panamanian court ruled that Law 406 was unconstitutional. Franco Nevada (FNV-T), a core stock on ‘The List’ and in our model portfolio, has a significant royalty stream coming from this mine.

If you have not yet joined as a paid subscriber of the blog to receive DGI Alerts on the activity and content related to our model portfolio, it’s not too late. Click Here. 

Recent News 

What Charlie Munger taught Warren Buffett about investing, and life

https://www.theglobeandmail.com/business/commentary/article-what-charlie-munger-taught-warren-buffett-about-investing-and-life/

Charlie Munger is often credited with advising Warren Buffet on the value of investing in quality companies at reasonable prices. Buffett had previously made a reputation of investing in companies that were severely undervalued (great price).

Good advice by Mr. Munger on the importance of knowing who you are.

“And the most important person you must understand is: you. Because if you don’t see the world as it really is, and yourself as you really are, then barring the happenstance of good luck, your life is likely to be marked by disappointment and failure.”

Article takeaway: Lifelong learning and lifelong companionship, to the degree we can attain them, pay dividends — tangibly and intangibly.

Banks brace for tough economic times in 2024 (Globe & Mail)

https://www.theglobeandmail.com/business/article-banks-brace-for-tough-economic-times-in-2024/

“The country’s largest lenders posted mixed fourth-quarter financial results this week. As uncertainty looms over just how far the economy could tumble next year, bank earnings point to lower profits and an uptick in sour loans.”

Depending on which earnings report you read, Canada’s banks are either modestly optimistic or very cautious in their predictions. One thing for sure, the economy is slowing and per capital GDP is decreasing.

Franco-Nevada Maintained at Outperform at BMO as it Sees Lengthy Cobre Panama Shutdown; Price Target cut to C$200.00

11:23 AM EST, 12/04/2023 (MT Newswires) — BMO Capital Markets on Monday reiterated its Franco-Nevada (FNV.TO, FNV) while cutting its price target to C$200.00 from C$214.00 as it expects a lengthy shutdown for First Quantum Minerals (FM.TO) Cobre Panama project amid an uncertain political outlook for the project. Franco-Nevada has a significant royalty interest in the project.

“We have pushed our assumed restart for Cobre Panama to October 1, 2024 (from January 1, 2024 previously) based on our evolving understanding of the circumstances in country … Our Franco-Nevada estimates are also impacted by the mine closure due to its stream on Cobre Panama. With our updated closure assumption, our Franco-Nevada one-year target has fallen to C$200/share (from C$214); we maintain our Outperform rating,” analyst Jackie Przybylowski wrote.

Trying to speculate on when the mine will re-open is not what we do. The mine is too important to the country and its global reputation to stay shut down for long. Franco-Nevada is a quality company and will survive these short-term headwinds.

Dividend Increases

“The growth of dividend paying ability is of significance in the determination of a stock’s quality, or general safety…”

– Arnold Bernhard (the founder of Value Line)

Four companies on ‘The List’ had dividend announcements last week.

Alimentation Couche-Tard Inc. (ATD-T) on Tuesday said it increased its 2023 quarterly dividend from $0.14 to $0.175 per share, payable December 21, 2023, to shareholders of record on December 07, 2023.

This represents a dividend increase of +25.0%, marking the 14th straight year of dividend growth for this global leader in both convenience store and road transportation fuel retail.

Enbridge Inc. (ENB-T) on Wednesday said it increased its 2024 quarterly dividend from $0.8875 to $0.915 per share, payable March 1, 2024, to shareholders of record on February 15, 2024.

This represents a dividend increase of +3.1%, marking the 28th straight year of dividend growth for this pipeline company.

Royal Bank of Canada (RY-T) on Thursday said it increased its 2024 quarterly dividend from $1.35 to $1.38 per share, payable February 23, 2024, to shareholders of record on January 25, 2024.

This represents a dividend increase of +2.0%, marking the 13th straight year of dividend growth for this quality Canadian bank.

TD Bank (TD-T) on Thursday said it increased its 2024 quarterly dividend from $0.96 to $1.02 per share, payable January 31, 2024, to shareholders of record on January 10, 2024.

This represents a dividend increase of +6.3%, marking the 13th straight year of dividend growth for this quality Canadian bank.


Earnings Releases

Benjamin Graham once remarked that earnings are the principal factor driving stock prices.

Each quarter, we will provide readers with weekly earnings updates of stocks on ‘The List’ during the calendar earnings season. 

The updated earnings calendar can be found here.

No earnings reports from companies on ‘The List’ this week

Last week, three earnings reports from companies on ‘The List’.

Alimentation Couche-Tard Inc. (ATD-T) released its second-quarter fiscal 2024 results on Tuesday, November 28, 2023, after markets closed.

“We are pleased to announce a solid second quarter with good progress across most of our key metrics, although we did see softening in same store sales in the U.S., driven by weakness in the cigarette category and cycled against a robust second quarter, up 5.6%, last year. In an environment with continued inflation and high interest rates, we remain committed to offering compelling value and ease. We have substantially expanded the rollout of our Inner Circle membership program, which is now in seven U.S. business units covering close to 3,000 locations with over 2.7 million fully enrolled, providing meaningful convenience and fuel rewards to our most valuable customers. As America’s Thirst Stop, we are focused on the growth of our beverage category by offering great assortment, innovation and value in both packaged and dispensed beverages at affordable price points. We also continue to be pleased with the performance of our fuel business, in terms of both volumes and margins, as we continue to bring traffic to our sites through reoccurring promotional Fuel Days.”

– Brian Hannasch, President and Chief Executive Officer

Highlights:

  • Net earnings were $819.2 million, or $0.85 per diluted share for the second quarter of fiscal 2024 compared with $810.4 million, or $0.79 per diluted share for the second quarter of fiscal 2023. Adjusted net earnings were approximately $792.0 million compared with $838.0 million for the second quarter of fiscal 2023. Adjusted diluted net earnings per share were $0.82, unchanged compared with the corresponding quarter of last year.
  • Total merchandise and service revenues of $4.1 billion, an increase of 1.0%. Same-store merchandise revenues decreased by 0.1% in the United States, by 0.2% in Europe and other regions, and increased by 1.6% in Canada.
  • Same-store road transportation fuel volumes decreased by 1.5% in the United States, by 0.9% in Europe and other regions, and increased by 3.0% in Canada.
  • Growth of expenses for the second quarter of fiscal 2024 was 2.5% while normalized growth of expenses was 1.5%, remaining below the average inflation observed throughout the Corporation’s network.
  • Subsequent to the end of the quarter, the Corporation closed the acquisition of 112 company-owned and operated convenience retail and fuel sites in the United States.
  • During its November 28, 2023 meeting, the Board of Directors approved an increase in the quarterly dividend of CA 3.5¢ per share, bringing it to CA 17.5¢ per share, an increase of 25.0%.

Outlook:

“Following the announcement of our 10 For The Win five-year strategy, we are excited by the recent developments in the growth of our network. In the beginning of November, we closed on the acquisition of 112 MAPCO sites, accelerating our development in key markets in Alabama, Georgia, Kentucky, Mississippi and Tennessee and adding approximately 1,300 team members to the Alimentation Couche-Tard Family. We also recently received an important decision by the European Commission allowing us to move closer to an end of calendar year completion of our game-changing acquisition of TotalEnergies in four new European countries. On the organic front, we are making progress on our stated goal of building 500 stores over the next five years, having already finished more than 40 new stores this fiscal year with considerably more in the pipeline that are either currently under or starting construction in the upcoming months,” concluded Brian Hannasch.

Source: (ATD-T) Q2-2024 Quarterly Review


Royal Bank of Canada (RY-T) released its fourth-quarter and fiscal 2023 results on Thursday, November 30, 2023, before markets opened.

“In a year defined by uncertainty, RBC served as a stabilizing force for our clients, communities, colleagues and shareholders. Our overall performance in 2023 exemplifies our standing as an all-weather bank. Our strong balance sheet, prudent risk management and diversified business model continue to underpin our ability to deliver differentiated client experiences and advice across all our businesses. As we enter 2024, RBC will work to provide the best client value as efficiently as possible, sharpening our focus to ensure our people and investments are aligned to build the bank of the future. Across RBC, our employees remain steadfast in their commitment to helping clients and communities adapt and thrive in a changing world.”

– Dave McKay, President and Chief Executive Officer

Highlights:

  • Net income and diluted EPS of $4.1 billion and $2.90, respectively, were both up 6% from a year ago. Adjusted net income and adjusted diluted EPS of $4.0 billion and $2.78, respectively, were up 1% and flat compared to the prior year, respectively.
  • Results this quarter reflected higher provisions for credit losses, with a PCL on loans ratio of 34 bps. Results benefitted from lower taxes reflecting a favourable shift in earnings mix and the impact of the specified item relating to certain deferred tax adjustments of $578 million.
  • Pre-provision, pre-tax earnings of $4.8 billion were down 9% from a year ago, due to lower revenue in Wealth Management, largely reflecting the impact of impairment losses with respect to our interest in an associated company, as well as lower revenue in Global Markets. Results were also impacted by higher expenses, reflecting higher staff-related costs including severance, higher professional fees, ongoing technology investments and other items, such as legal provisions in U.S. Wealth Management. These factors were partially offset by higher net interest income driven by higher spreads and strong volume growth in Canadian Banking, higher revenue in Corporate & Investment Banking, and higher fee-based revenue in Wealth Management.
  • Compared to last quarter, net income was up $259 million or 7% reflecting higher results in Corporate Support, Insurance and Capital Markets, partially offset by lower results in Wealth Management and Personal & Commercial Banking. Adjusted net income13 was down 1% over the same period.

Outlook:

Economic and market review and outlook GDP growth is slowing across most advanced economies as headwinds from higher interest rates continue to have a lagged impact. Unemployment rates remain low across most economies. However, they have begun to marginally increase in Canada and the United Kingdom (U.K.). The U.S. economy has remained resilient with strong GDP growth and a low unemployment rate. However, credit conditions continue to tighten, the number of job openings are signaling a decline in hiring demand and the excess of household savings accumulated during the pandemic has shrunk. U.S. GDP growth is expected to slow late in calendar 2023 with mild recessions expected in the first half of calendar 2024. Canadian GDP is expected to decline over the second half of calendar 2023 and grow slowly in early calendar 2024. Inflation is still high but has been slowing in most advanced economies. Interest rates have increased to levels that most central banks view as sufficient to slow economic growth and reduce inflationary pressures over time. We expect central banks will not increase policy interest rates further and expect a shift to reductions in interest rates from the Federal Reserve (Fed) and Bank of Canada (BoC) in the next calendar year. However, interest rates are expected to remain significantly higher than pre-pandemic levels.

Source: (RY-T) Q4-2023 Quarterly Review


TD Bank (TD-T) released its fourth-quarter and fiscal 2023 results on Thursday, November 30, 2023, before markets opened.

“TD delivered strong revenue growth this quarter, reflecting positive underlying business momentum and the benefits of our diversified business model. In a complex operating environment, we continued to adapt, invest in new capabilities and take important steps to deliver efficiencies and drive growth across the Bank.”

– Bharat Masrani, Group President and CEO

Highlights:

FOURTH QUARTER FINANCIAL HIGHLIGHTS, compared with the fourth quarter last year:

  • Reported diluted earnings per share were $1.49, compared with $3.62.
  • Adjusted diluted earnings per share were $1.83, compared with $2.18.
  • Reported net income was $2,886 million, compared with $6,671 million.
  • Adjusted net income was $3,505 million, compared with $4,065 million.

FULL YEAR FINANCIAL HIGHLIGHTS, compared with last year:

  • Reported diluted earnings per share were $5.60, compared with $9.47.
  • Adjusted diluted earnings per share were $7.99, compared with $8.36.
  • Reported net income was $10,782 million, compared with $17,429 million.
  • Adjusted net income was $15,143 million, compared with $15,425 million.

Outlook:

The global economy remains on track to slow in calendar 2023 and 2024, but to a lesser extent than anticipated in the previous quarter. Inflation has generally continued to cool across the G-7, and more central banks have taken a pause on interest rate hikes. Central bankers will remain vigilant on inflation and further rate hikes cannot be ruled out, but most are fine-tuning interest rate adjustments at this stage. The lagged impact of cumulative interest rate hikes is expected to be the primary influence dampening economic growth and returning inflation closer to the target ranges of the various regions by the end of calendar 2024.

TD Economics continues to believe there is a chance the federal funds rate may rise a further quarter point from its current range of 5.25-5.50% early in calendar 2024. The economic environment remains fluid. If the central bank sees evidence of further cooling in the labor market and is increasingly confident that inflation is headed towards its 2% target, it could opt to hold rates steady. Given the steep rise in interest rates over the past year, the trend towards tighter U.S. credit and financial conditions, and the likelihood of rolling periods of financial stress related to risk factors, the probability of a recession stateside remains elevated.

Source: (TD-T) Q4-2023 Quarterly Review


We buy quality individual dividend growth stocks when they are sensibly priced and hold for the growing income.