‘The List’ – Portfolio Review (June 2022)
Posted by BM on June 30, 2022
Summary:
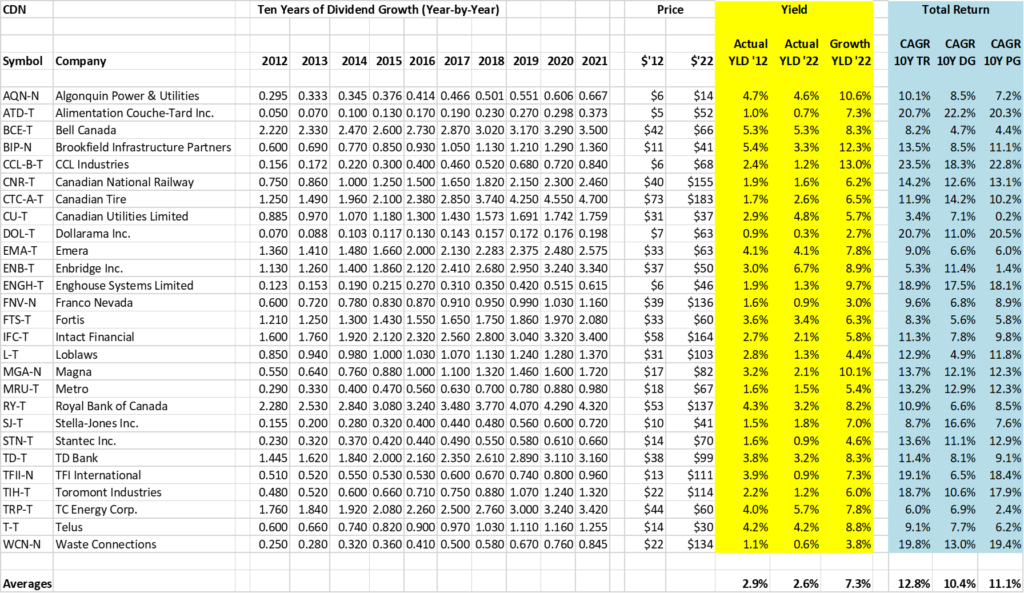
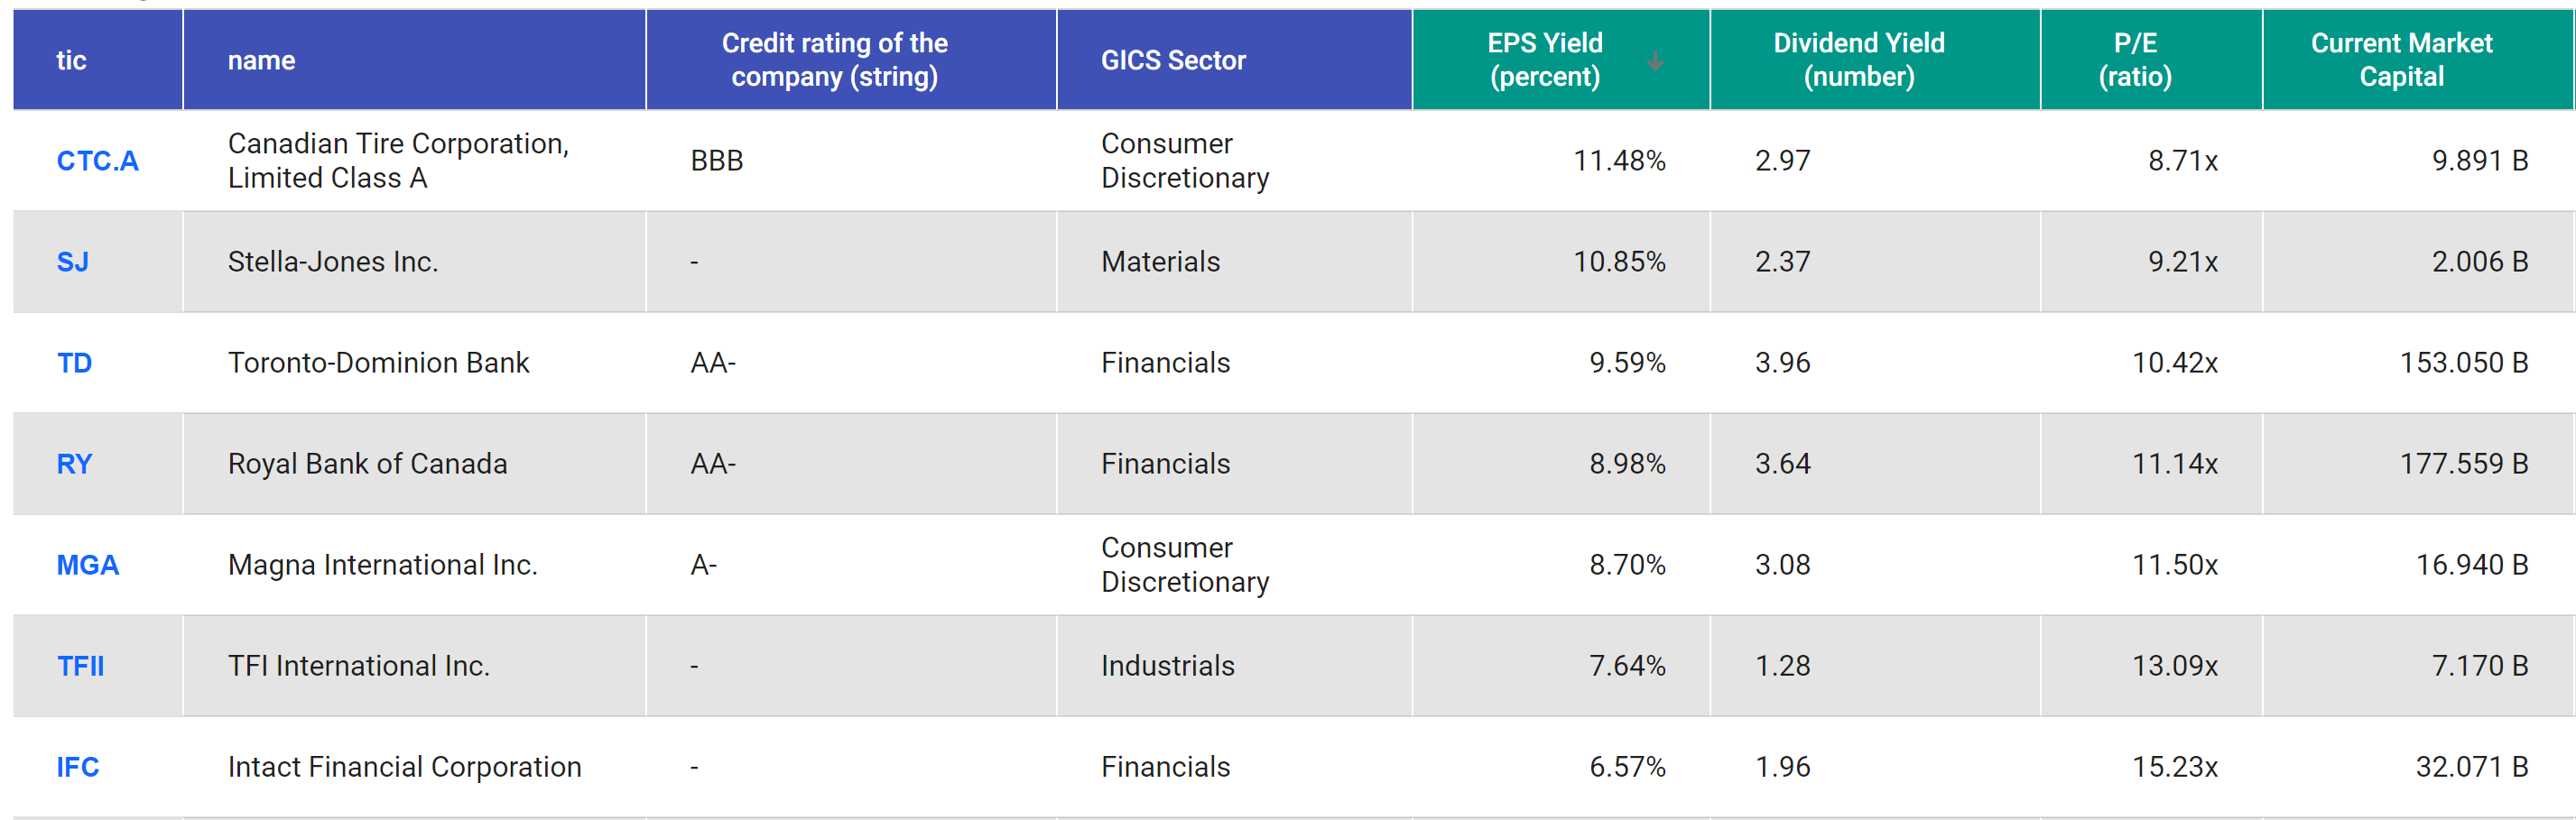
- This article is part of our monthly series where we highlight companies on ‘The List’ that meet our minimum criteria of 6.5% EPS yield.
- A fair valuation is the second rule in our three-step process. Buying when our quality stocks are sensibly priced will help ensure our future investment returns meet our expectations.
- This month we will review Stella-Jones Inc. (SJ-T).
- Are you looking for a portfolio of ideas like this one? Magic Pants DGI Premium Membership Subscribers get exclusive access to the MP Wealth-Builder Model Portfolio (CDN). Learn More
Proper investing is all about taking advantage of the long-run opportunities that the short-run imbalances give you. In arriving at a sensible price, we use an earnings-determined market price. Emotions determine the market price in the short run, and earnings determine the price in the long run.
We rely heavily on the fundamentals analyzer software tool (FASTgraphs) and YCHARTS to help us understand the operating results of the stocks we invest in. We then read the Company’s website for investor presentations and recent earnings reports to learn more.
Source: FASTgraphs
Intro:
Stella-Jones Inc. (SJ-T) is North America’s leading producer of pressure-treated wood products. It supplies all of the continent’s major electrical utilities and telecommunication companies with wood utility poles and North America’s Class 1, short line and commercial railroad operators with railway ties and timbers.
Stella-Jones also provides industrial products, which include wood for railway bridges and crossings, marine and foundation pilings, construction timbers and coal tar-based products. Additionally, the Company manufactures and distributes premium residential lumber and accessories to Canadian and American retailers for outdoor applications. A significant portion of the business is devoted to servicing the Canadian market through its national manufacturing and distribution network.

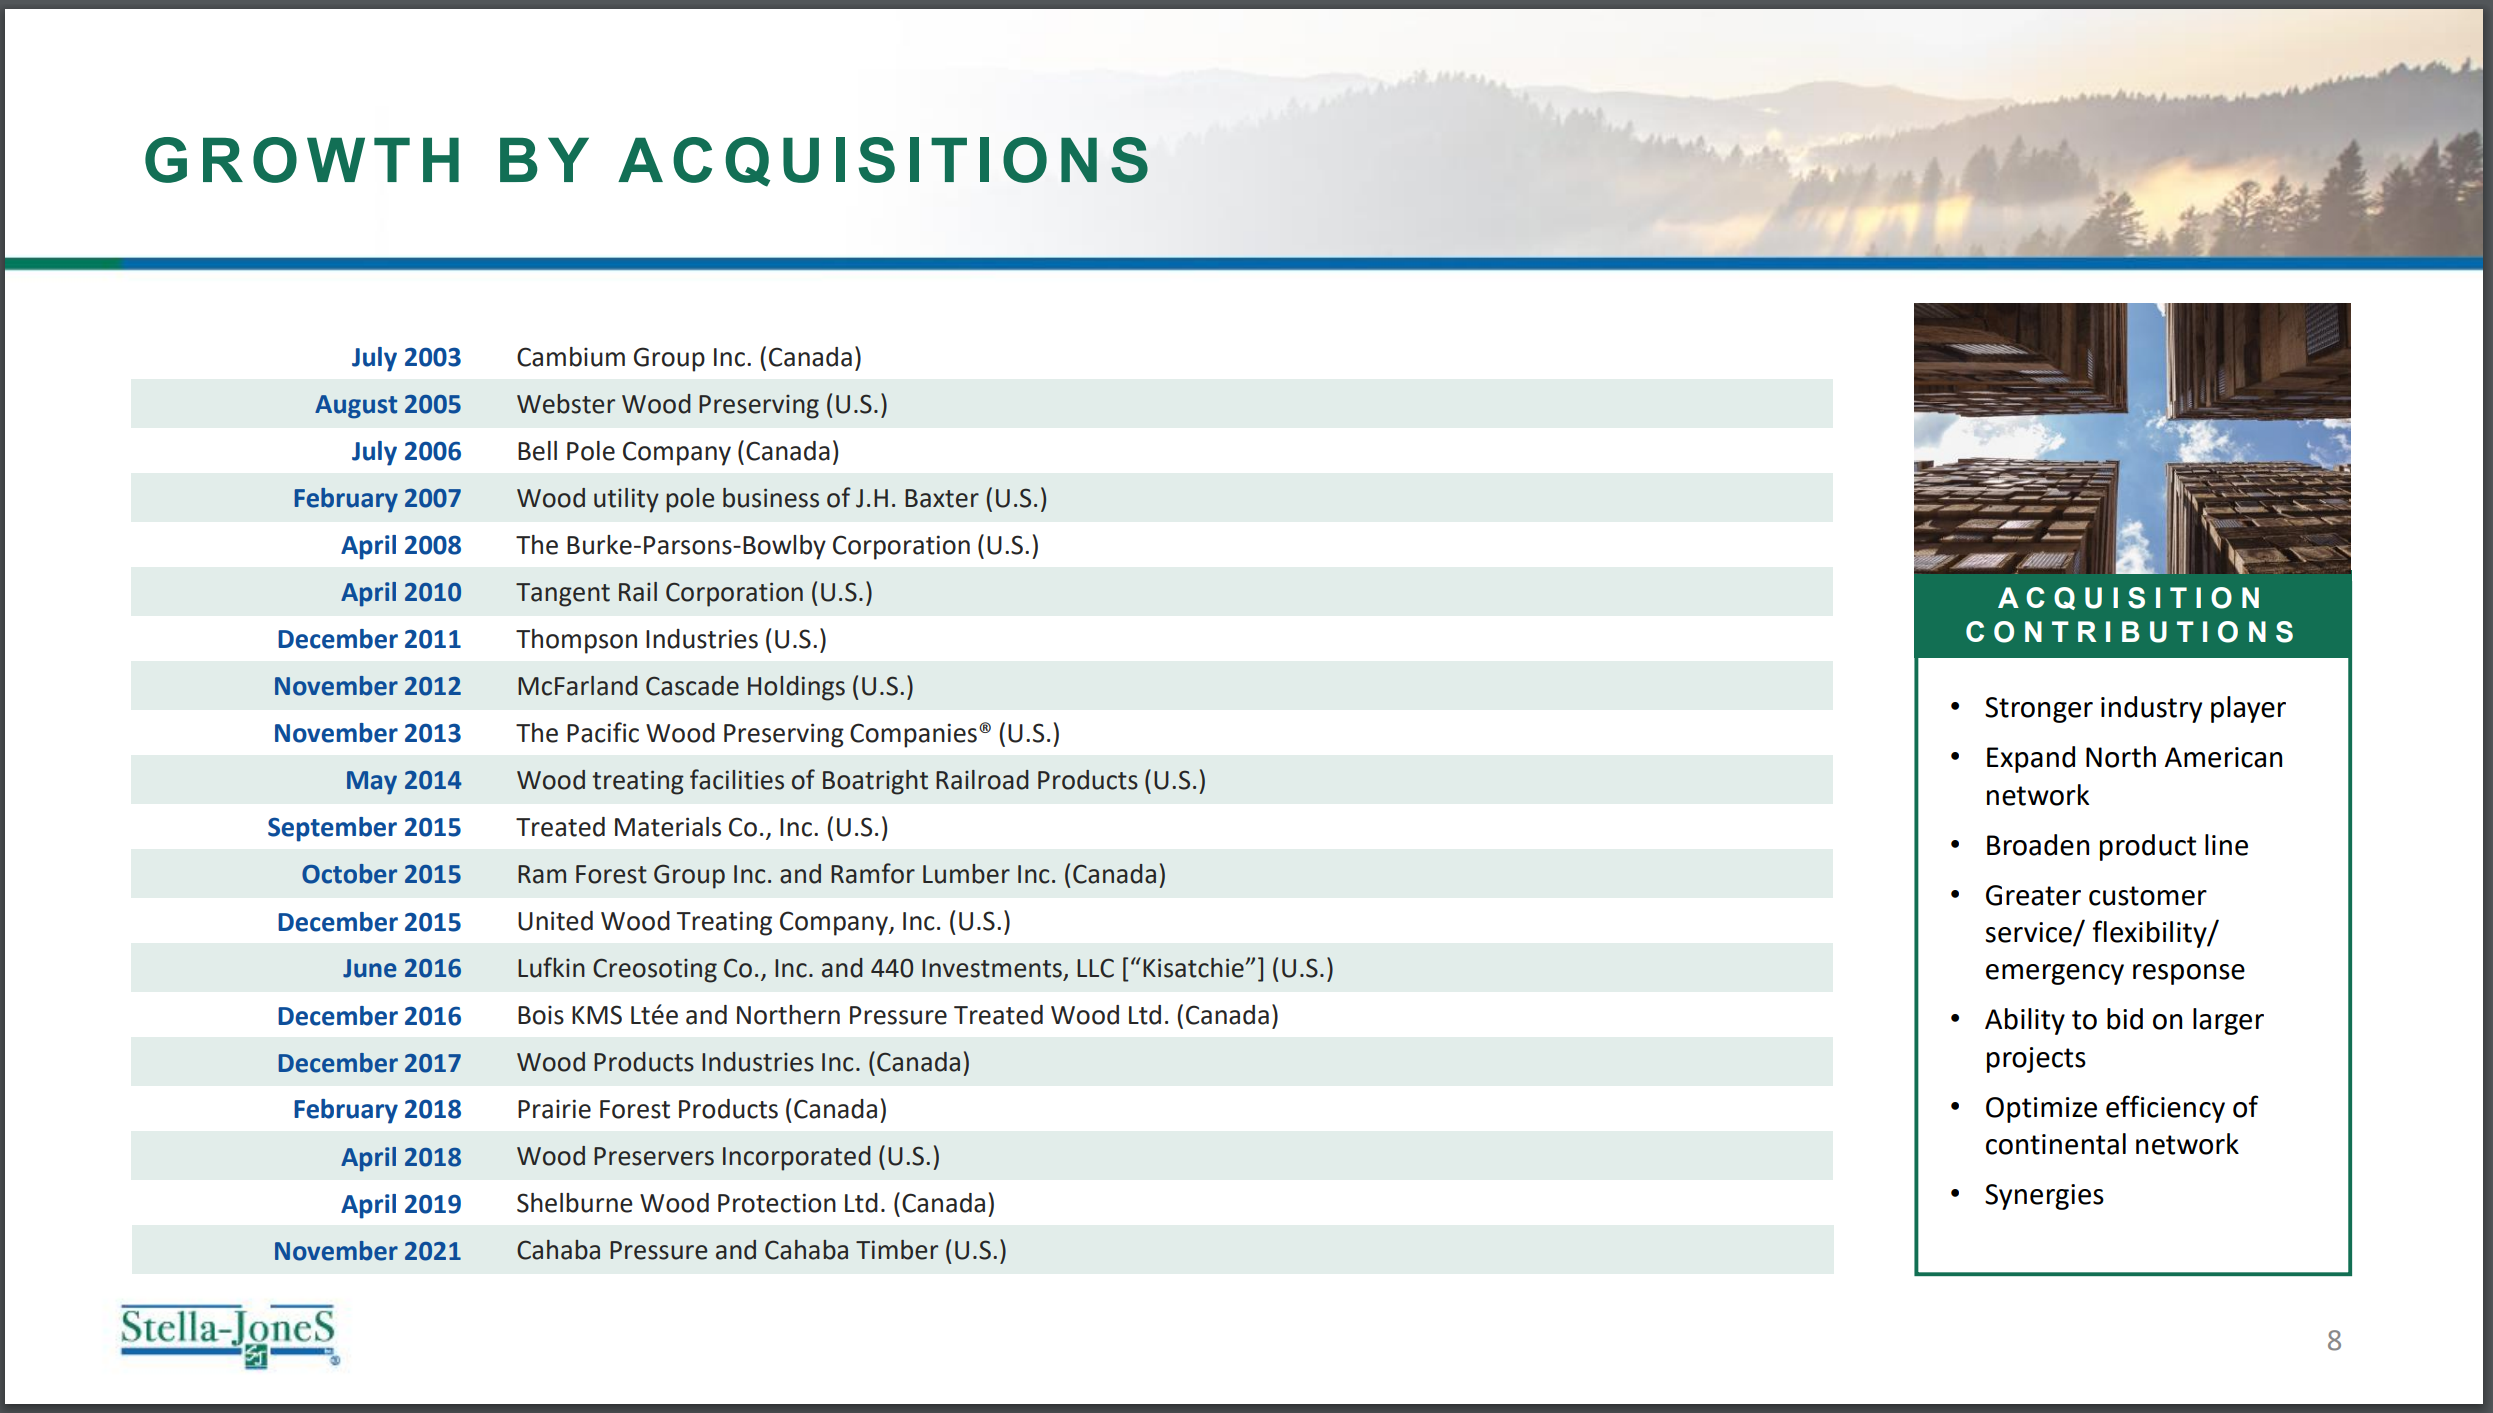


Source: Investor Presentation May 2022-Company website
Historical Graph:
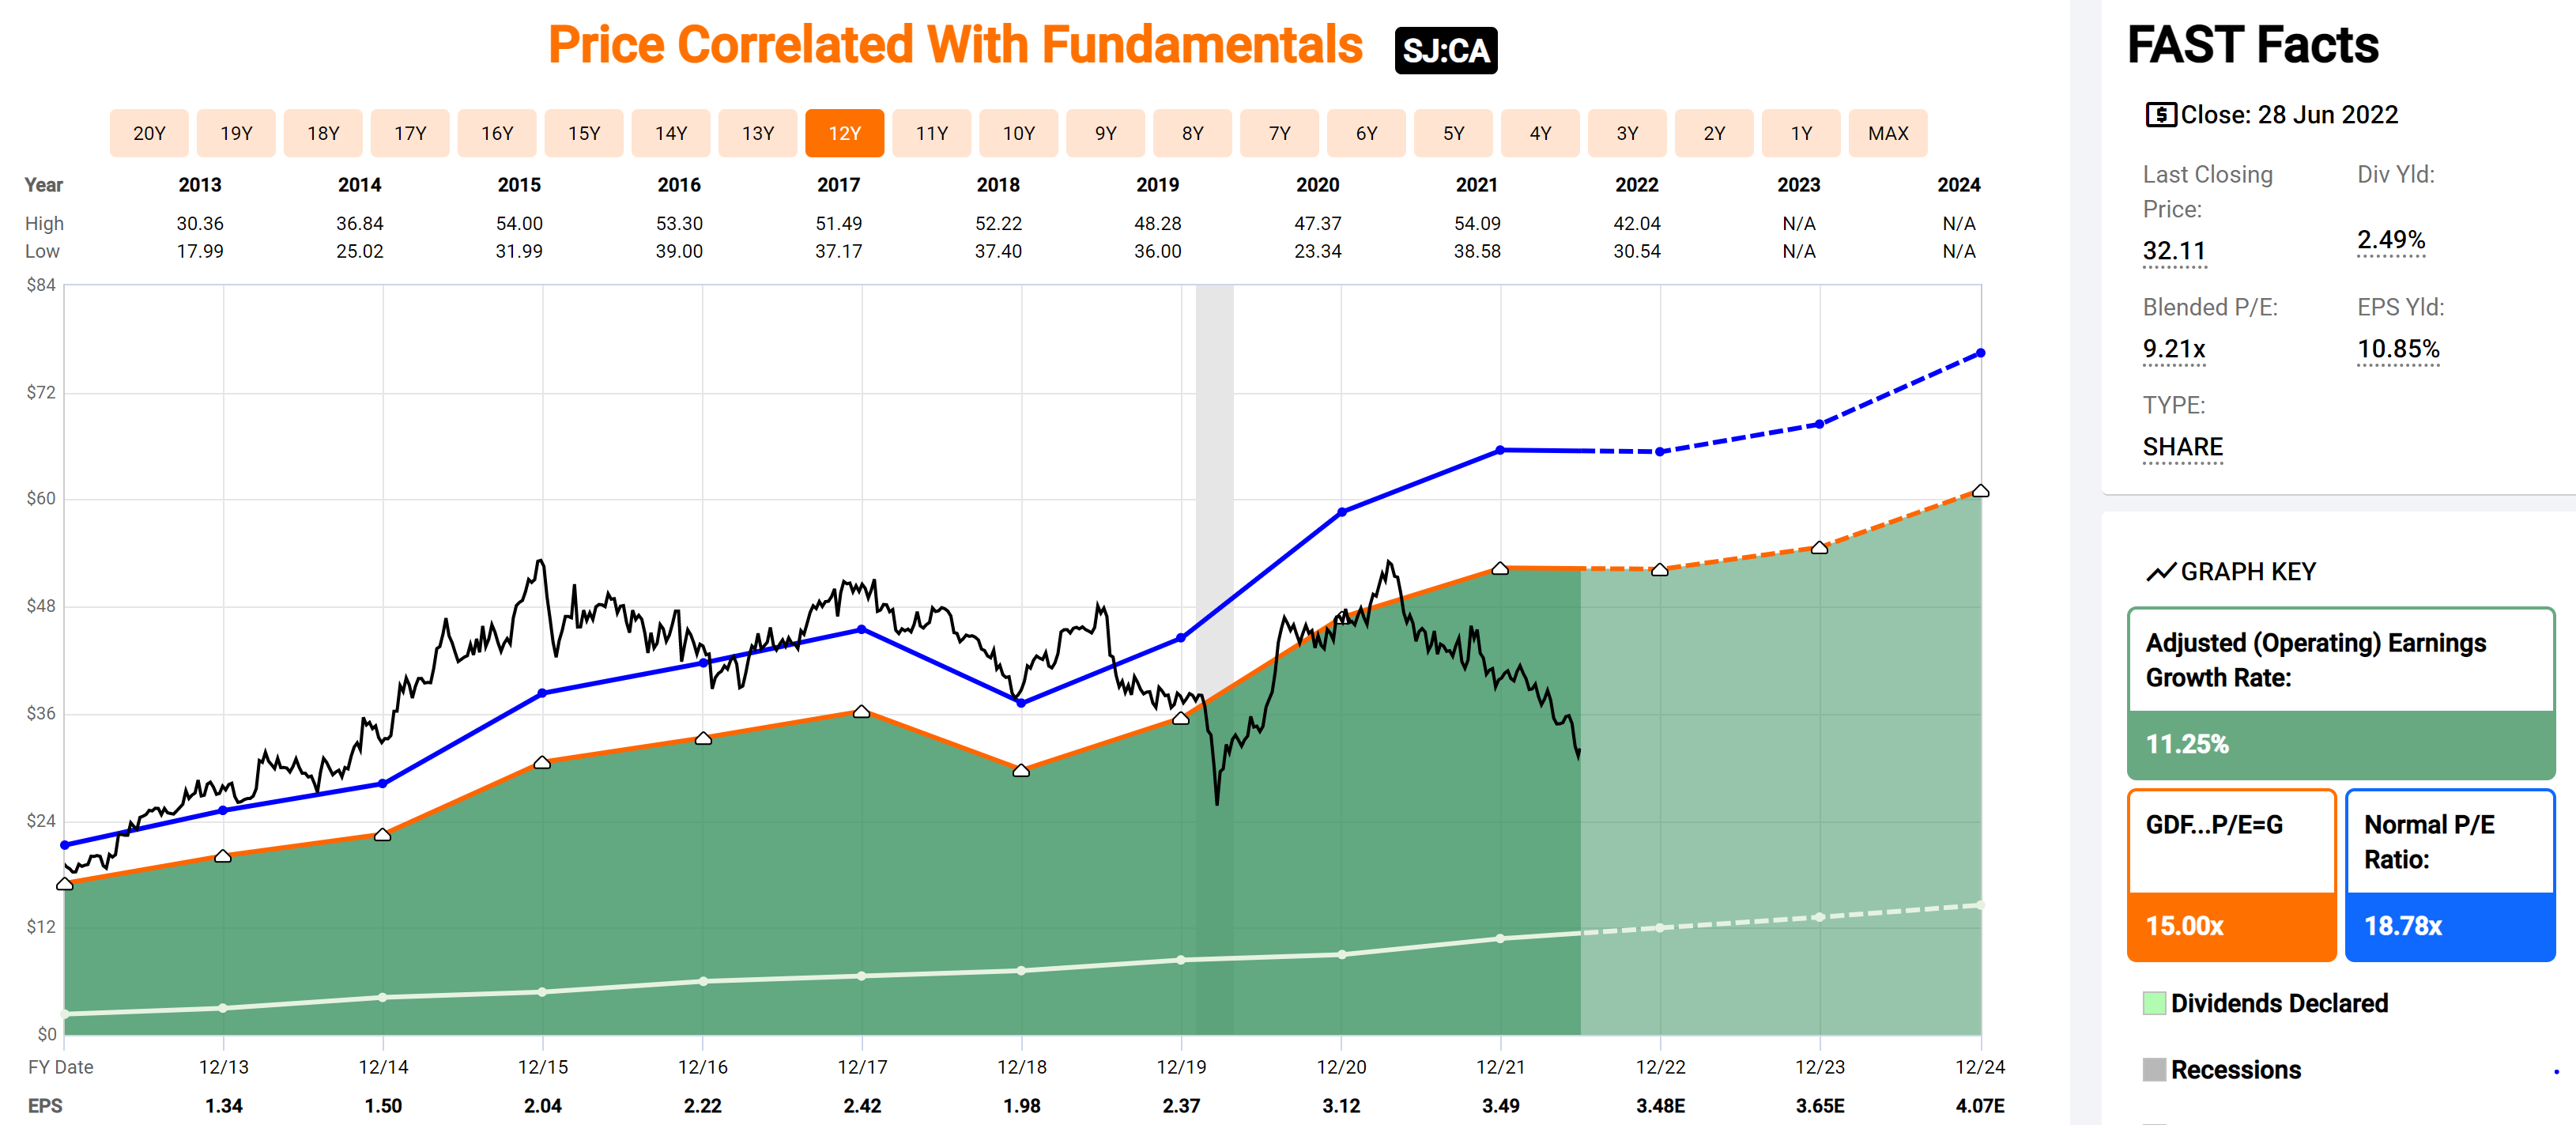
Source: FASTgraphs
Comments:
Stella-Jones’ valuation corridor has widened in recent years. For much of the last decade, a sensible price (Black Line) was at or close to the normal P/E (Blue Line). When COVID hit, the volatility of lumber prices either helped or hindered the share price. The normal P/E is now hitting levels not seen since the financial crisis in 2008-09.
The long-term fundamentals show a company whose annualized earnings have grown steadily over the last ten years at ~11.25%. A more recent analysis, however, sees earnings growth slowing to about half of that.
Dividend/Price Growth Alignment:

Comments:
We talk a lot in our blog about dividend growth and price growth alignment over the longer term. Stella-Jones Inc. has grown its dividend much faster than its price has increased. This can sometimes be a red flag if the payout ratio rises too high and puts the dividend at risk. This is not the case with Stella-Jones Inc. as the dividend payout ratio is only 24% and well covered by free cash flow.
We like to see our dividend growers double our income and capital over a decade. (SJ-T) has more than met this criterion.
Yield Chart:

Comments:
Popularized by Investment Quality Trends (IQT) in the 1960s, ‘Dividend Yield Theory’ is simple and intuitive. It says that dividend yields tend to revert to the mean for quality dividend growth stocks, meaning those with stable business models that don’t significantly change over time.
In the case of Stella-Jones Inc., the dividend yield is the highest in the last ten years at 2.32%. According to the theory, (SJ-T) is currently undervalued based on today’s price. A five-year chart will show a similar undervaluation.
Performance Graph:
Source: FASTgraphs
Comments:
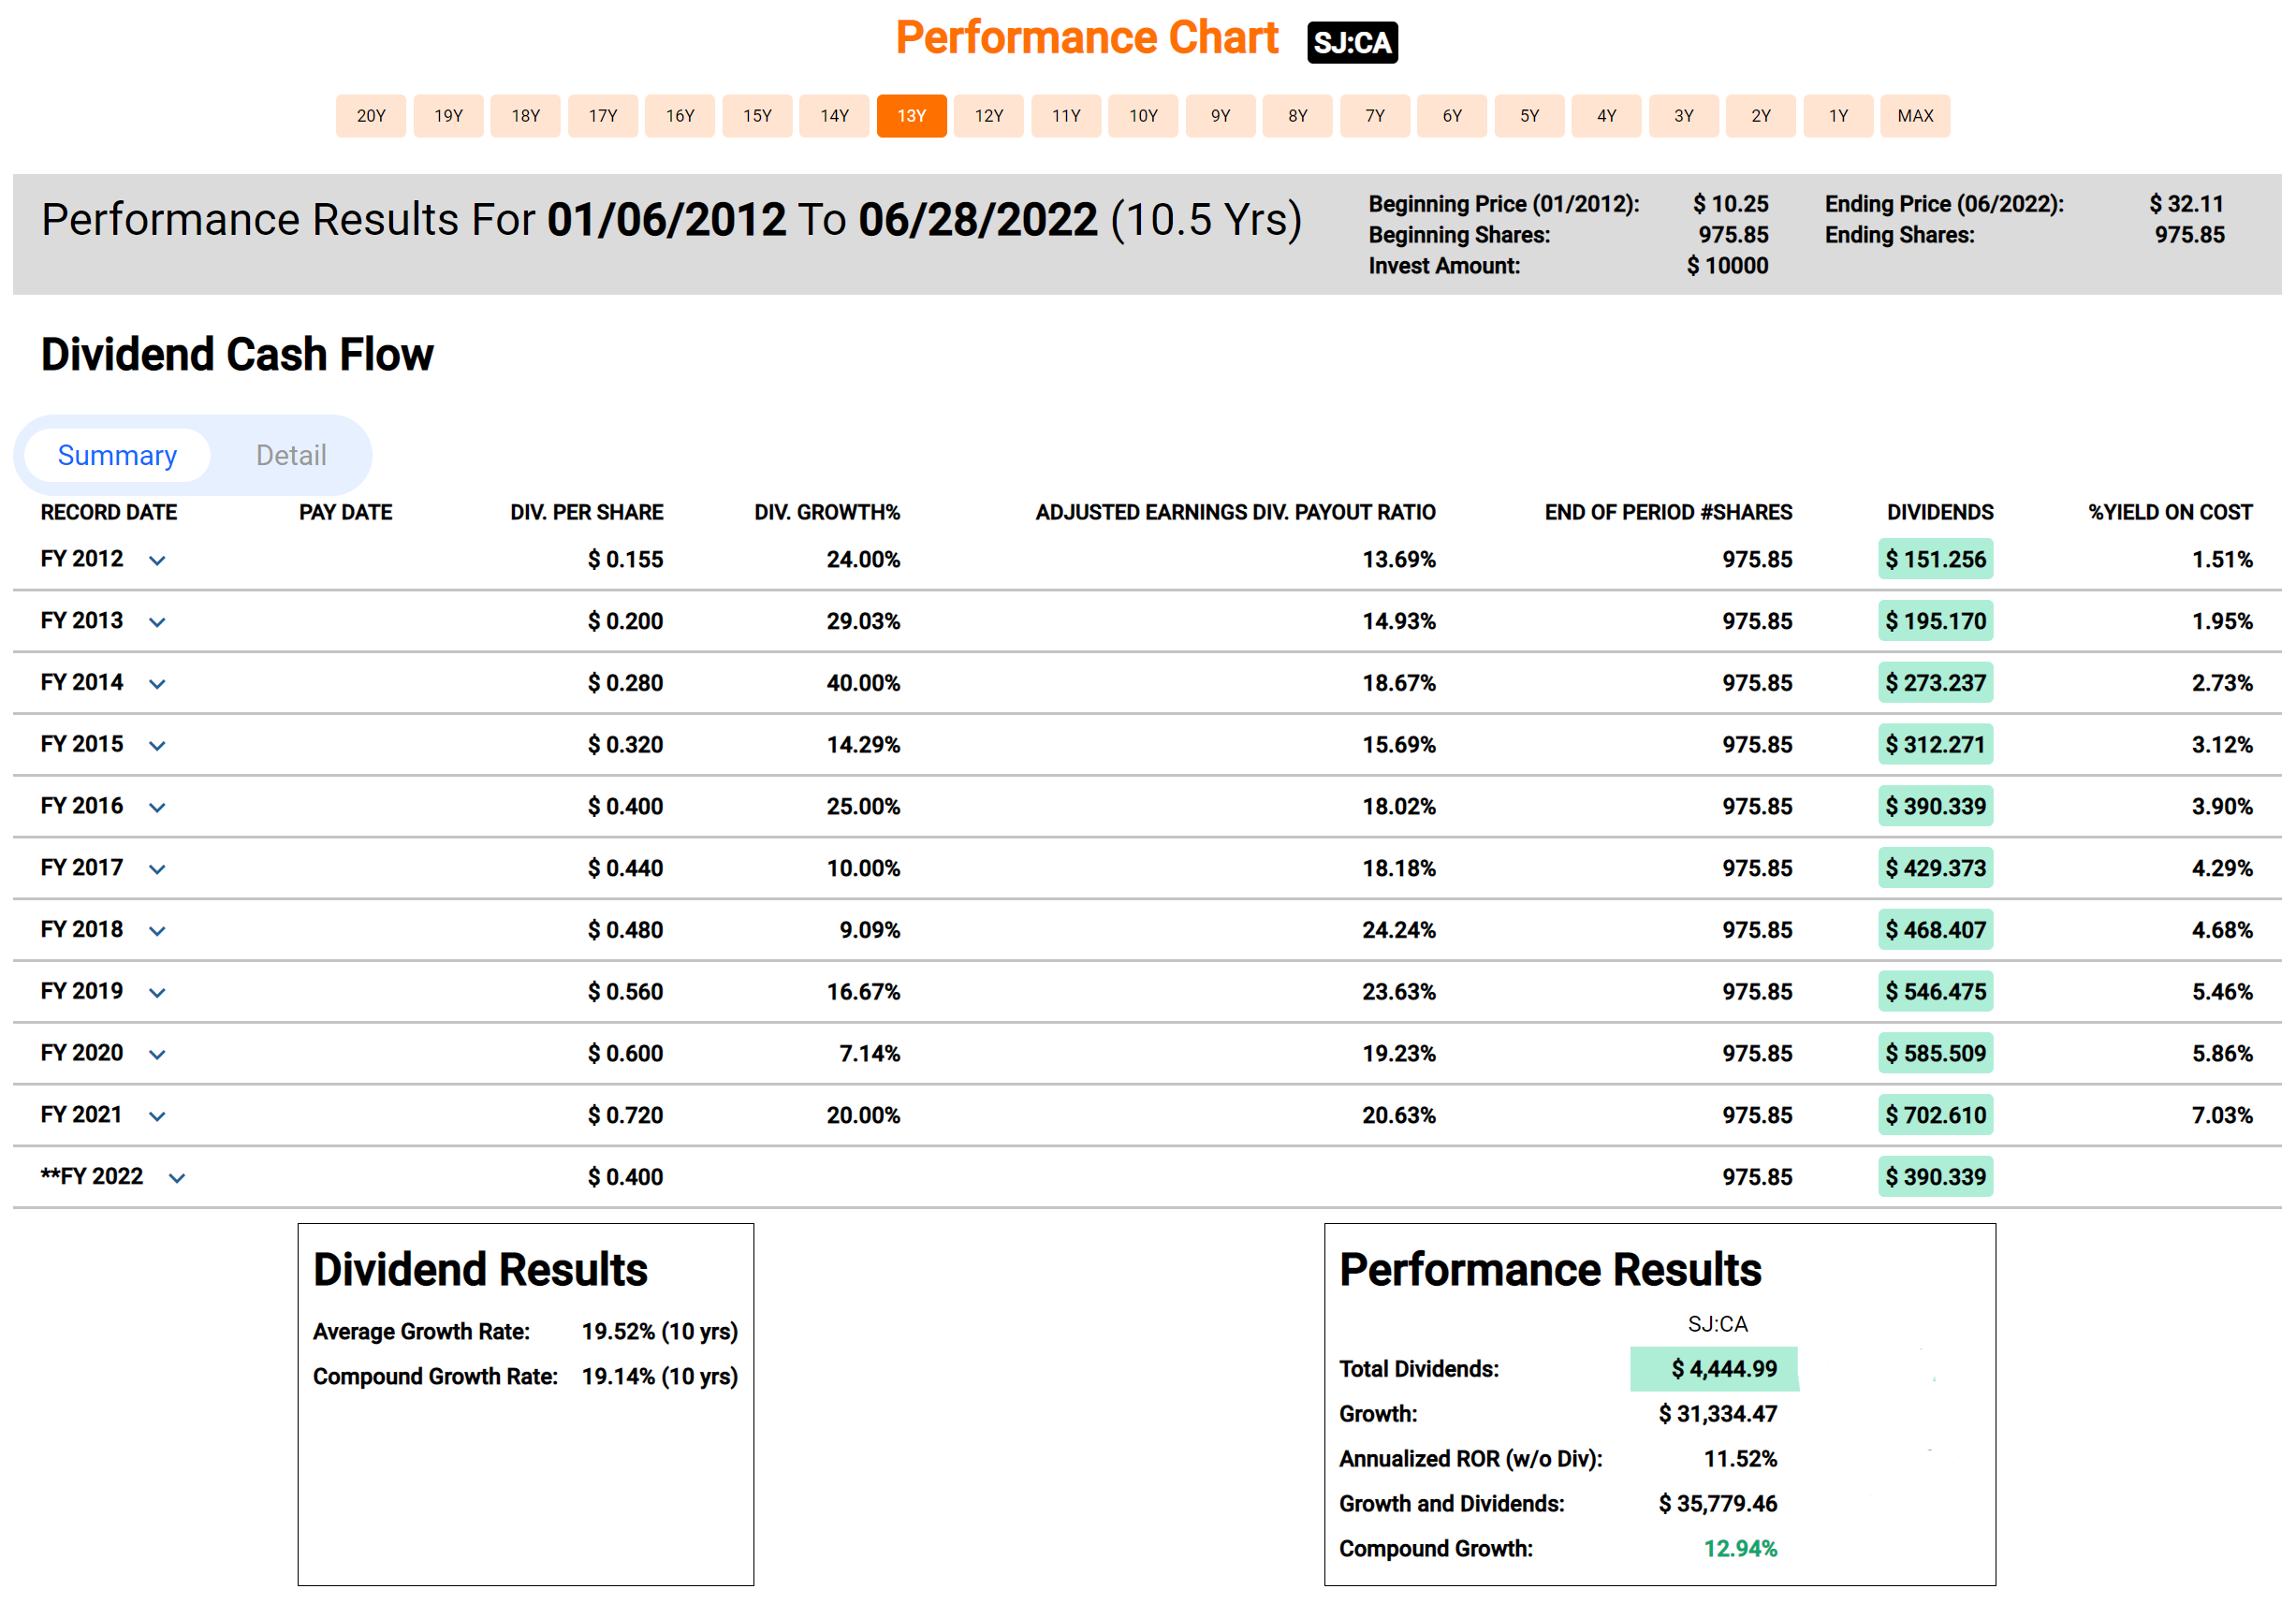
Stella-Jones Inc. has had an average annualized dividend growth rate of 19.14% over the last ten years. The Company also has an annualized total return of 12.94% over that period. (SJ-T) recently announced a dividend increase of ~11.0.
Estimated Earnings:

Source: FASTgraphs
Comments:
Using the “Normal Multiple’ estimating tool from FASTgraphs, we see a Normal P/E average over the last five years of 17.58. Based on Analysts’ forecasts one and a half years out, they are estimating an annualized return, based on today’s price, of 60.16% should (SJ-T) trade at its five-year average P/E.
Of importance is that analysts have been revising their estimates for 2022 downward but 2023 and 2024 upwards. Analysts believe the rest of 2022 will be challenging for Stella-Jones Inc. In the longer term, earnings are estimated to recover and grow.
Analyst Scorecard:
Source: FASTgraphs
Comments:
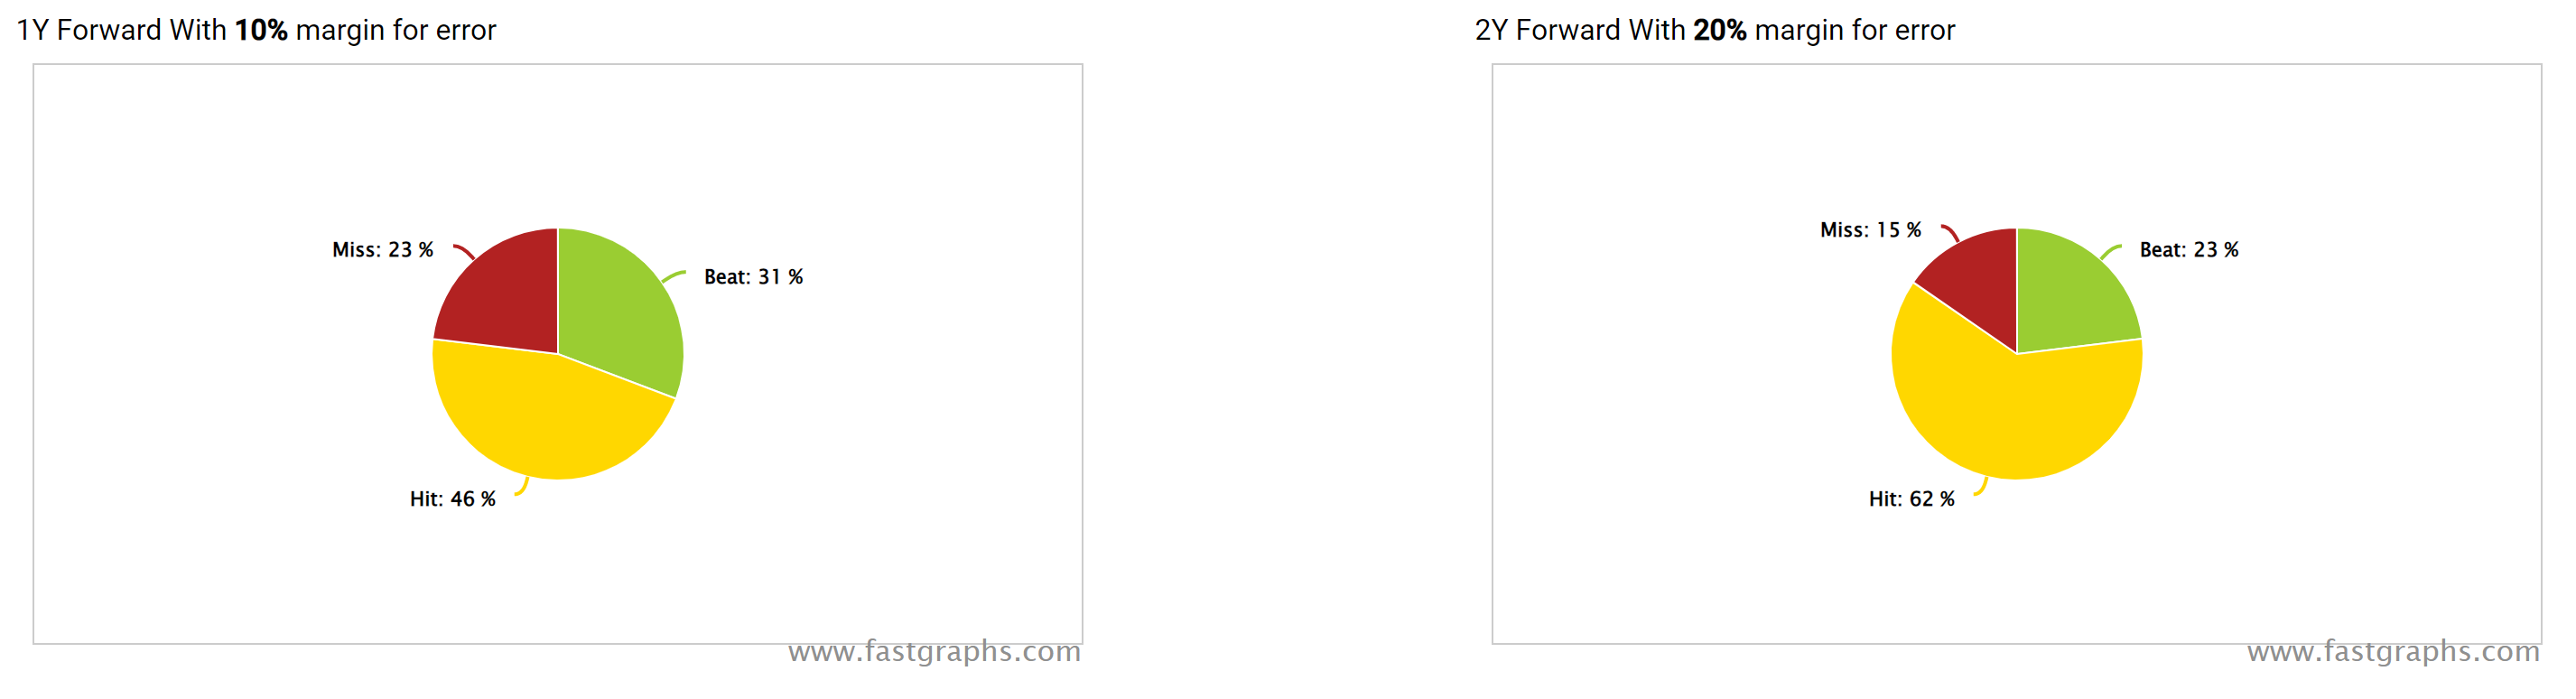
Analyst performance on hitting estimates over the years is above average on one and two-year earnings projections. Analysts’ forecasts have hit or beat ~77% of the time on one-year estimates and ~85% on two-year forecasts.
Recent Earnings Report-Q1 2022:
“With 2022 underway, we are pleased to report first-quarter results that delivered on our expectations,” stated Éric Vachon, President and CEO of Stella-Jones. “Sales increased quarter-over-quarter primarily due to strong organic growth in our infrastructure-related businesses and contributions from the recent Cahaba acquisitions. This growth was largely offset by lower residential lumber sales which, coupled with increasing input costs, pressured our margins. While contractual price adjustments are being implemented to cover escalating costs across the industry supply chain, we anticipate a certain degree of lag until the cost environment stabilizes.”
Sales for the first quarter of 2022 amounted to $651 million, up from sales of $623 million for the same period in 2021. Excluding the contribution from the acquisitions of Cahaba Pressure Treated Forest Products, Inc. and Cahaba Timber, Inc. of $15 million dollars, pressure-treated wood sales rose by $21 million, or 4%, mainly driven by strong organic growth across the Company’s infrastructure-related businesses, namely utility poles, railway ties and industrial products, offset in large part by a decrease in sales for residential lumber and logs and lumber product categories when compared to their exceptional sales growth in the first quarter of 2021.
Pressure-treated wood products:
- Utility poles (39% of Q1-22 sales): Utility poles sales amounted to $254 million in the first quarter of 2022, up from $206 million for the same period last year. Excluding the contribution from acquisitions, sales increased 16%, driven by the continued improvement in maintenance demand, upward price adjustments in response to cost increases and a better sales mix, mainly due to the impact of additional fire-resistant wrapped pole sales volumes.
- Railway ties (27% of Q1-22 sales): Sales of railway ties amounted to $175 million in the first quarter of 2022, up from $158 million for the corresponding period last year. The sales growth was almost all attributable to favourable sales price adjustments for Class 1 customers, largely to cover higher fibre costs, and higher pricing for non-Class 1 customers. Overall, volumes were relatively unchanged compared to the same period last year.
- Residential lumber (20% of Q1-22 sales): Residential lumber sales totalled $132 million in the first quarter of 2022, down from $166 million of sales generated in the first quarter of 2021. This decrease was largely attributable to lower sales volume, offset in part by the higher market price of lumber. While sales in the first quarter of 2022 were lower compared to the strong sales realized in the same quarter last year, they exceeded the $58 million of sales generated in the first quarter of the pre-pandemic year 2019, due to both pricing and volume gains.
- Industrial products (5% of Q1-22 sales): Industrial product sales amounted to $33 million in the first quarter of 2022, slightly up compared to the $28 million of sales generated a year ago, largely due to increased demand for pilings and timber.
Logs and lumber:
- Logs and lumber (9% of Q1-22 sales): Logs and lumber sales totaled $57 million in the first quarter of 2022, down from $65 million compared to the same period last year. In the course of procuring residential lumber, excess lumber is obtained and resold. The decrease in sales is largely due to less lumber trading activity compared to same period last year.
Outlook:
Stella-Jones’ sales are primarily to critical infrastructure-related businesses. While all product categories can be impacted by short-term fluctuations, the overall business is mostly based on replacement and maintenance-driven requirements, which are rooted in long-term planning. Corresponding to this longer-term horizon and to better reflect the expected sales run-rate for residential lumber and reduce the impact of commodity price volatility, the Company shifted its guidance to a three-year outlook in early 2022. Below are key highlights of the 2022-2024 outlook with a more comprehensive version, including management assumptions, available in the Company’s MD&A.
Key Highlights:
- Compound annual sales growth rate in the mid-single digit range from 2019 pre-pandemic levels to 2024;
- EBITDA margin of approximately 15% for the 2022-2024 period;
- Capital investment of $90 to $100 million to support the growing demand of its infrastructure-related customer base, in addition to the $50 to $60 million of annual capital expenditures;
- Residential lumber sales expected to stabilize between 20-25% of total sales while infrastructure-related businesses expected to grow and represent 75-80% of total sales by 2024;
- Anticipated returns to shareholders between $500 and $600 million during three-year outlook period;
- Leverage ratio of 2.0x-2.5x between 2022-2024, but may temporarily exceed range to pursue acquisitions.
“In terms of market dynamics, customer demand for utility poles remains robust, based on planned infrastructure investments as well as ongoing replacement programs by utility and telecommunication companies. The trend for railway ties is also positive for 2022, although we are experiencing longer than expected tightness in the market supply for untreated ties. Residential lumber sales in the first quarter were higher than expected, but the peak summer season will be more telling as to the overall performance of this business for the year. In short, we are laying the foundation to achieve our three-year strategic plan and our performance for the first quarter provides a good start,” concluded Mr. Vachon.
Analyst coverage:
Analyst Michael Tupholme lowered his price target on shares of the Canadian producer of industrial pressure-treated wood products to $45 from $50, following a series of virtual investor meetings with SJ’s management.
“There was no material new information provided that would cause us to change our views regarding SJ’s overall outlook,” Tupholme said in a note to clients. “Still, on the whole, we characterize management’s commentary and the tone of the meetings as generally encouraging, particularly when considered in the context of recent equity market declines and increased concerns regarding the broader economic outlook.”
“We continue to see SJ’s valuation as overly depressed and believe that the stock offers compelling long-term upside potential,” the analyst said. “At the same time, given current heightened investor concern around the economic outlook, we believe that a recovery in the stock’s valuation may take longer than previously expected, which, along with what we see as a lack of near-term catalysts for SJ, has caused us to lower our recommendation…”
Conclusion:
(SJ-T) is ‘sensibly priced’ at current levels. There is also a margin of safety built-in compared to historical fundamentals. We are watching this one closely for revised guidance or further price weakness and a possible entry point for our MP Wealth-Builder Model Portfolio (CDN). Learn More.