MP Market Review – January 26, 2024
Last updated by BM on January 29, 2024
Summary
This is a weekly installment of our MP Market Review series, which provides updates on the financial markets and Canadian dividend growth companies we monitor on ‘The List’.
- Last week, ‘The List’ was up with a YTD price return of +2.0% (capital). Dividends have increased by +3.0% YTD, highlighting the growth in the dividend (income).
- Last week, there was one dividend announcement from companies on ‘The List’.
- Last week, there was one earnings report from companies on ‘The List’.
- Two companies on ‘The List’ are due to report earnings this week.
DGI Scoreboard
The List (2024)
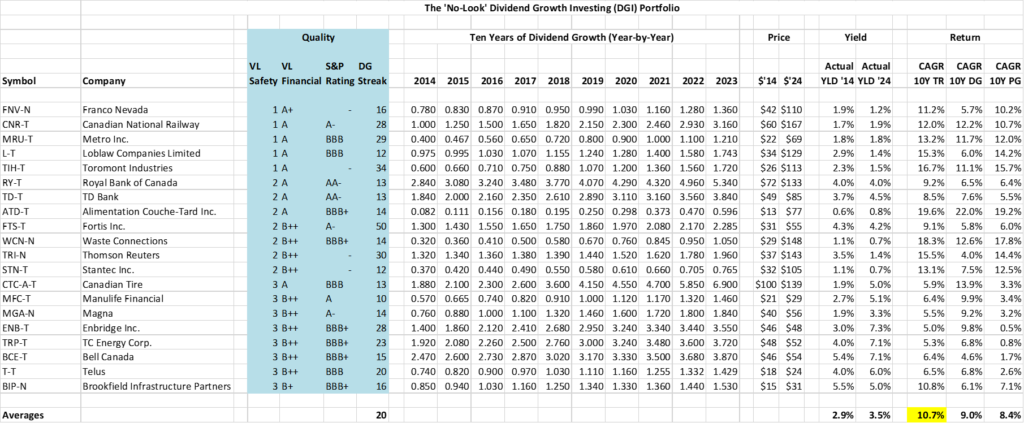
The Magic Pants 2024 list includes 28 Canadian dividend growth stocks. Here are the criteria to be considered a candidate on ‘The List’:
- Dividend growth streak: 10 years or more.
- Market cap: Minimum one billion dollars.
- Diversification: Limit of five companies per sector, preferably two per industry.
- Cyclicality: Exclude REITs and pure-play energy companies due to high cyclicality.
Based on these criteria, companies on ‘The List’ are added or removed annually on Jan. 1. Prices and dividends are updated weekly.
While ‘The List’ does not function as a portfolio on its own, it serves as an excellent initial reference for individuals looking to diversify their investments and achieve higher returns in the Canadian stock market. Through our newsletter, readers gain a deeper understanding of how to implement and benefit from our Canadian dividend growth investing strategy.
For those interested in something more, please upgrade to a paid subscriber; you get the enhanced weekly newsletter, access to premium content, full privileges on the new Substack website magicpants.substack.com and DGI alerts whenever we make stock transactions in our portfolio.
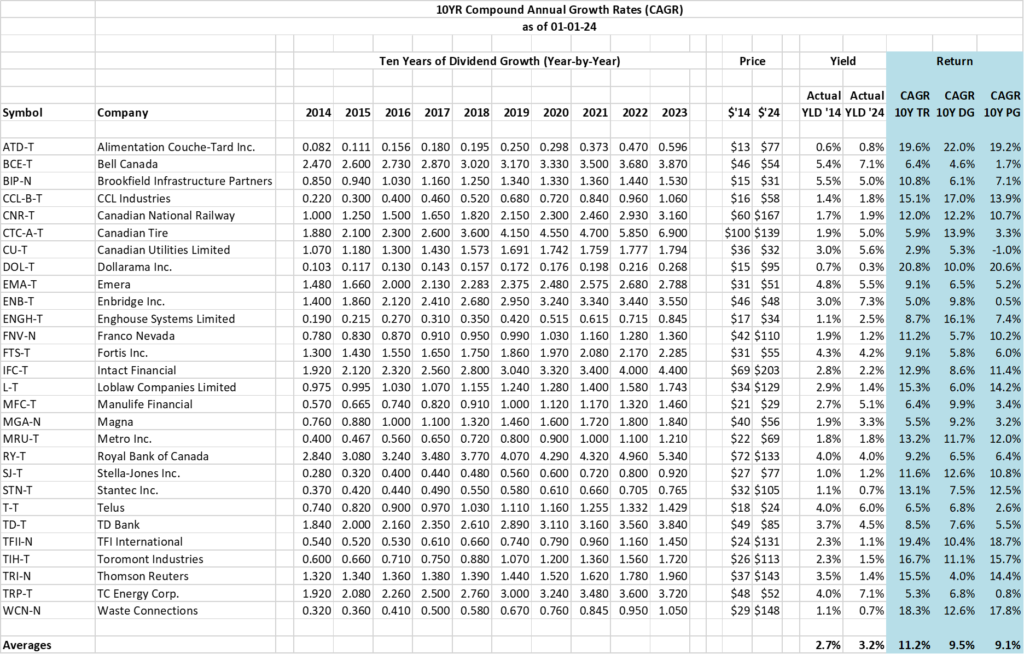
Performance of ‘The List’
Last week, ‘The List’ was up with a price return of +2.0% (capital). Dividend growth is looking as dependable as always. Dividends have increased by +3.0% YTD, highlighting the growth in our income.
The best performers last week on ‘The List’ were CCL Industries (CCL-B-T), up +3.5%; Manulife Financial (MFC-T), up +3.2%; and Enghouse Systems Limited (ENGH-T), up +3.1%.
Stella-Jones Inc. (SJ-T) was the worst performer last week, down -6.1%.
| SYMBOL | COMPANY | YLD | PRICE | YTD % | DIV | YTD % | STREAK |
|---|---|---|---|---|---|---|---|
| ATD-T | Alimentation Couche-Tard Inc. | 0.9% | $79.65 | 3.8% | $0.70 | 17.4% | 14 |
| BCE-T | Bell Canada | 7.1% | $54.79 | 1.1% | $3.87 | 0.0% | 15 |
| BIP-N | Brookfield Infrastructure Partners | 4.4% | $31.20 | 1.7% | $1.53 | 0.0% | 15 |
| CCL-B-T | CCL Industries | 1.8% | $58.93 | 1.9% | $1.06 | 0.0% | 22 |
| CNR-T | Canadian National Railway | 2.0% | $166.65 | -0.1% | $3.38 | 7.0% | 28 |
| CTC-A-T | Canadian Tire | 4.7% | $148.00 | 6.8% | $7.00 | 1.4% | 13 |
| CU-T | Canadian Utilities Limited | 5.7% | $31.42 | -2.2% | $1.79 | 0.0% | 52 |
| DOL-T | Dollarama Inc. | 0.3% | $99.26 | 4.5% | $0.28 | 5.8% | 13 |
| EMA-T | Emera | 5.9% | $48.84 | -3.8% | $2.87 | 3.0% | 17 |
| ENB-T | Enbridge Inc. | 7.6% | $48.26 | -0.3% | $3.66 | 3.1% | 28 |
| ENGH-T | Enghouse Systems Limited | 2.3% | $37.45 | 10.2% | $0.88 | 4.1% | 17 |
| FNV-N | Franco Nevada | 1.3% | $108.19 | -1.8% | $1.36 | 0.0% | 16 |
| FTS-T | Fortis Inc. | 4.4% | $53.40 | -2.6% | $2.36 | 3.3% | 50 |
| IFC-T | Intact Financial | 2.1% | $208.93 | 2.8% | $4.40 | 0.0% | 19 |
| L-T | Loblaw Companies Limited | 1.3% | $133.55 | 3.9% | $1.78 | 2.4% | 12 |
| MFC-T | Manulife Financial | 5.0% | $29.39 | 1.8% | $1.46 | 0.0% | 10 |
| MGA-N | Magna | 3.3% | $55.73 | 0.4% | $1.84 | 0.0% | 14 |
| MRU-T | Metro Inc. | 1.7% | $71.19 | 3.9% | $1.21 | 0.0% | 29 |
| RY-T | Royal Bank of Canada | 4.2% | $132.99 | 0.0% | $5.52 | 3.4% | 13 |
| SJ-T | Stella-Jones Inc. | 1.2% | $80.00 | 4.4% | $0.92 | 0.0% | 19 |
| STN-T | Stantec Inc. | 0.7% | $108.89 | 4.0% | $0.78 | 2.0% | 12 |
| T-T | Telus | 6.2% | $24.35 | 2.7% | $1.50 | 5.2% | 20 |
| TD-T | TD Bank | 5.0% | $82.23 | -2.9% | $4.08 | 6.3% | 13 |
| TFII-N | TFI International | 1.2% | $134.19 | 2.3% | $1.60 | 10.3% | 13 |
| TIH-T | Toromont Industries | 1.5% | $116.87 | 3.6% | $1.72 | 0.0% | 34 |
| TRI-N | Thomson Reuters | 1.3% | $149.36 | 4.2% | $1.96 | 0.0% | 30 |
| TRP-T | TC Energy Corp. | 7.0% | $52.94 | 1.2% | $3.72 | 0.0% | 23 |
| WCN-N | Waste Connections | 0.7% | $154.41 | 4.2% | $1.14 | 8.6% | 14 |
| Averages | 3.2% | 2.0% | 3.0% | 21 |
Note: Stocks ending in “-N” declare earnings and dividends in US dollars. To achieve currency consistency between dividends and share price for these stocks, we have shown dividends in US dollars and share price in US dollars (these stocks are listed on a US exchange). The dividends for their Canadian counterparts (-T) would be converted into CDN dollars and would fluctuate with the exchange rate.
DGI Clipboard
“People put money into index funds partly because indexes beat most active managers. Nothing is going to change that because, collectively, active managers hold essentially the same assets as the indexes. So collectively, their returns have to be the same, minus costs, which are larger.”
– Rob Arnott, Barron`s December 2008
Friends Don’t Let Friends Buy Index Funds (ETFs)
Almost every week now, we publish a study showing the underperformance of actively managed funds versus passively managed funds or indexes. We highlight one such study in our DGI News section this week. Rather than jump on the bandwagon of indexers (ETFs) or beat up the actively- managed crowd any further, we want to show you the reasons why our DGI strategy outperforms both.
Here are the reasons why we outperform:
Our income and portfolio returns are more predictable.
Owning investments that produce reliable income allows you to navigate market volatility confidently, as you patiently anticipate the growth of dividends to propel price appreciation. Our strategy doesn’t hinge on the expectation of another investor purchasing our stock; rather, we rely on the steady increase in dividends to generate capital gains. We actively pursue and successfully achieve both objectives.
“Certainly, prices still fluctuate. But ours do so around a stable and predictable CAGR dividend core.”
– Tom Connolly
Most managers of dividend funds and dividend ETFs skew toward income. Our strategy picks up both.
Our portfolios are concentrated with only the best individual stocks in a sector.
Our portfolios focus on a select group of quality individual stocks within a specific sector. The freedom to personally select dividend growth companies based on our established criteria (DGI quality indicators) enables us to tailor our portfolios to meet our unique goals and objectives.
Exclusively holding the finest companies in our portfolios prevents our returns from being diluted by underperformers or entities in sectors currently out of favor. Why compromise the performance of robust dividend growers with mediocre opportunities?
Funds and ETFs own too many mediocre companies.
We have diversification across industries but don’t over diversify.
In their book ‘Investment Analysis and Portfolio Management’, Frank Reilly and Keith Brown reported that in one set of studies for randomly selected stocks, “…about 90% of the maximum benefit of diversification was derived from portfolios of 12 to 18 stocks.”
We don’t need to own hundreds of companies to mitigate risk. When you own quality companies, risk is in the price you pay for them, not in the number of companies you own.
Most funds and ETFs own far too many stocks to maximize diversification’s benefit.
We can exploit mismatches in market pricing. Being able to “buy low and sell high” is what gives us an edge.
Many of the stocks we invest in have a ‘narrow valuation corridor’, meaning the stock price follows a path that rarely deviates from its historical trading range. Finding companies that follow this pattern allows us to enter positions on price weakness at higher yields and with higher potential price appreciation down the road. Winnowing or exiting positions when prices go beyond these ranges is a good way to generate better returns during periods of price strength.
Actively managed funds and ETFs are typically fully invested. When the downdraft arrives, there’s no cash to buy quality companies. In addition, depending on the mandate of the fund or ETF they may also be forced to rebalance according to a predetermined schedule.
Dividend growth investors HOLD.
If our dividend growth companies continue to increase their dividends and nothing fundamentally changes with the underlying business, we hold.
Fund managers are constrained by the necessity to prioritize short-term thinking, focusing on quarterly statistics. Underperformance in quarterly results poses a potential risk to their careers, leading them to align their strategies with those of their peers and follow similar approaches. Essentially, they must herd…do roughly the same thing.
ETFs are mandated to trade frequently and miss out on the benefit of increasing cash flow.
In 2012, I switched to dividend growth investing and began telling all my friends about it. You should, too.
Check us out on magicpants.substack.com for more info in this week’s issue….