“You have a pair of pants. In the left pocket, you have $100. You take $1 out of the left pocket and put in the right pocket. You now have $101. There is no diminution of dollars in your left pocket. That is one magic pair of pants.”

MP Market Review – January 27, 2023

Last updated by BM on January 30, 2023

Summary

  • This article is part of our weekly series (MP Market Review) highlighting the performance and activity from the previous week related to the financial markets and Canadian dividend growth companies we follow on ‘The List’.
  • Last week, ‘The List’ was down slightly with a +3.8% YTD price return (capital). Dividend growth of ‘The List’ increased to +4.4% YTD, demonstrating the rise in income over the last year.
  • Last week, there were two dividend increases from companies on ‘The List’.
  • Last week, there were two earnings reports from companies on ‘The List’.
  • Two companies on ‘The List’ are due to report earnings this week.
  • Are you looking to build an income portfolio of your own? When you become a premium subscriber, you get exclusive access to the MP Wealth-Builder Model Portfolio (CDN) and subscriber-only content. Start building real wealth today!  Learn More

“Investing is where you find a few great companies and then sit on your ass.”

– Charlie Munger

Noticing that two great companies (MRU-T) and (CNR-T) increased their dividends last week, we couldn’t help but wonder what our list of quality dividend growers would look like if one of our criteria were twenty years of dividend growth instead of ten. The list would be smaller, but we wondered what their dividend growth metrics would look like. Here is what we found:

10YR_CAGR-The List-01-01-2023 – 20+ YR of DG

Remember that the data in this chart displays returns derived from purchases made on January 1, 2013, regardless of valuation. By being a bit more active and following our process of only buying when companies are sensibly priced, we strive to do even better than this passive approach.

In summary, many metrics are similar, which tells you a few of things:

First, from a total return perspective, owning twenty-seven dividend growth stocks isn’t much different from owning eight non-cyclical, quality dividend growers, across a few sectors. In fact, you would probably be just as well off owning a basket of ten to fifteen quality companies from ‘The List’ as opposed to the entire list of dividend growth stocks we follow. It certainly would be a lot easier to monitor a smaller portfolio.

Secondly, these companies once had dividend growth streaks of ten years and comprised a very small list of dividend growth stocks in Canada. Seeing them extend their streaks for an additional ten years and beyond tells you how safe investing in companies with an established dividend growth policy can become.

Finally, the returns from companies with dividend streaks longer than twenty years appear to be even more predictable using our Growth Yield metric. Both the Historical Growth Yield and Estimated Growth Yield are almost identical. Historically, building a dividend growth portfolio with a >7% Estimated Growth Yield has been among the best predictors of market-beating returns.

For more info on Growth Yield, see one of our Top Posts; Using Growth Yield (YOC) To Build Powerful DGI Portfolios.

Performance of ‘The List’

At the end of the post is a snapshot of ‘The List’ from last Friday’s close. Feel free to click on the ‘The List’ menu item above for a sortable version.

Last week, ‘The List’ was down slightly with a +3.8% YTD price return (capital). Dividend growth of ‘The List’ increased to +4.4% YTD, demonstrating the rise in income over the last year.

The best performers last week on ‘The List’ were Canadian Tire (CTC-A-T), up +4.02%; Toromont Industries (TIH-T), up +3.73%; and TD Bank (TD-T), up +2.51%.

Canadian National Railway (CNR-T) was the worst performer last week, down -4.55%.

Recent News

Monetary Policy Report Press Conference Opening Statement

https://www.bankofcanada.ca/2023/01/opening-statement-2023-01-25/

The Canadian government announced a 25 basis point hike last week, bringing their policy interest rate to 4.50%. They then said that they are now taking a wait-and-see approach before signalling any further hikes. Some see this as a sign that the Bank of Canada may soon pivot and start reductions as early as September. No one really knows. After all, inflation was supposed to be ‘transitory’ back in 2021, according to our central banks. As investors, we want to know how this current information affects the earnings of our quality dividend growers.

A little further down the article we get our answer in the economic outlook section.

“Putting this together, we expect growth in Canada to stall through the middle of this year before picking up later in the year. We project that, on an annual average basis, growth in Canada’s gross domestic product will slow from about 3½% in 2022 to about 1% in 2023 and 2% in 2024.”

With the economy slowing, historical valuation metrics should come back in line for our quality dividend growers allowing us to purchase them at sensible prices.

(CNR-T) alluded to the economy slowing last week in their outlook for 2023.


Climate-minded electrical companies look to improve their weakest link: the wooden utility pole (Globe & Mail)

https://www.theglobeandmail.com/canada/article-climate-change-electricity-utility-poles/

“Many major utilities predict that climate change will take a mounting toll on their infrastructure. Their preparations are whipping up a bonanza in the utility pole business.”

When we saw the headline, we immediately thought of Stella Jones (SJ-T), one of the companies on ‘The List’ and a quality dividend grower of eighteen years. The company is highlighted in this article as they are North America’s largest provider of wooden utility poles. Although Stella Jones addresses some of the pitfalls of traditional wooden poles, it is worth keeping an eye on the trend to find alternatives to this approach. In the short term, the cost looks prohibitive to new technologies but is still worth monitoring.

Dividend Increases

Last week, there were two dividend increases from companies on ‘The List’.

Metro (MRU-T) on Tuesday, January 24, 2023, said it increased its 2023 quarterly dividend from $0.275 to $0.3025 per share, payable March 06, 2023, to shareholders of record on February 08, 2023.

This represents a dividend increase of +10.0%, marking the 29th straight year of dividend growth for this quality grocer.

Canadian National Railway (CNR-T) on Tuesday, January 24, 2023, said it increased its 2023 quarterly dividend from $0.7325 to $0.79 per share, payable March 31, 2023, to shareholders of record on March 10, 2023.

This represents a dividend increase of +7.85%, marking the 28th straight year of dividend growth for this quality railroad.

Earnings Releases

Two companies on ‘The List’ are due to report earnings this week.  

Brookfield Infrastructure Partners (BIP-N) will release its fourth-quarter 2022 results on Thursday, February 2, 2023, before markets open.

Bell Canada (BCE-T) will release its fourth-quarter 2022 results on Thursday, February 2, 2023, before markets open.

Last week, two companies on ‘The List’, reported their earnings.

Metro (MRU-T) released its first-quarter 2023 results on Tuesday, January 24, 2023, before markets opened.

“We delivered solid results in the first quarter, gaining market share in a very competitive environment. As inflationary pressures persist, our teams did an excellent job to offer the best value possible to customers in our stores, pharmacies and online and I thank them for their hard work. We will continue to execute on our business plans to deliver a strong value proposition to our customers, invest in our retail network and infrastructure, and support our communities. As the Company proudly celebrates its 75th anniversary, we look forward to continued growth and success for all stakeholders.”

 – Chief Executive Officer, Eric La Fleche

Highlights:

  • Sales of $4,670.9 million, up 8.2%
  • Food same-store sales up 7.5%
  • Pharmacy same-store sales up 7.7%
  • Net earnings of $231.1 million, up 11.3%, and adjusted net earnings of $237.6 million, up 10.9%
  • Fully diluted net earnings per share of $0.97, up 14.1%, and adjusted fully diluted net earnings per share of $1.00, up 13.6%
  • Declared dividend of $0.3025 per share, up 10.0% versus last year

Outlook:

“As we begin our second quarter, market challenges and inflationary pressures persist, and our focus remains on delivering value to our customers while executing on our strategic priorities. In a very competitive market environment, we are well-positioned to meet our customers’ high expectations and continue to create long-term value for our shareholders.”

– Chief Executive Officer, Eric La Fleche

 See the full Earnings Release here


Canadian National Railway (CNR-T) released its fourth-quarter 2022 results on Tuesday, January 24, 2023, after markets closed.

“I am very proud of the work accomplished by our team in the fourth quarter and throughout the year. Our approach to scheduled railroading improved our service to our customers, drove operational efficiency, and built the resiliency that enabled a rapid recovery during the extreme winter conditions late in the quarter. As we look to 2023, we believe our back to-basics strategy and disciplined operating model will continue to deliver despite the softening economy.”

– Tracy Robinson, President and Chief Executive Officer, CN

Highlights:

Fourth-quarter 2022 compared to fourth-quarter 2021

  • Revenues of C$4,542 million, an increase of C$789 million or 21%.
  • Operating income of C$1,912 million, an increase of 22%, or an increase of 21% on an adjusted basis.
  • Diluted EPS of C$2.10, an increase of 24%, or an increase of 23% on an adjusted basis. 
  • Operating ratio, defined as operating expenses as a percentage of revenues, of 57.9%, an improvement of 0.4 points, or remained flat on an adjusted basis

Outlook:

CN expects to deliver EPS growth in the low single-digit range due to a softer economic outlook.

 See the full Earnings Release here


Below is a snapshot of ‘The List’ from last Friday’s close. For a sortable version of ‘The List’, please click on The List menu item.

‘The List’ is not intended to be a portfolio others replicate. Rather, its purpose is to provide investment ideas and a real-time illustration of dividend growth investing in action. It is not a ‘Buy List’ nor reflects the composition or returns of our Magic Pants Wealth-Builder (CDN) Portfolios. It is only a starting point for our analysis and discussion of dividend growth investing concepts.


The List (2023)
Last updated by BM on January 27, 2023

*Note: The following graph is wide, you can scroll to the right on your device to see more of the data.

SYMBOL COMPANY YLD PRICE YTD % DIV YTD % STREAK
AQN-N Algonquin Power & Utilities 6.9% $7.30 8.5% $0.51 -29.0% 12
ATD-T Alimentation Couche-Tard Inc. 0.9% $59.67 -0.8% $0.56 19.1% 13
BCE-T Bell Canada 5.9% $62.32 3.5% $3.68 1.1% 14
BIP-N Brookfield Infrastructure Partners 4.4% $32.95 5.2% $1.44 0.0% 15
CCL-B-T CCL Industries 1.5% $62.17 7.1% $0.96 0.0% 21
CNR-T Canadian National Railway 2.0% $157.51 -3.3% $3.16 7.8% 27
CTC-A-T Canadian Tire 4.3% $161.89 10.4% $6.90 17.9% 12
CU-T Canadian Utilities Limited 4.8% $37.13 0.5% $1.78 0.0% 51
DOL-T Dollarama Inc. 0.3% $80.25 0.5% $0.22 2.3% 12
EMA-T Emera 5.1% $53.62 1.9% $2.76 3.0% 16
ENB-T Enbridge Inc. 6.5% $54.40 2.0% $3.55 3.2% 27
ENGH-T Enghouse Systems Limited 1.9% $39.31 10.1% $0.74 3.5% 16
FNV-N Franco Nevada 0.9% $146.87 6.3% $1.36 6.3% 15
FTS-T Fortis 4.1% $54.74 -1.1% $2.26 4.1% 49
IFC-T Intact Financial 2.1% $193.15 -1.3% $4.00 0.0% 18
L-T Loblaws 1.3% $120.99 0.5% $1.62 5.2% 11
MGA-N Magna 2.8% $63.89 11.1% $1.80 0.0% 13
MRU-T Metro 1.7% $73.04 -3.2% $1.21 10.0% 28
RY-T Royal Bank of Canada 3.9% $134.65 5.2% $5.28 6.5% 12
SJ-T Stella-Jones Inc. 1.7% $47.47 -4.3% $0.80 0.0% 18
STN-T Stantec Inc. 1.0% $68.71 5.2% $0.72 2.1% 11
TD-T TD Bank 4.2% $91.42 4.3% $3.84 7.9% 12
TFII-N TFI International 1.3% $109.14 9.0% $1.40 29.6% 12
TIH-T Toromont Industries 1.5% $106.93 9.4% $1.56 2.6% 33
TRP-T TC Energy Corp. 6.2% $57.70 8.3% $3.60 0.8% 22
T-T Telus 4.9% $28.40 7.9% $1.40 5.4% 19
WCN-N Waste Connections 0.8% $131.28 -0.3% $1.02 7.9% 13
Averages 3.1% 3.8% 4.4% 19

MP Market Review – January 20, 2023

Last updated by BM on January 23, 2023

Summary

  • This article is part of our weekly series (MP Market Review) highlighting the performance and activity from the previous week related to the financial markets and Canadian dividend growth companies we follow on ‘The List’.
  • Last week, ‘The List’ was up slightly with a positive +4.1% YTD price return (capital). Dividend growth of ‘The List’ ticked upwards to +3.7% YTD, demonstrating the rise in income over the last year.
  • Last week, there was one dividend increase from a company on ‘The List’.
  • Last week, there were no earnings reports from companies on ‘The List’.
  • Two companies on ‘The List’ are due to report earnings this week.
  • Are you looking to build an income portfolio of your own? When you become a premium subscriber, you get exclusive access to the MP Wealth-Builder Model Portfolio (CDN) and subscriber-only content. Start building real wealth today!  Learn More

“We all hope for capital gains, but the only thing we can really count on is the dividend” and “If you aren’t willing to own a stock for 10 years, don’t even think about owning it for 10 minutes.”

– Warren Buffett

As successful dividend growth investors, we understand that rising dividends are a foundation for higher share prices over time. 

Here is the Compound Annual Growth Rate (CAGR) of dividends and the CAGR of price over the last decade so that you can study the evidence that as the dividend grows, so does the price.

10YR_CAGR-The List-01-01-2023

A few things are to be gleaned from this historical data.

First, the current yield of ‘The List’ is rising. Stocks were expensive in 2013 and are more sensibly priced now than they were a decade ago.

Secondly, the historical growth yield of ‘The List’ at 6.6% is only about 1% lower than the total annualized return (7.7%) of the TSX composite index over the last decade. Dividends alone, received from companies on ‘The List’ bought ten years ago, will soon outperform the total return of the index after a couple more years of dividend growth.

Nineteen of the twenty-seven companies on ‘The List’ more than doubled their price in the last decade, and you would be hard-pressed to find a dividend ETF or dividend mutual fund that outperformed the total return (CAGR 10Y TR) of ‘The List’ in the last ten years.

Finally, notice the alignment of dividend growth (CAGR 10Y DG) and price growth (CAGR 10Y PG). For the last decade, they have been almost identical, with annualized returns of 10.0% and 10.3%. An increasing income, over time, drives our capital returns.

Once again our yearly decade long, annual year-by-year dividends sheet shows our dividends are stable and predictable. Understanding how dividends work and how they ultimately drive portfolio performance is one of the most powerful concepts to understand about investing. It is what we do differently that sets us apart from the crowd.

Performance of ‘The List’

At the end of the post is a snapshot of ‘The List’ from last Friday’s close. Feel free to click on the ‘The List’ menu item above for a sortable version.

Last week, ‘The List’ was up slightly with a positive +4.1% YTD price return (capital). Dividend growth of ‘The List’ ticked upwards at +3.7% YTD, demonstrating the rise in income over the last year.

The best performers last week on ‘The List’ were Algonquin Power & Utilities (AQN-N), up +7.81%; Loblaws (L-T), up +2.02%; and CCL Industries (CCL-B-T), up +1.28%.

Toromont Industries (TIH-T) was the worst performer last week, down -3.56%.

Recent News

Confused about investing in 2023? Here’s a tried and tested approach. (Globe & Mail)

https://www.theglobeandmail.com/investing/markets/inside-the-market/article-confused-about-investing-in-2023-heres-a-tried-and-tested-approach/

My friends say I am old-fashioned and traditional, and my views don’t mesh very well with current times and the younger generation. I hope they don’t read this article, or they may have to change their opinion. The author likes our tried and tested approach. We simply wished he had mentioned dividend growth companies as a further return catalyst.

The three lessons from the article align well with our DGI Truths, and Mr. Buffett’s quote puts a stamp on them. 

Why your dividend stocks could use another look (Globe & Mail)

https://www.theglobeandmail.com/investing/markets/inside-the-market/article-dividend-stocks/

“This is no longer the old dividend universe where you could cobble together a dozen dividend-paying names, buy them and forget it,” Craig Basinger, chief market strategist at Purpose Investments, wrote in a report.

The author suggests that yield-hungry dividend investors will look elsewhere for income, with rising interest rates making fixed-income a safer bet. The impending recession will also not bode well for many dividend-paying companies with high debt levels.

Nothing new here, as most financial media strategists tend to paint all dividend-paying stocks with the same brush.

We do things differently. We assemble portfolios of high-quality companies with consecutive dividend growth streaks bought at sensible prices. Dividend growth investors have been around for decades and have seen their share of high-interest environments and recessions with little long-term impact on their returns.

Dividend Increases

One company on ‘The List’ announced a dividend increase last week.

Franco Nevada (FNV-N) on Tuesday said it increased its 2023 quarterly dividend from $0.32 to $0.34 per share, payable March 30, 2023, to shareholders of record on March 16, 2023.

This represents a dividend increase of +6.25%, marking the 16th straight year of dividend growth for this quality royalty and streaming company.

Earnings Releases

Two companies on ‘The List’ are due to report earnings this week.  

Metro (MRU-T) will release its first-quarter 2023 results on Tuesday, January 24, 2023, before markets open.

Canadian National Railway (CNR-T) will release its fourth-quarter 2022 results on Tuesday, January 24, 2023, after markets close.

Last week, there were no earnings reports from companies on ‘The List’.


Below is a snapshot of ‘The List’ from last Friday’s close. For a sortable version of ‘The List’, please click on The List menu item.

‘The List’ is not intended to be a portfolio others replicate. Rather, its purpose is to provide investment ideas and a real-time illustration of dividend growth investing in action. It is not a ‘Buy List’ nor reflects the composition or returns of our Magic Pants Wealth-Builder (CDN) Portfolios. It is only a starting point for our analysis and discussion of dividend growth investing concepts.


The List (2023)
Last updated by BM on January 20, 2023

*Note: The following graph is wide, you can scroll to the right on your device to see more of the data.

<
SYMBOL COMPANY YLD PRICE YTD % DIV YTD % STREAK
AQN-N Algonquin Power & Utilities 7.1% $7.18 6.7% $0.51 -29.0% 12
ATD-T Alimentation Couche-Tard Inc. 0.9% $62.17 3.4% $0.56 19.1% 13
BCE-T Bell Canada 5.9% $62.46 3.7% $3.68 1.1% 14
BIP-N Brookfield Infrastructure Partners 4.4% $32.95 5.2% $1.44 0.0% 15
CCL-B-T CCL Industries 1.6% $61.06 5.2% $0.96 0.0% 21
CNR-T Canadian National Railway 1.8% $165.02 1.3% $2.93 0.0% 27
CTC-A-T Canadian Tire 4.4% $155.64 6.2% $6.90 17.9% 12
CU-T Canadian Utilities Limited 4.7% $37.96 2.8% $1.78 0.0% 51
DOL-T Dollarama Inc. 0.3% $82.63 3.5% $0.22 2.3% 12
EMA-T Emera 5.1% $54.22 3.0% $2.76 3.0% 16
ENB-T Enbridge Inc. 6.3% $56.02 5.0% $3.55 3.2% 27
ENGH-T Enghouse Systems Limited 1.9% $39.75 11.3% $0.74 3.5% 16
FNV-N Franco Nevada 0.9% $147.13 6.5% $1.36 6.3% 15
FTS-T Fortis 4.0% $55.87 1.0% $2.26 4.1% 49
IFC-T Intact Financial 2.0% $197.82 1.0% $4.00 0.0% 18
L-T Loblaws 1.4% $118.16 -1.8% $1.62 5.2% 11
MGA-N Magna 2.8% $63.88 11.1% $1.80 0.0% 13
MRU-T Metro 1.5% $74.46 -1.4% $1.10 0.0% 28
RY-T Royal Bank of Canada 3.9% $134.71 5.2% $5.28 6.5% 12
SJ-T Stella-Jones Inc. 1.7% $48.14 -2.9% $0.80 0.0% 18
STN-T Stantec Inc. 1.0% $68.77 5.3% $0.72 2.1% 11
TD-T TD Bank 4.3% $89.18 1.7% $3.84 7.9% 12
TFII-N TFI International 1.3% $107.89 7.7% $1.40 29.6% 12
TIH-T Toromont Industries 1.5% $103.08 5.5% $1.56 2.6% 33
TRP-T TC Energy Corp. 6.2% $58.02 8.9% $3.60 0.8% 22
T-T Telus 4.9% $28.47 8.2% $1.40 5.4% 19
WCN-N Waste Connections 0.8% $128.62 -2.3% $1.02 7.9% 13
Averages 3.1% 4.1% 3.7% 19

MP Market Review – January 13, 2023

Last updated by BM on January 16, 2023

Summary

  • This article is part of our weekly series (MP Market Review) highlighting the performance and activity from the previous week related to the financial markets and Canadian dividend growth companies we follow on ‘The List’.
  • Last week, ‘The List’ was up sharply with a positive +3.8% YTD price return (capital). Dividend growth took a step back with the dividend cut announced by (AQN-N). ‘The List’ is at +3.5% YTD, demonstrating the rise in income over the last year.
  • Last week, there were no dividend increases from companies on ‘The List’, but there was a dividend cut.
  • Last week, there were no earnings reports from companies on ‘The List’.
  • No companies on ‘The List’ are due to report earnings this week.
  • Are you looking to build an income portfolio of your own? When you become a premium subscriber, you get exclusive access to the MP Wealth-Builder Model Portfolio (CDN) and subscriber-only content. Start building real wealth today!  Learn More

“Having a framework that objectively improves the probability of being directionally accurate is more important than having the most intellectually compelling narrative. Some of the smartest people out there are just as likely to be dead wrong, no matter how compelling their narratives sound. Investing success is a game of having a probabilistic advantage that enables returns to compound over time.”

– Josh Steiner, Hedgeye

One of the reasons we publish ‘The List’ is so that we can ‘coach’ others on how to select and monitor dividend growth stocks for their portfolios. Its purpose is to provide investment ideas and a real-time illustration of dividend growth investing in action. It is not a ‘Buy List,’ nor a portfolio that reflects the composition or returns of our Magic Pants Wealth-Builder (CDN) Portfolios. It is only a starting point for our analysis and discussion of dividend growth investing concepts.

Last week one of the companies on ‘The List’, Algonquin Power & Utilities (AQN-N) announced a 40% dividend cut. Although dividend cuts are rare for dividend growth companies, they do happen.

As part of our process audit, we will take a few paragraphs to review the signs leading up to the dividend cut by (AQN) to see if we need to change anything or if an investor following our process could have seen this one coming. A good process means you review your decisions when they fall outside your expectations.

Here is an excerpt from the article we published on our blog titled ‘Our Dividend Growth Investing Process’.

“By standing on the shoulders of giants, those great investors who came before us, we have come up with a process that is simple to understand with only three basic rules:

  1. Quality; only buy large-cap companies that have a long dividend growth streak and good financial safety metrics in an industry that is stable and growing.
  2. Valuation; look to buy a company that is sensibly priced or undervalued by looking at a company’s track record. Undervaluation introduces a margin of safety. You are in essence tilting the odds in your favor that future price movements will be upwards.
  3. Monitor; keep an eye on your dividend growers; especially the current yield; fluctuations in yields send signals. The consistency of a firm’s dividend growth is the best measure of management’s confidence in the long-term growth outlook for a company.”

“We will also review our outcomes regardless of if they were good or bad. Having a good process means you go back and review your decisions when they fall outside your expectations. We can then make tweaks based on our findings and enhance our process. Only then will we know if we were good or just lucky.”

This week we see the importance of Rule # 3. By monitoring our quality dividend growers, we can see signs of possible dividend cuts and mitigate the damage they can do to our portfolios.

In the case of Algonquin Power & Utilities (AQN-N), the fluctuation in yield and slowing dividend growth in 2022 were definitely ‘red flags’. While many investors would have been attracted to a higher yield, we see yield fluctuations as a warning sign. This, combined with a lower dividend growth rate announcement in July 2022, should have alerted the dividend growth investor to do a deeper dive into company fundamentals. In doing so, the dividend growth investor would have seen that the company had issues servicing its debt due to higher interest rates. This was noticeable when looking at the dividend payout ratio, which climbed to over 100%. Paying out more than you take in eventually leads to financial trouble. A high payout ratio often precedes a dividend cut.

Fortunately, we have never owned a position in (AQN-N) in any of our Wealth-Builder Portfolios, but if we did, it is reassuring to know that our process would have signalled us to do more research and then it would have been up to us to take action and decide what to do next.

Here is an excerpt from an article on the blog dated March 2021 that may help when you have this type of decision to make. Selling Dividend Growth Stocks

“When we make an investment, we take a patient, long-term investment horizon and expect to hold the stock for decades, keeping portfolio turnover low. Generally speaking, we will only sell a stock if the safety of the dividend payment has come into question, the company’s long-term earnings power appears to have become impaired, the stock’s valuation reaches seemingly excessive levels, or we find a more attractive idea.”

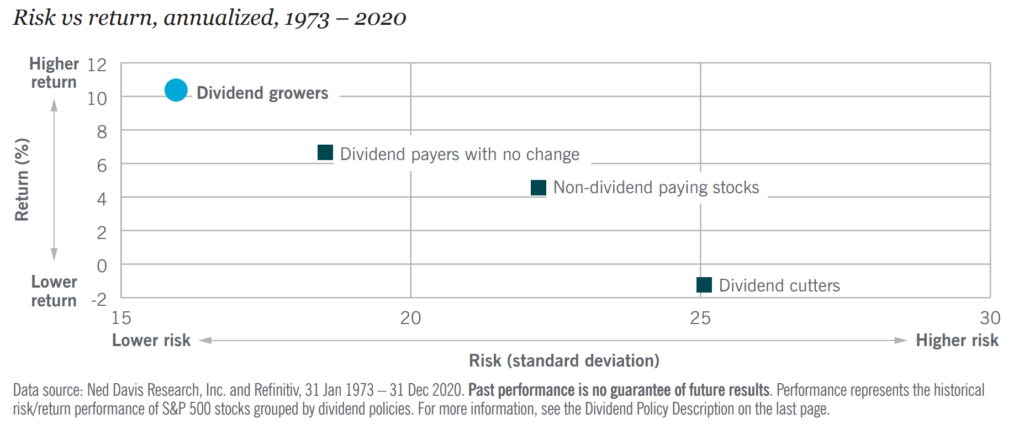
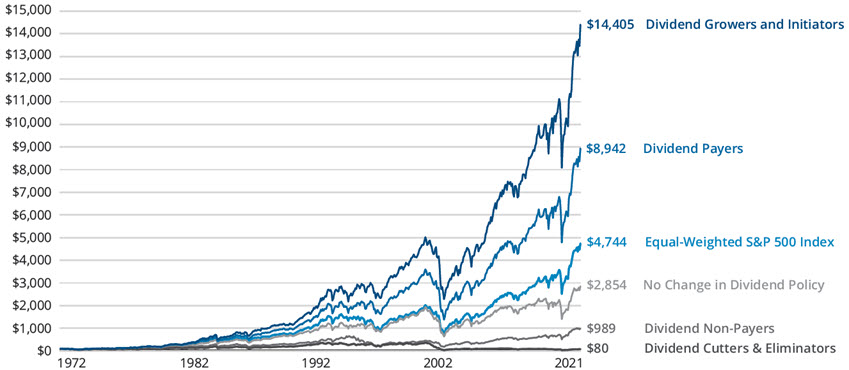
As dividend growth investors, a dividend cut means the wealth-building stops, so, we know what to do. Deep-value investors may need more of a push. Research shows us that the probability of a successful outcome is greatly reduced after the dividend is cut or eliminated.

As you can see from the chart above, the probability of a ‘dividend cutter’ generating the type of future return we look for, at an acceptable risk, does not fit into our ‘probabilistic’ framework.

For those deep-value investors, we are not saying that Algonquin Power & Utilities will not go up in price from here. It simply does not meet our criteria as an investable dividend growth stock within our framework. We will keep an eye on (AQN-N) for the rest of the year to see how this ‘dividend cutter’ works out, but for now, we have plenty of higher probability ideas to invest our hard-earned capital in.

Performance of ‘The List’

At the end of the post is a snapshot of ‘The List’ from last Friday’s close. Feel free to click on the ‘The List’ menu item above for a sortable version.

Last week, ‘The List’ was up sharply with a positive +3.8% YTD price return (capital). Dividend growth took a step back with the dividend cut announced by (AQN-N). ‘The List’ is at +3.5% YTD, demonstrating the rise in income over the last year.

The best performers last week on ‘The List’ were Enghouse Systems Limited (ENGH-T), up +6.43%; TC Energy Corp. (TRP-T), up +5.66%; and Franco Nevada FNV-N), up +4.93%.

Algonquin Power & Utilities (AQN-N) was the worst performer last week, down -7.37%.

Recent News

Algonquin Power cuts dividend by 40 percent, shares slump (Globe & Mail)

https://www.theglobeandmail.com/investing/markets/inside-the-market/article-algonquin-power-cuts-dividend-by-40-per-cent-shares-slump/

“We have reached an inflection point, and as the market continues to evolve we are facing various challenges that are putting pressure on our growth rates and making our dividend payout unsustainable,” Mr. Banskota (CEO) said during a call with analysts.”

It finally happened. After months of speculation, management announced this week that the dividend will need to be cut.

Be wary of dividend-paying stocks with extremely high yields (Globe & Mail)

https://www.theglobeandmail.com/investing/markets/inside-the-market/article-be-wary-of-dividend-paying-stocks-with-extremely-high-yields/

“It’s fairly easy to explain why stocks with giant yields might perform poorly. Just think about how a stock gets a high yield. In happy cases, yields are boosted by dividend growth. But extremely high yields often occur when a business falters and its share price falls dramatically. In such cases, the low price and high yield reflect the risk of an impending dividend cut – or worse.”

The author demonstrates how a portfolio of dividend-paying stocks with moderate yields has outperformed the TSX index over the last twenty-one years.

No charts for dividend growth as a strategy, though. That’s OK; we have done our own research.

Dividend Increases

Last week, there were no dividend increases from companies on ‘The List’.

Earnings Releases

No companies on ‘The List’ are due to report earnings this week.

Last week, there were no earnings reports from companies on ‘The List’.


Below is a snapshot of ‘The List’ from last Friday’s close. For a sortable version of ‘The List’, please click on The List menu item.

‘The List’ is not intended to be a portfolio others replicate. Rather, its purpose is to provide investment ideas and a real-time illustration of dividend growth investing in action. It is not a ‘Buy List’ nor reflects the composition or returns of our Magic Pants Wealth-Builder (CDN) Portfolios. It is only a starting point for our analysis and discussion of dividend growth investing concepts.


The List (2023)
Last updated by BM on January 13, 2023

*Note: The following graph is wide, you can scroll to the right on your device to see more of the data.

SYMBOL COMPANY YLD PRICE YTD % DIV YTD % STREAK
AQN-N Algonquin Power & Utilities 7.6% $6.66 -1.0% $0.51 -29.0% 12
ATD-T Alimentation Couche-Tard Inc. 0.9% $62.98 4.7% $0.56 19.1% 13
BCE-T Bell Canada 5.9% $62.48 3.7% $3.68 1.1% 14
BIP-N Brookfield Infrastructure Partners 4.4% $32.95 5.2% $1.44 0.0% 15
CCL-B-T CCL Industries 1.6% $60.29 3.9% $0.96 0.0% 21
CNR-T Canadian National Railway 1.8% $165.64 1.7% $2.93 0.0% 27
CTC-A-T Canadian Tire 4.4% $156.43 6.7% $6.90 17.9% 12
CU-T Canadian Utilities Limited 4.7% $37.84 2.4% $1.78 0.0% 51
DOL-T Dollarama Inc. 0.3% $81.79 2.4% $0.22 2.3% 12
EMA-T Emera 5.1% $53.94 2.5% $2.76 3.0% 16
ENB-T Enbridge Inc. 6.3% $55.92 4.9% $3.55 3.2% 27
ENGH-T Enghouse Systems Limited 1.9% $39.39 10.3% $0.74 3.5% 16
FNV-N Franco Nevada 0.9% $146.69 6.2% $1.28 0.0% 15
FTS-T Fortis 4.0% $56.00 1.2% $2.26 4.1% 49
IFC-T Intact Financial 2.0% $199.38 1.8% $4.00 0.0% 18
L-T Loblaws 1.4% $115.82 -3.7% $1.62 5.2% 11
MGA-N Magna 2.8% $64.07 11.4% $1.80 0.0% 13
MRU-T Metro 1.5% $74.06 -1.9% $1.10 0.0% 28
RY-T Royal Bank of Canada 3.9% $134.28 4.9% $5.28 6.5% 12
SJ-T Stella-Jones Inc. 1.7% $47.85 -3.5% $0.80 0.0% 18
STN-T Stantec Inc. 1.0% $69.22 6.0% $0.72 2.1% 11
TD-T TD Bank 4.3% $88.84 1.3% $3.84 7.9% 12
TFII-N TFI International 1.3% $107.47 7.3% $1.40 29.6% 12
TIH-T Toromont Industries 1.5% $106.88 9.4% $1.56 2.6% 33
TRP-T TC Energy Corp. 6.3% $57.31 7.5% $3.60 0.8% 22
T-T Telus 5.0% $28.15 7.0% $1.40 5.4% 19
WCN-N Waste Connections 0.8% $130.59 -0.9% $1.02 7.9% 13
Averages 3.1% 3.8% 3.5% 19

MP Market Review – January 06, 2023

Last updated by BM on January 09, 2023

Summary

  • This article is part of our weekly series (MP Market Review) highlighting the performance and activity from the previous week related to the financial markets and Canadian dividend growth companies we follow on ‘The List’.
  • ‘The List’ ends 2022 with a negative -6.0% price return (capital) and positive +10.6% dividend growth (income). See summary below. We started a new list last week for 2023. We decided to keep ‘The List’ the same for 2023 as all companies increased their dividend again last year.
  • Last week, ‘The List’ began the year with a positive +2.1% YTD price return (capital). The dividend growth of ‘The List’ is off to a fast start at +4.6% YTD, demonstrating the rise in income over the last year.   
  • Last week, there were no dividend increases from companies on ‘The List’.
  • Last week, there were no earnings reports from companies on ‘The List’.
  • No companies on ‘The List’ are due to report earnings this week.
  • Are you looking to build an income portfolio of your own? When you become a premium subscriber, you get exclusive access to the MP Wealth-Builder Model Portfolio (CDN) and subscriber-only content. Start building real wealth today!  Learn More

“Learn to eventually and mentally manage price declines as your dividend grows.”

Happy New Year!  It is that time of year when we reflect on our dividend growth strategy and how it fared in the worst stock market decline since 2008.

We can only imagine the amount of wealth destruction that took place for a lot of people last year. Fortunately, we discovered dividend growth investing after the last major market decline in 2008 and vowed we would not let that happen again. This 2022 summary of ‘The List’ will help demonstrate that even the most passive dividend growth investing strategy can safeguard your capital and provide you with a growing income stream.

At market close on the first trading day of the new year, we publish ‘The List’ of Canadian dividend growth stocks we will follow that year. The companies selected are from various industries, usually no more than four from one industry. We stay away from REITs and pure-play energy companies due to their cyclical nature. Next, we look for ten years of consecutive dividend growth and over one billion market cap. We hold the stocks for the entire year with weekly updates on their performance and insights throughout the year into how the company aligns, or not, as a candidate for your dividend growth portfolio.

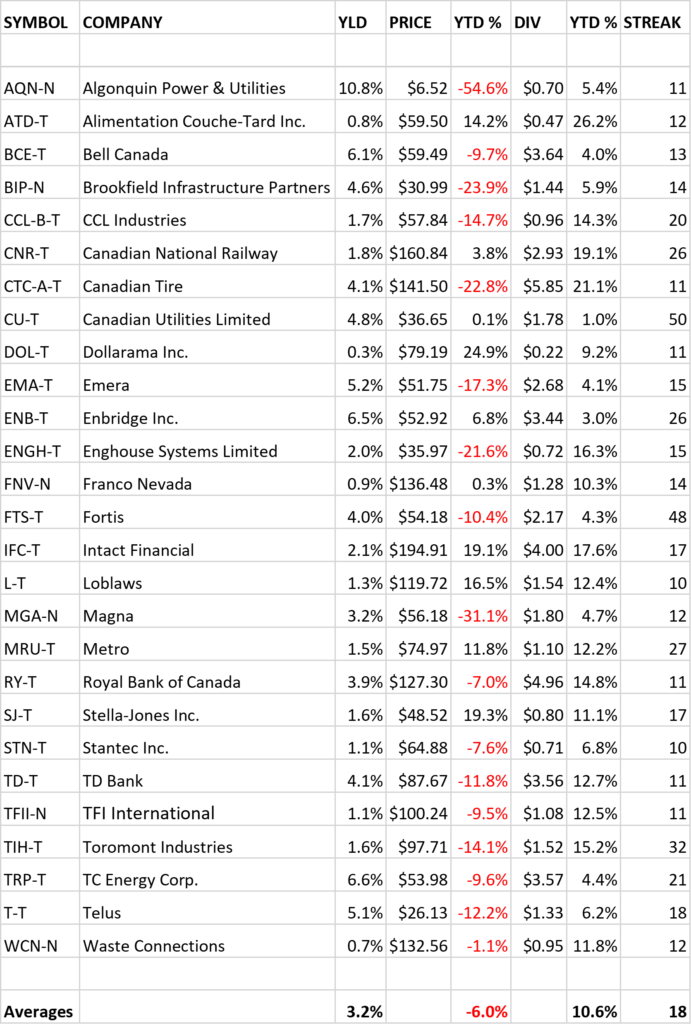
Here is a copy of ‘The List’ and its year-to-date (YTD) performance on the last trading day of December 2022.

In 2022, ‘The List’ had an average price return of -6.0% and an average dividend growth rate of +10.6%. These metrics assume investment in an equal amount of shares in all the companies on ‘The List’ at the close of the first trading day of 2022.

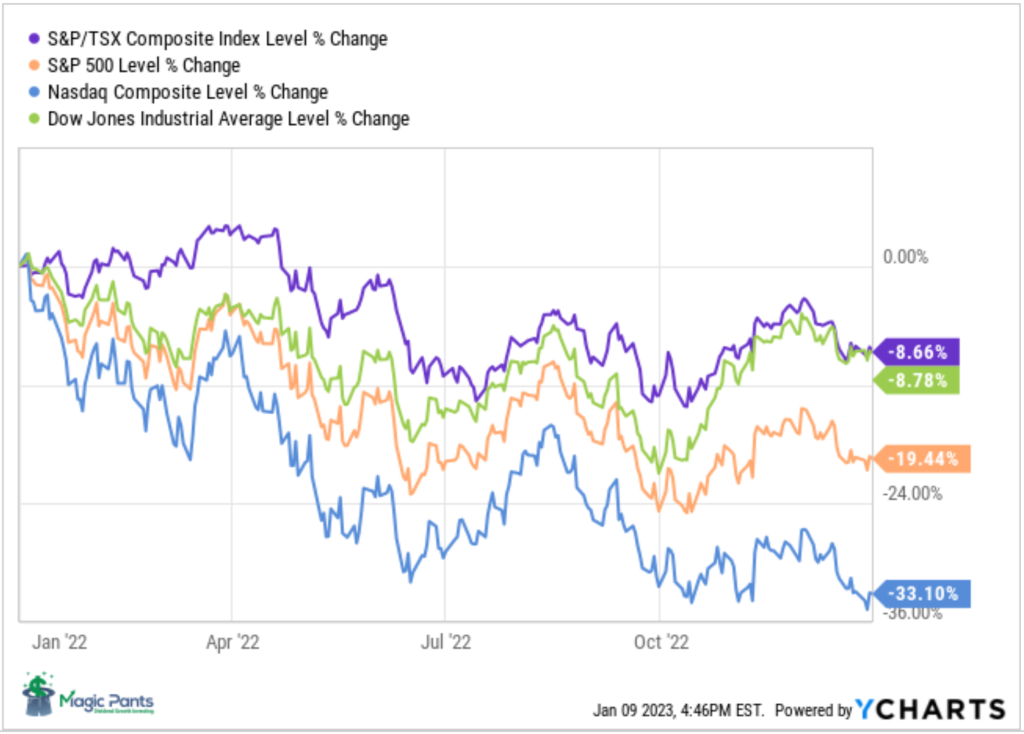
To put these metrics in perspective, let’s look at how a few of the most popular market indexes did last year.

As you can see, there were negative price returns across the board from all the major North American indexes. ‘The List’ of Canadian dividend growth stocks we follow did a better job protecting our capital than all four main indexes. Not all indexes contain dividend growth stocks, so we could not compare the income generated. We can, however, safely assume that ‘The List,’ with its generous starting yield last year of 2.7% and dividend growth of +10.6%, was a clear winner on income production as well.

So how did a pseudo dividend growth portfolio like the ‘The List’ protect you from a year like 2022?  By its nature, dividend growth investing forces investors into higher-quality names. After all, for a company’s management to commit to a dividend payout policy, the company needs to generate cash to pay the dividends. As it turns out, high-quality companies are more likely to be profitable and generate cash to pay dividends consistently.

Although it is early, our Magic Pants Wealth-Builder Model Portfolio (CDN) did even better, ending 2022 in positive territory for both price and income returns after its inception in May 2022. This portfolio lets paid subscribers ‘look over our shoulder’ as we build a powerful dividend growth portfolio from scratch. Learn More

As dividend growth investors, we have come to realize that we can’t control economic cycles (markets), but we can control our income. Knowing that, we don’t focus as much on the value of our portfolios in the short-term, only on how much our income is growing. In time, a rising dividend income stream will eventually lead to rising stock prices.

Is 2023 the year you finally learn to mentally manage price declines as your dividend grows?

Note: The companies on ‘The List’ are only a starting point when you decide to build your portfolio. Buying all your stocks in one day, regardless of valuation, is not the approach we discuss in the blog. To learn more about our process and how we build powerful dividend growth portfolios that have easily outperformed all Canadian Dividend ETFs and Mutual Funds for over a decade, click here.

Performance of ‘The List’

At the end of the post is a snapshot of ‘The List’ from last Friday’s close. Feel free to click on the ‘The List’ menu item above for a sortable version.

Last week, ‘The List’ began the year with a positive +2.1% YTD price return (capital). The dividend growth of ‘The List’ is off to a fast start at +4.6% YTD, demonstrating the rise in income over the last year.

The best performers last week on ‘The List’ were Algonquin Power & Utilities (AQN-N), up +10.28%; Magna (MGA-N), up +9.65%; and Canadian Tire (CTC-A-T), up +6.84%.

TD Bank (TD-T) was the worst performer last week, down -1.48%.

Recent News

Why is Algonquin Power rallying? Any news on the dividend is good news (Globe & Mail)

https://www.theglobeandmail.com/investing/markets/inside-the-market/article-why-is-algonquin-power-rallying-any-news-on-the-dividend-is-good-news/

Hands down the worst performer on ‘The List’ last year, Algonquin Power (AQN-N) now yields close to 10%. Investors will know more next week about how the company plans to deal with its dividend. Pay close attention to this one as dividend reductions or cuts are normally not met with enthusiasm by investors.

(AQN-N) got itself in trouble last year when rising rates affected its borrowing costs.

Dividend Increases

Last week, there were no dividend increases from companies on ‘The List’.

Earnings Releases

No companies on ‘The List’ are due to report earnings this week.

Last week, there were no earnings reports from companies on ‘The List’.


Below is a snapshot of ‘The List’ from last Friday’s close. For a sortable version of ‘The List’, please click on The List menu item.

‘The List’ is not intended to be a portfolio others replicate. Rather, its purpose is to provide investment ideas and a real-time illustration of dividend growth investing in action. It is not a ‘Buy List’ nor reflects the composition or returns of our Magic Pants Wealth-Builder (CDN) Portfolios. It is only a starting point for our analysis and discussion of dividend growth investing concepts.


The List (2023)
Last updated by BM on January 06, 2023

*Note: The following graph is wide, you can scroll to the right on your device to see more of the data.

SYMBOL COMPANY YLD PRICE YTD % DIV YTD % STREAK
AQN-N Algonquin Power & Utilities 10.1% $7.19 6.8% $0.72 2.9% 12
ATD-T Alimentation Couche-Tard Inc. 0.9% $61.87 2.9% $0.56 19.1% 13
BCE-T Bell Canada 6.0% $61.62 2.3% $3.68 1.1% 14
BIP-N Brookfield Infrastructure Partners 4.4% $32.95 5.2% $1.44 0.0% 15
CCL-B-T CCL Industries 1.6% $59.22 2.0% $0.96 0.0% 21
CNR-T Canadian National Railway 1.8% $164.44 1.0% $2.93 0.0% 27
CTC-A-T Canadian Tire 4.6% $151.18 3.1% $6.90 17.9% 12
CU-T Canadian Utilities Limited 4.8% $36.98 0.1% $1.78 0.0% 51
DOL-T Dollarama Inc. 0.3% $82.92 3.8% $0.22 2.3% 12
EMA-T Emera 5.3% $52.32 -0.6% $2.76 3.0% 16
ENB-T Enbridge Inc. 6.5% $54.46 2.1% $3.55 3.2% 27
ENGH-T Enghouse Systems Limited 2.0% $37.01 3.6% $0.74 3.5% 16
FNV-N Franco Nevada 0.9% $139.80 1.2% $1.28 0.0% 15
FTS-T Fortis 4.1% $55.16 -0.3% $2.26 4.1% 49
IFC-T Intact Financial 2.0% $199.81 2.1% $4.00 0.0% 18
L-T Loblaws 1.3% $120.21 -0.1% $1.62 5.2% 11
MGA-N Magna 2.9% $61.60 7.1% $1.80 0.0% 13
MRU-T Metro 1.5% $74.81 -0.9% $1.10 0.0% 28
RY-T Royal Bank of Canada 4.0% $130.43 1.9% $5.28 6.5% 12
SJ-T Stella-Jones Inc. 1.6% $50.17 1.2% $0.80 0.0% 18
STN-T Stantec Inc. 1.1% $66.36 1.6% $0.72 2.1% 11
TD-T TD Bank 4.4% $86.37 -1.5% $3.84 7.9% 12
TFII-N TFI International 1.3% $103.73 3.6% $1.40 29.6% 12
TIH-T Toromont Industries 1.5% $102.14 4.5% $1.56 2.6% 33
TRP-T TC Energy Corp. 6.6% $54.24 1.8% $3.60 0.8% 22
T-T Telus 5.2% $27.02 2.7% $1.40 5.4% 19
WCN-N Waste Connections 0.8% $132.81 0.8% $1.02 7.9% 13
Averages 3.2% 2.1% 4.6% 19

MP Market Review – December 30, 2022

Last updated by BM on January 03, 2022

Summary

  • This article is part of our weekly series (MP Market Review) highlighting the performance and activity from the previous week related to the financial markets and Canadian dividend growth companies we follow on ‘The List’.
  • Last week, ‘The List’ was down slightly with a minus -6.0% YTD price return (capital). The dividend growth of ‘The List’ remains at +10.6% YTD, demonstrating the rise in income over the last year.   
  • Last week, there were no dividend increases from companies on ‘The List’.
  • Last week, there were no earnings reports from a company on ‘The List’.
  • No companies on ‘The List’ are due to report earnings this week.
  • Are you looking to build an income portfolio of your own? When you become a premium subscriber, you get exclusive access to the MP Wealth-Builder Model Portfolio (CDN) and subscriber-only content. Start building real wealth today!  Learn More

 “…for a lot of people, generating a portion of their income from lightly taxed – or even negatively taxed – dividends makes a lot of sense.”

– John Heinzl, (Negative tax on dividends? Yup, really), Globe & Mail

DGI Truth #5: Dividend growth investing is a tax-efficient strategy

One of the first things you discover when you begin working is how much money is taken off your pay cheque each week for income tax purposes. Eventually, you discover that the more you make, the higher tax rate applies (increasing marginal tax rate). It is then that you start to ask questions; “How do I hold onto a larger share of my income?”

For those looking to hold onto a larger share, generating dividend income may be part of the answer. Dividend income is taxed at a lower rate than many other forms of income due to the dividend tax credit (DTC). To avoid ‘double-dipping’ by the CRA and account for the tax the corporation issuing the dividend has already paid, the individual receiving the dividend is then entitled to a federal and provincial dividend tax credit.

Let’s look at an excerpt from the 2019 example published in the Globe & Mail by John Heinzl:

How to earn $52,000 tax free – no offshore account required

You are a resident of Ontario and have saved $1.3 million. You decide to retire and invest the money in a portfolio of dividend-growth stocks yielding an average of 4%. Your portfolio would generate an annual dividend income of $52,000, which we’re assuming is all received in a non-registered account.

When it’s time to file your tax return, the $52,000 would be listed on your tax slip as the ‘actual amount of eligible dividends’. To understand how dividend taxation works, however, we need to look at two other important numbers on your tax slip: the ‘taxable amount of eligible dividends’ and the federal ‘dividend tax credit for eligible dividends’.

The taxable amount of dividends is calculated by multiplying the actual amount by a ‘gross-up’ factor of 1.38 (38% is the basic federal corporate tax rate for Canadian-controlled corporations). This produces taxable dividends of $71,760. The purpose of the ‘gross up’ is to roughly estimate the pre-tax income the company (or, in this case, companies) would have to earn to pay you the dividend.

In our example, applying these DTC rates to the grossed-up dividend of $71,760 produces a federal DTC of $10,778 and a provincial DTC of $7,176. These amounts, combined with a federal tax credit of $1,810 (15% of the basic personal amount of $12,069), reduce your taxes to zero.

The reason is that before any credits, $71,760 of income would attract a tax of $16,858 but because you receive more than that in tax credits, you pay no tax on the dividend income.

Due to how the dividend tax credit functions, individuals with lower marginal tax rates receive a comparatively bigger benefit from earning income through dividends than individuals with higher marginal tax rates, but both will benefit from the dividend tax credit.

Will 2023 be the year you consider adding tax-efficient dividend income to your income mix?

Note: It is always a good idea to consult a tax professional to determine the most tax-efficient strategies for your specific situation.

Performance of ‘The List’

At the end of the post is a snapshot of ‘The List’ from last Friday’s close. Feel free to click on the ‘The List’ menu item above for a sortable version.

Last week, ‘The List’ was down slightly with a minus -6.0% YTD price return (capital). The dividend growth of ‘The List’ remains at +10.6% YTD, demonstrating the rise in income over the last year.

The best performers last week on ‘The List’ were Enghouse Systems Limited (ENGH-T), up +3.18%; Stella-Jones Inc. (SJ-T), up +1.36%; and Magna (MGA-N), up +1.32%.

Algonquin Power & Utilities (AQN-N) was the worst performer last week, down -3.55%.

Recent News

First Quantum receives final contract for disputed mine, Panama says (Globe & Mail)

https://www.theglobeandmail.com/business/article-panama-first-quantum-final-contract-mine/

What is going on in Panama has caught our attention on several fronts. First, there is the fact that there are geopolitical risks sometimes when you invest in companies. Always pay attention to where companies do business, as this can affect the safety of their earnings and, ultimately, their ability to pay growing dividends.

Secondly, one of the companies on ‘The List’, Franco Nevada (FNV-N), has a large royalty stream with the mine in question owned by First Quantum; Cobre Panama.

The dispute centres around the government of Panama asking for increased payments from First Quantum to continue mining.

If First Quantum agrees to the payment with the Panama government, its stock and earnings will take a hit, but the royalty stream to Franco Nevada will remain unchanged. This is why we prefer royalty companies over miners.

Dividend Increases

Last week, there were no dividend increases from companies on ‘The List’.

Earnings Releases

No companies on ‘The List’ are due to report earnings this week.

Last week, there were no earnings reports from companies on ‘The List’.


Below is a snapshot of ‘The List’ from last Friday’s close. For a sortable version of ‘The List’, please click on The List menu item.

‘The List’ is not intended to be a portfolio others replicate. Rather, its purpose is to provide investment ideas and a real-time illustration of dividend growth investing in action. It is not a ‘Buy List’ nor reflects the composition or returns of our Magic Pants Wealth-Builder (CDN) Portfolios. It is only a starting point for our analysis and discussion of dividend growth investing concepts.

The List (2022)
Last updated by BM on December 30, 2022

*Note: The following graph is wide, you can scroll to the right on your device to see more of the data.

SYMBOL COMPANY YLD PRICE YTD % DIV YTD % STREAK
AQN-N Algonquin Power & Utilities 10.8% $6.52 -54.6% $0.70 5.4% 11
ATD-T Alimentation Couche-Tard Inc. 0.8% $59.50 14.2% $0.47 26.2% 12
BCE-T Bell Canada 6.1% $59.49 -9.7% $3.64 4.0% 13
BIP-N Brookfield Infrastructure Partners 4.6% $30.99 -23.9% $1.44 5.9% 14
CCL-B-T CCL Industries 1.7% $57.84 -14.7% $0.96 14.3% 20
CNR-T Canadian National Railway 1.8% $160.84 3.8% $2.93 19.1% 26
CTC-A-T Canadian Tire 4.1% $141.50 -22.8% $5.85 21.1% 11
CU-T Canadian Utilities Limited 4.8% $36.65 0.1% $1.78 1.0% 50
DOL-T Dollarama Inc. 0.3% $79.19 24.9% $0.22 9.2% 11
EMA-T Emera 5.2% $51.75 -17.3% $2.68 4.1% 15
ENB-T Enbridge Inc. 6.5% $52.92 6.8% $3.44 3.0% 26
ENGH-T Enghouse Systems Limited 2.0% $35.97 -21.6% $0.72 16.3% 15
FNV-N Franco Nevada 0.9% $136.48 0.3% $1.28 10.3% 14
FTS-T Fortis 4.0% $54.18 -10.4% $2.17 4.3% 48
IFC-T Intact Financial 2.1% $194.91 19.1% $4.00 17.6% 17
L-T Loblaws 1.3% $119.72 16.5% $1.54 12.4% 10
MGA-N Magna 3.2% $56.18 -31.1% $1.80 4.7% 12
MRU-T Metro 1.5% $74.97 11.8% $1.10 12.2% 27
RY-T Royal Bank of Canada 3.9% $127.30 -7.0% $4.96 14.8% 11
SJ-T Stella-Jones Inc. 1.6% $48.52 19.3% $0.80 11.1% 17
STN-T Stantec Inc. 1.1% $64.88 -7.6% $0.71 6.8% 10
TD-T TD Bank 4.1% $87.67 -11.8% $3.56 12.7% 11
TFII-N TFI International 1.1% $100.24 -9.5% $1.08 12.5% 11
TIH-T Toromont Industries 1.6% $97.71 -14.1% $1.52 15.2% 32
TRP-T TC Energy Corp. 6.6% $53.98 -9.6% $3.57 4.4% 21
T-T Telus 5.1% $26.13 -12.2% $1.33 6.2% 18
WCN-N Waste Connections 0.7% $132.56 -1.1% $0.95 11.8% 12
Averages 3.2% -6.0% 10.6% 18

We buy quality individual dividend growth stocks when they are sensibly priced and hold for the growing income.