We Just Bought Telus (T-T) for our MP Wealth-Builder Model Portfolio (CDN)
MP Market Review – December 23, 2022
Last updated by BM on December 26, 2022
Summary
- This article is part of our weekly series (MP Market Review) highlighting the performance and activity from the previous week related to the financial markets and Canadian dividend growth companies we follow on ‘The List’.
- Last week, ‘The List’ was down slightly with a minus -5.2% YTD price return (capital). Dividend growth of ‘The List’ remains at +10.6% YTD, demonstrating the rise in income over the last year.
- Last week, there were no dividend increases from companies on ‘The List’.
- Last week, there were no earnings reports from a company on ‘The List’.
- No companies on ‘The List’ are due to report earnings this week.
- Are you looking to build an income portfolio of your own? When you become a premium subscriber, you get exclusive access to the MP Wealth-Builder Model Portfolio (CDN) and subscriber-only content. Start building real wealth today! Learn More
“Compounding is mankind’s greatest invention because it allows the reliable, systematic accumulation of wealth.”
– Albert Einstein
DGI Truth #4: The power of compounding with dividend re-investment
Most people are aware of the ‘magic’ (there is that word again) of compound interest; returns balloon over time under the effects of compound interest accumulation. The same effects happen by re-investing your dividends in shares of your quality dividend growers. You not only add to your growing income, but you also add to your capital returns when the stock price goes up because you have more shares than you would have otherwise had.
For those who do not need dividend income to pay the bills or have fun with, dividend re-investment is important. Many of the companies we follow on ‘The List’ offer ‘Dividend Re-Investment Plans’ (DRIPs) that sell you additional shares in amounts equivalent to your dividend distribution at a discount to the current market price. You can automate this in your brokerage account, so there are no fees or trading required.
In the graphics below, let’s look at the same input values (starting principal, dividend yield, dividend/share growth rates, years invested, etc. ) and see the difference that dividend re-investment can mean to your income and portfolio values.
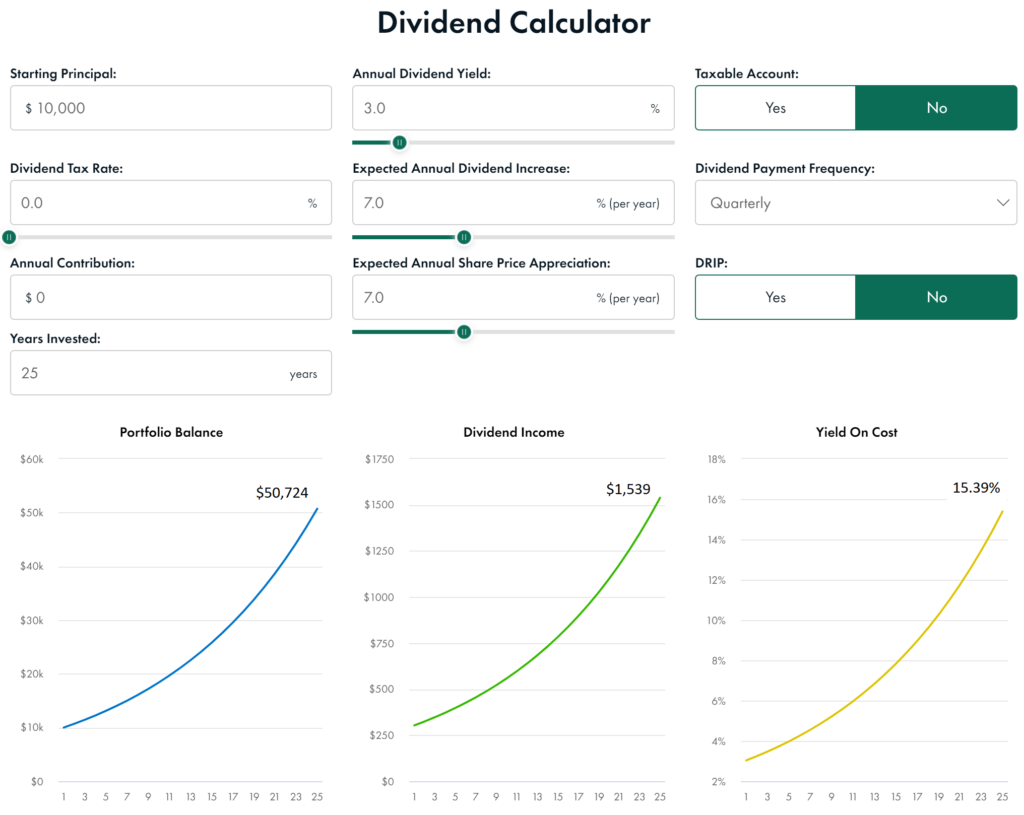
Now let’s change the last variable. Dividend reinvestment (DRIP) is now set to Yes.

By simply reinvesting dividends our portfolio balance, dividend income and yield on cost (growth yield) have all doubled over a twenty-five-year period and are accelerating. We have not made any new contributions except by re-investing the quarterly dividends.
In our Magic Pants portfolios, we believe in dividend re-investment, but we do it a bit differently. We never get caught automatically investing in our quality companies when they are overvalued. We accumulate dividends and re-invest in our quality dividend growers when they are sensibly priced. This approach allows us to supercharge the compounding effect of income and capital returns even more.
Adding dividend re-investment to your dividend growth strategy lets compounding do its magic, and the investor accumulates wealth at a much faster pace.
Performance of ‘The List’
At the end of the post is a snapshot of ‘The List’ from last Friday’s close. Feel free to click on the ‘The List’ menu item above for a sortable version.
Last week, ‘The List’ was down slightly with a minus -5.2% YTD price return (capital). Dividend growth of ‘The List’ remains at +10.6% YTD, demonstrating the rise in income over the last year.
The best performers last week on ‘The List’ were Franco Nevada (FNV-N), up +2.53%; Enbridge Inc. (ENB-T), up +2.19%; and TD Bank (TD-T), up +1.96%.
TFI International (TFII-N) was the worst performer last week, down -3.88%.
Recent News
There are many ways to pick a bank stock. Here’s what worked (and what didn’t) (Globe & Mail)
https://www.theglobeandmail.com/investing/markets/inside-the-market/article-pick-bank-stocks/
Discussed in the article are four strategies.
- Ignore the stock, buy the dividend: the highest yielders are the best
- The worst stock is the best stock: buy the stock that had the worst record last year
- The lowest valuation shines brightest: cheap is good
- Just buy them all: invest in an ETF of all the bank stocks
Notice that most of the advice is about the short term and how to maximize returns next year. This is typical of the advice you find in the investment news today.
Having a longer-term investment horizon, investing in only the highest quality companies in a given sector/industry and then only purchasing them when they are sensibly priced continues to outperform any strategy we have found.
Dividend Increases
Last week, there were no dividend increases from companies on ‘The List’.
Earnings Releases
No companies on ‘The List’ are due to report earnings this week.
Last week, there were no earnings reports from companies on ‘The List’.
Below is a snapshot of ‘The List’ from last Friday’s close. For a sortable version of ‘The List’, please click on The List menu item.
‘The List’ is not intended to be a portfolio others replicate. Rather, its purpose is to provide investment ideas and a real-time illustration of dividend growth investing in action. It is not a ‘Buy List’ nor reflects the composition or returns of our Magic Pants Wealth-Builder (CDN) Portfolios. It is only a starting point for our analysis and discussion of dividend growth investing concepts.
The List (2022)
Last updated by BM on December 23, 2022
*Note: The following graph is wide, you can scroll to the right on your device to see more of the data.
| SYMBOL | COMPANY | YLD | PRICE | YTD % | DIV | YTD % | STREAK |
|---|---|---|---|---|---|---|---|
| AQN-N | Algonquin Power & Utilities | 10.4% | $6.76 | -52.9% | $0.70 | 5.4% | 11 |
| ATD-T | Alimentation Couche-Tard Inc. | 0.8% | $59.73 | 14.6% | $0.47 | 26.2% | 12 |
| BCE-T | Bell Canada | 6.1% | $60.02 | -8.9% | $3.64 | 4.0% | 13 |
| BIP-N | Brookfield Infrastructure Partners | 4.6% | $31.33 | -23.1% | $1.44 | 5.9% | 14 |
| CCL-B-T | CCL Industries | 1.6% | $58.36 | -13.9% | $0.96 | 14.3% | 20 |
| CNR-T | Canadian National Railway | 1.8% | $163.69 | 5.7% | $2.93 | 19.1% | 26 |
| CTC-A-T | Canadian Tire | 4.1% | $142.19 | -22.4% | $5.85 | 21.1% | 11 |
| CU-T | Canadian Utilities Limited | 4.8% | $37.07 | 1.3% | $1.78 | 1.0% | 50 |
| DOL-T | Dollarama Inc. | 0.3% | $80.00 | 26.2% | $0.22 | 9.2% | 11 |
| EMA-T | Emera | 5.1% | $52.33 | -16.4% | $2.68 | 4.1% | 15 |
| ENB-T | Enbridge Inc. | 6.4% | $53.69 | 8.4% | $3.44 | 3.0% | 26 |
| ENGH-T | Enghouse Systems Limited | 2.1% | $34.86 | -24.0% | $0.72 | 16.3% | 15 |
| FNV-N | Franco Nevada | 0.9% | $135.85 | -0.2% | $1.28 | 10.3% | 14 |
| FTS-T | Fortis | 3.9% | $55.09 | -8.9% | $2.17 | 4.3% | 48 |
| IFC-T | Intact Financial | 2.0% | $198.38 | 21.2% | $4.00 | 17.6% | 17 |
| L-T | Loblaws | 1.2% | $123.66 | 20.4% | $1.54 | 12.4% | 10 |
| MGA-N | Magna | 3.2% | $55.45 | -32.0% | $1.80 | 4.7% | 12 |
| MRU-T | Metro | 1.4% | $76.50 | 14.1% | $1.10 | 12.2% | 27 |
| RY-T | Royal Bank of Canada | 3.9% | $128.28 | -6.3% | $4.96 | 14.8% | 11 |
| SJ-T | Stella-Jones Inc. | 1.7% | $47.87 | 17.7% | $0.80 | 11.1% | 17 |
| STN-T | Stantec Inc. | 1.1% | $64.04 | -8.8% | $0.71 | 6.8% | 10 |
| TD-T | TD Bank | 4.0% | $88.33 | -11.1% | $3.56 | 12.7% | 11 |
| TFII-N | TFI International | 1.1% | $101.44 | -8.4% | $1.08 | 12.5% | 11 |
| TIH-T | Toromont Industries | 1.6% | $97.45 | -14.3% | $1.52 | 15.2% | 32 |
| TRP-T | TC Energy Corp. | 6.4% | $55.35 | -7.3% | $3.57 | 4.4% | 21 |
| T-T | Telus | 5.0% | $26.74 | -10.1% | $1.33 | 6.2% | 18 |
| WCN-N | Waste Connections | 0.7% | $133.37 | -0.5% | $0.95 | 11.8% | 12 |
| Averages | 3.2% | -5.2% | 10.6% | 18 |
We Just Bought TC Energy (TRP-T) for our MP Wealth-Builder Model Portfolio (CDN)
MP Market Review – December 16, 2022
Last updated by BM on December 19, 2022
Summary
- This article is part of our weekly series (MP Market Review) highlighting the performance and activity from the previous week related to the financial markets and Canadian dividend growth companies we follow on ‘The List’.
- Last week, ‘The List’ was down slightly with a minus -4.5% YTD price return (capital). Dividend growth of ‘The List’ remains at +10.6% YTD, demonstrating the rise in income over the last year.
- Last week, there were no dividend increases from companies on ‘The List’.
- Last week, there was one earnings report from a company on ‘The List’.
- No companies on ‘The List’ are due to report earnings this week.
- Are you looking to build an income portfolio of your own? When you become a premium subscriber, you get exclusive access to the MP Wealth-Builder Model Portfolio (CDN) and subscriber-only content. Start building real wealth today! Learn More
“Cash is not a safe investment; it is not a safe place because it will be taxed by inflation.”
– Ray Dalio
DGI Truth #3: Dividend growth investors enjoy inflation-protected income
With annual inflation rates at or below 2% for most of the last decade, there was not a lot of attention paid to ones purchasing power over time. That has changed, with inflation rates in the mid to high single digits. Many investors are now not keeping pace or are falling behind.
Dividend growth investing keeps pace with inflation in two ways. The most obvious is the growth rate of the dividend. If the dividend grows faster than the inflation rate, your income’s purchasing power is protected. The second way is by investing in a portfolio of dividend growth stocks that have the potential to generate price returns that are higher than the rate of inflation over time.
When the central banks talk about inflation in the news, we can quickly look at our dividend growth YTD% and measure how we are doing. Last we checked, the inflation rate was between 6-7%, and our sample dividend growth portfolio DIV YTD% was up 10.6% (‘The List’).
It is important to point out, though, that our PRICE YTD% column from ‘The List’ did not keep pace with inflation this year. That can sometimes happen in the short term, but I have yet to see it over longer time horizons.
By focusing on the dividend growth rate every year, we have a metric where we can easily see the effects inflation has on our purchasing power. We know from our other DGI Truths that our capital will soon rise above the inflation rate, even if it is not evident in the short term.
Performance of ‘The List’
At the end of the post is a snapshot of ‘The List’ from last Friday’s close. Feel free to click on the ‘The List’ menu item above for a sortable version.
Last week, ‘The List’ was down slightly with a minus -4.5% YTD price return (capital). Dividend growth of ‘The List’ remains at +10.6% YTD, demonstrating the rise in income over the last year.
The best performers last week on ‘The List’ were Enghouse Systems Limited (ENGH-T), up +8.46%; TFI International (TFII-N), up +1.60%; and Canadian Utilities Limited (CU-T), up +0.40%.
Franco Nevada (FNV-N) was the worst performer last week, down -5.90%.
Recent News
TC Energy’s Keystone rupture is bad news. Here’s why investors aren’t concerned (Globe & Mail)
“It was one of the largest oil spills in the United States in more than a decade. But the impact on TC Energy’s share price has been muted, to say the least.”
Although the news is a bit alarming, history has shown that these types of spills have a negligible impact on earnings. Smart investors often use such narratives to buy more (TRP-T) on any sign of price weakness. TC Energy is a quality company in an industry that has many barriers to entry, not to mention a dividend growth streak of 22 years and counting.
Rate hikes could cast long shadow as Bank of Canada approaches pause (Globe & Mail)
https://www.theglobeandmail.com/business/article-bank-of-canada-interest-rate-hikes-pause/
“Economists at Royal Bank of Canada estimate that the average household will have around $3,000 less in purchasing power next year, after accounting for inflation and higher debt costs. RBC is forecasting a “mild” recession next year as consumers spend less.”
Last week’s weakness in the stock markets came about just after the US Federal Reserve announced another 50 basis point interest rate hike. The Fed Chair, Jerome Powell, also said that the US wasn’t finished and expects further rate hikes in 2023.
Although Canada’s central bank has not been as vocal, we would most likely get hurt by anything the U.S. decides to do. If we don’t raise rates alongside the U.S. we could see our loonie go down and further exacerbate Canadian inflation.
At a minimum, it is more probable than not that growth is likely to slow in 2023, impacting earnings for some of the dividend growers we follow.
Dividend Increases
Last week, there were no dividend increases from companies on ‘The List’.
Earnings Releases
No companies on ‘The List’ are due to report earnings this week.
One company, Enghouse Systems Limited (ENGH-T) released its fourth-quarter 2022 results last week on Wednesday, December 15, 2022, after markets closed.
“We have consistently demonstrated, even during adverse economic conditions, that we can generate positive operating cash flows and augment our cash reserves to be deployed for acquisitions and further investment in our business. We believe that our financial discipline, product approach and commitment to customers, partners and employees will continue to drive long-term shareholder value.”
– Chief Executive Officer, Stephen Sadler
Highlights:
Financial and operational highlights for the three and twelve months ended October 31, 2022, compared to the three and twelve months ended October 31, 2021, are as follows:
- Revenue achieved was $108.1 and $427.6 million, respectively, compared to revenue of $113.1 and $467.2 million;
- Results from operating activities was $33.1 and $129.7 million, respectively, compared to $39.1 and $155.2 million;
- Net income was $36.9 and $94.5 million, respectively, compared to $30.2 and $92.8 million;
- Adjusted EBITDA was $35.8 and $140.6 million, respectively, compared to $42.1 and $168.5 million while Adjusted EBITDA margins were 33.1% and 32.9%, respectively, compared to 37.2% and 36.1%;
- Cash flows from operating activities excluding changes in working capital was $37.7 and $145.1 million, respectively, compared to $42.4 and $167.8 million;
- Cash, cash equivalents and short-term investments were $228.1 million as at October 31, 2022 compared to $198.8 million at the end of the prior year.
Outlook:
COVID-19 continues to have a lessened impact on our business each quarter as it recedes from the public and business conscience. With the exclusion of the comparative negative impact to revenue in the first quarter of 2022, it had minimal impact on how we operated when comparing fiscal 2022 to fiscal 2021. We continue to monitor the ongoing situation with most of our offices returning to a hybrid work environment. We are beginning to see customer-related travel become more common but are focused on this cost to ensure it is generating appropriate revenue relative to the expense.
As we see a growing demand for SaaS solutions, as with all our revenue streams, we are careful to ensure that sales are achieved without sacrificing profitability, particularly as we observe some competitors reducing prices in an effort to retain revenue growth without achieving profitability.
As a result, we are also focused on ensuring our pricing is set appropriately to provide adequate margins. In light of future economic uncertainty, we remain cautiously optimistic and will exercise continued diligence on controlling expenses and take a conservative approach towards committing to new expenses. A large portion of our planning focuses on matching revenues with expenses such that we can continue to invest where outlooks are positive and curtail spending where unforeseen economic events may adversely impact our profitability. As always, we maintain our financial discipline when seeking earnings-accretive acquisitions to grow our revenue and further expand both our product suite and geographic reach, while maintaining our commitment to profitable growth. We will continue to operate our business consistent with our value-for-money philosophy that we believe provides shareholder value in the long term.
See the full Earnings Release here
Below is a snapshot of ‘The List’ from last Friday’s close. For a sortable version of ‘The List’, please click on The List menu item.
‘The List’ is not intended to be a portfolio others replicate. Rather, its purpose is to provide investment ideas and a real-time illustration of dividend growth investing in action. It is not a ‘Buy List’ nor reflects the composition or returns of our Magic Pants Wealth-Builder (CDN) Portfolios. It is only a starting point for our analysis and discussion of dividend growth investing concepts.
The List (2022)
Last updated by BM on December 16, 2022
*Note: The following graph is wide, you can scroll to the right on your device to see more of the data.
| SYMBOL | COMPANY | YLD | PRICE | YTD % | DIV | YTD % | STREAK |
|---|---|---|---|---|---|---|---|
| AQN-N | Algonquin Power & Utilities | 10.2% | $6.89 | -52.0% | $0.70 | 5.4% | 11 |
| ATD-T | Alimentation Couche-Tard Inc. | 0.8% | $61.25 | 17.6% | $0.47 | 26.2% | 12 |
| BCE-T | Bell Canada | 6.0% | $60.39 | -8.4% | $3.64 | 4.0% | 13 |
| BIP-N | Brookfield Infrastructure Partners | 4.5% | $32.01 | -21.4% | $1.44 | 5.9% | 14 |
| CCL-B-T | CCL Industries | 1.6% | $59.21 | -12.7% | $0.96 | 14.3% | 20 |
| CNR-T | Canadian National Railway | 1.8% | $166.46 | 7.5% | $2.93 | 19.1% | 26 |
| CTC-A-T | Canadian Tire | 4.1% | $143.29 | -21.8% | $5.85 | 21.1% | 11 |
| CU-T | Canadian Utilities Limited | 4.7% | $37.47 | 2.3% | $1.78 | 1.0% | 50 |
| DOL-T | Dollarama Inc. | 0.3% | $81.00 | 27.7% | $0.22 | 9.2% | 11 |
| EMA-T | Emera | 5.1% | $52.54 | -16.1% | $2.68 | 4.1% | 15 |
| ENB-T | Enbridge Inc. | 6.5% | $52.54 | 6.1% | $3.44 | 3.0% | 26 |
| ENGH-T | Enghouse Systems Limited | 2.0% | $35.00 | -23.7% | $0.72 | 16.3% | 15 |
| FNV-N | Franco Nevada | 1.0% | $132.50 | -2.6% | $1.28 | 10.3% | 14 |
| FTS-T | Fortis | 3.9% | $55.06 | -9.0% | $2.17 | 4.3% | 48 |
| IFC-T | Intact Financial | 2.0% | $198.10 | 21.0% | $4.00 | 17.6% | 17 |
| L-T | Loblaws | 1.3% | $122.14 | 18.9% | $1.54 | 12.4% | 10 |
| MGA-N | Magna | 3.2% | $57.11 | -30.0% | $1.80 | 4.7% | 12 |
| MRU-T | Metro | 1.4% | $76.69 | 14.4% | $1.10 | 12.2% | 27 |
| RY-T | Royal Bank of Canada | 3.9% | $127.96 | -6.5% | $4.96 | 14.8% | 11 |
| SJ-T | Stella-Jones Inc. | 1.7% | $47.70 | 17.3% | $0.80 | 11.1% | 17 |
| STN-T | Stantec Inc. | 1.1% | $66.12 | -5.8% | $0.71 | 6.8% | 10 |
| TD-T | TD Bank | 4.1% | $86.63 | -12.8% | $3.56 | 12.7% | 11 |
| TFII-N | TFI International | 1.0% | $105.53 | -4.7% | $1.08 | 12.5% | 11 |
| TIH-T | Toromont Industries | 1.5% | $100.45 | -11.6% | $1.52 | 15.2% | 32 |
| TRP-T | TC Energy Corp. | 6.5% | $55.17 | -7.6% | $3.57 | 4.4% | 21 |
| T-T | Telus | 4.9% | $27.03 | -9.2% | $1.33 | 6.2% | 18 |
| WCN-N | Waste Connections | 0.7% | $134.50 | 0.3% | $0.95 | 11.8% | 12 |
| Averages | 3.2% | -4.5% | 10.6% | 18 |
MP Market Review – December 09, 2022
Last updated by BM on December 12, 2022
Summary
- This article is part of our weekly series (MP Market Review) highlighting the performance and activity from the previous week related to the financial markets and Canadian dividend growth companies we follow on ‘The List’.
- Last week, ‘The List’ was down slightly with a minus -2.5% YTD price return (capital). Dividend growth of ‘The List’ remains at +10.6% YTD, demonstrating the rise in income over the last year.
- Last week, there were no dividend increases from companies on ‘The List’.
- Last week, there was one earnings report from a company on ‘The List’.
- One company on ‘The List’ is due to report earnings this week.
- Are you looking to build an income portfolio of your own? When you become a premium subscriber, you get exclusive access to the MP Wealth-Builder Model Portfolio (CDN) and subscriber-only content. Start building real wealth today! Learn More
“What is an investment, anyhow, but a body of capital that produces income. The income may be current income, or it may be prospective income, but it is the magnitude of the income, current or prospective, that determines the value of the capital which produces it.”
– Arnold Bernhard, The Evaluation of Common Stocks
DGI Truth #2: A rising dividend income stream will eventually lead to rising stock prices.
Let’s use real estate investing as an example. If you own a rental property in an area where rents have risen by ten percent annually for the past ten years, and someone approaches you to buy the property, the buyer must factor in future rent increases when deciding on a fair offer price. The property is worth more than its present value because of the relatively predictable rising income stream it produces.
Stocks with a long history of dividend growth offer the same type of value proposition, in that future dividend increases, are expected and will produce a growing stream of income that add value to the underlying company’s worth. Without a dividend and its growth, the future price for a stock becomes more speculative.
Now let’s look at a few examples from ‘The List’ to see if this theory holds true.


A railroad, a grocer and a utility. It doesn’t matter which industry our quality dividend growers are in. When you find one that grows both dividends and price in this manner, you begin to discover the magic of our dividend growth investing strategy.
What makes this sometimes hard to see in stocks is the very turbulent price movements that overwhelm income returns in the short term. Once you move beyond shorter-term cycles, the value of the stocks will be linked to the amount of income they produce for their owners.
Next week: DGI Truth #3: Dividends (income) grow faster than inflation.
Performance of ‘The List’
At the end of the post is a snapshot of ‘The List’ from last Friday’s close. Feel free to click on the ‘The List’ menu item above for a sortable version.
Last week, ‘The List’ was down slightly with a minus -2.5% YTD price return (capital). Dividend growth of ‘The List’ remains at +10.6% YTD, demonstrating the rise in income over the last year.
The best performers last week on ‘The List’ were Loblaws (L-T), up +2.67%; Canadian Utilities Limited (CU-T), up +2.53%; and Enghouse Systems Limited (ENGH-T), up +2.02%.
Magna (MGA-N) was the worst performer last week, down -4.99%
Recent News
The odds of your mutual fund consistently beating the market? Slim to none (Globe & Mail)
The article starts by asking and answering the billion-dollar question:
“Out of more than 650 Canadian actively managed equity mutual funds, how many of them were able to maintain superior returns over the last five years? Exactly zero.”
We say billion-dollar question because, for many years, investors’ hard-earned capital has been funneled back to wealth managers in the form of fees for returns that simply track the average of the markets or worse. They seem to know this as well (only one taker on the Buffett Bet in 2008).
There are many reasons for this, but my mentor Tom Connolly put it very succinctly in a recent blog article:
“Most professionals can’t win. Can’t. Notice I said ‘can’t’, not don’t win. Why they can’t is a complicated/interesting tale. It boils down to, and believe this, career risk. Professionals can’t afford to lose alone. They must conform.”
For many investors, this might come as shocking news, but for dividend growth investors, we have known this information for decades. It is precisely why we started researching different strategies over a decade ago and landed on dividend growth investing.
The best and worst provinces to live in for dividend investing (Globe & Mail)
It is usually a year into your dividend investing journey before you discover another magical aspect of this strategy; you pay fewer taxes on your dividend income than other forms of income.
We say about a year because you notice this deferred benefit when you file your first tax return as a dividend growth investor. As the author points out, the net impact depends on what province you live in.
Paying less tax than you do on regular and interest income means you will have more of your hard-earned capital to invest in dividend growth stocks, and income compounding continues.
Dividend Increases
Last week, there were no dividend increases from companies on ‘The List’.
Earnings Releases
One company on ‘The List’ is due to report earnings this week.
Enghouse Systems Limited (ENGH-T) will release its fourth-quarter 2022 results on Wednesday, December 15, 2022, after markets close.
Last week, one company on ‘The List’, Dollarama (DOL-T), reported their Q3 Fiscal 2023 earnings.
Dollarama (DOL-T) follows an off-cycle reporting schedule. Their fiscal year ends on October 31 each year. Their fiscal Q3 earnings are among the first on ‘The List’ to report in Q4 2022. The company released its third-quarter 2023 results on Wednesday, December 7, 2022, before markets opened.
“Our strong performance across our key metrics year to date speaks to our commitment to providing the best year-round value on the everyday products we offer, combined with a convenient and consistent shopping experience. As inflationary pressure on the consumer persists, we expect strong demand for consumable products to continue stimulating topline growth through to the end of the fiscal year. We aim to stay true to our compelling value proposition and to meet and exceed the expectations of our customers from coast to coast.”
– President and Chief Executive Officer, Neil Rossy
Highlights:
- 8% increase in comparable store sales(1) and 14.8% increase in diluted net earnings per share
- Fiscal 2023 comparable store sales growth assumption increased to between 9.5% and 10.5% and gross margin guidance narrowed to between 43.1% and 43.6% of sales
- New long-term store target for Dollarcity increased from 600 to 850 stores by 2029
Fiscal 2023 Third Quarter Highlights Compared to Fiscal 2022 Third Quarter Results
- Sales increased by 14.9% to $1,289.6 million
- Comparable store sales increased by 10.8%
- EBITDA increased by 11.3% to $386.2 million, or 29.9% of sales, compared to 30.9%
- Operating income increased by 11.5% to $302.7 million, or 23.5% of sales, compared to 24.2%
- Diluted net earnings per common share increased by 14.8% to $0.70 from $0.61
- 18 net new stores opened, compared to 16 net new stores
- 972,847 common shares repurchased for cancellation for $76.3 million
Outlook:
In the fourth quarter of Fiscal 2023, the Corporation expects to continue to benefit from strong demand for its affordable, everyday items in the context of inflation, including stronger than historical demand for lower-margin consumable products. As a result, the Corporation has increased its comparable store sales growth assumption for Fiscal 2023 from a range of 6.5% to 7.5% to the range of 9.5% and 10.5%. Based on gross margin performance to date and management’s visibility on open orders and product margins through the remainder of the fiscal year, the Corporation has narrowed its previously disclosed annual gross margin as a percentage of sales from a range of 42.9% to 43.9% to a range of 43.1% to 43.6%. The remainder of the Corporation’s annual guidance and previously disclosed assumptions on which guidance is based for Fiscal 2023 and issued on March 30, 2022, remain unchanged.
As of this date, the Corporation expects the following for Fiscal 2023:
- To open 60 to 70 net new stores
- Gross margin as a percentage of sales of between 43.1% and 43.6%
- SG&A as a percentage of sales of between 13.8% and 14.3%
- To deploy $160 million to $170 million in capital expenditures
- To actively repurchase shares under its normal course issuer bid
See the full Earnings Release here
Below is a snapshot of ‘The List’ from last Friday’s close. For a sortable version of ‘The List’, please click on The List menu item.
‘The List’ is not meant to be a template for investors to copy exactly. Instead, its purpose is to provide investment ideas and a real-time illustration of dividend growth investing in action. It is not a ‘Buy List’ nor does it reflect the composition or returns of our Magic Pants Wealth-Builder (CDN) Portfolio. It is only a starting point for our analysis and discussion.
The List (2022)
Last updated by BM on December 09, 2022
*Note: The following graph is wide, you can scroll to the right on your device to see more of the data.
| SYMBOL | COMPANY | YLD | PRICE | YTD % | DIV | YTD % | STREAK |
|---|---|---|---|---|---|---|---|
| AQN-N | Algonquin Power & Utilities | 9.8% | $7.19 | -49.9% | $0.70 | 5.4% | 11 |
| ATD-T | Alimentation Couche-Tard Inc. | 0.8% | $61.78 | 18.6% | $0.47 | 26.2% | 12 |
| BCE-T | Bell Canada | 5.7% | $63.34 | -3.9% | $3.64 | 4.0% | 13 |
| BIP-N | Brookfield Infrastructure Partners | 4.2% | $34.68 | -14.9% | $1.44 | 5.9% | 14 |
| CCL-B-T | CCL Industries | 1.6% | $60.59 | -10.6% | $0.96 | 14.3% | 20 |
| CNR-T | Canadian National Railway | 1.7% | $170.04 | 9.8% | $2.93 | 19.1% | 26 |
| CTC-A-T | Canadian Tire | 3.9% | $149.75 | -18.2% | $5.85 | 21.1% | 11 |
| CU-T | Canadian Utilities Limited | 4.8% | $37.32 | 1.9% | $1.78 | 1.0% | 50 |
| DOL-T | Dollarama Inc. | 0.3% | $82.43 | 30.0% | $0.22 | 9.2% | 11 |
| EMA-T | Emera | 5.0% | $53.36 | -14.7% | $2.68 | 4.1% | 15 |
| ENB-T | Enbridge Inc. | 6.4% | $53.39 | 7.8% | $3.44 | 3.0% | 26 |
| ENGH-T | Enghouse Systems Limited | 2.2% | $32.27 | -29.6% | $0.72 | 16.3% | 15 |
| FNV-N | Franco Nevada | 0.9% | $140.81 | 3.5% | $1.28 | 10.3% | 14 |
| FTS-T | Fortis | 3.9% | $54.98 | -9.1% | $2.17 | 4.3% | 48 |
| IFC-T | Intact Financial | 2.0% | $203.97 | 24.6% | $4.00 | 17.6% | 17 |
| L-T | Loblaws | 1.2% | $125.55 | 22.2% | $1.54 | 12.4% | 10 |
| MGA-N | Magna | 3.1% | $58.24 | -28.6% | $1.80 | 4.7% | 12 |
| MRU-T | Metro | 1.4% | $78.38 | 16.9% | $1.10 | 12.2% | 27 |
| RY-T | Royal Bank of Canada | 3.8% | $130.91 | -4.3% | $4.96 | 14.8% | 11 |
| SJ-T | Stella-Jones Inc. | 1.6% | $48.69 | 19.7% | $0.80 | 11.1% | 17 |
| STN-T | Stantec Inc. | 1.1% | $66.12 | -5.8% | $0.71 | 6.8% | 10 |
| TD-T | TD Bank | 3.9% | $90.55 | -8.9% | $3.56 | 12.7% | 11 |
| TFII-N | TFI International | 1.0% | $103.87 | -6.2% | $1.08 | 12.5% | 11 |
| TIH-T | Toromont Industries | 1.5% | $99.89 | -12.1% | $1.52 | 15.2% | 32 |
| TRP-T | TC Energy Corp. | 6.2% | $57.74 | -3.3% | $3.57 | 4.4% | 21 |
| T-T | Telus | 4.7% | $28.10 | -5.6% | $1.33 | 6.2% | 18 |
| WCN-N | Waste Connections | 0.7% | $139.94 | 4.4% | $0.95 | 11.8% | 12 |
| Averages | 3.1% | -2.5% | 10.6% | 18 |
MP Market Review – December 02, 2022
Last updated by BM on December 05, 2022
Summary
- This article is part of our weekly series (MP Market Review) highlighting the performance and activity from the previous week related to the financial markets and Canadian dividend growth companies we follow on ‘The List’.
- Last week, ‘The List’ was up slightly with a minus -1.3% YTD price return (capital). Dividend growth of ‘The List’ remains at +10.6% YTD, demonstrating the rise in income over the last year.
- Last week, there were three dividend increases from companies on ‘The List’.
- Last week, there were two earnings reports from companies on ‘The List’.
- No companies on ‘The List’ are due to report earnings this week.
- Are you looking to build an income portfolio of your own? When you become a premium subscriber, you get exclusive access to the MP Wealth-Builder Model Portfolio (CDN) and subscriber-only content. Start building real wealth today! Learn More
“As Keynes wrote in 1936, “attach your hopes to its prospective yield”. It’s not the dividend that has the magic; it’s the increasing dividends that drive growing wealth. Realize this difference; it’s crucial.”
– Tom Connolly
We have spent some time this fall condensing everything we have read about dividend growth investing (DGI) over the past two decades and are in the process of creating a blog article on what we consider DGI Truths.
One of those truths we discovered is that we can’t control economic cycles (markets), but we can control income.
Nowhere is this more true than in the North American stock markets this year. In 2022 we have seen some amazing swings in market values with the overall trend downward. The markets, at times, have seemed out of control.

On the flipside, we continue to add quality dividend growers to our portfolios, and every one of the companies we own has increased its dividend again in 2022. An example of dividend growth investing in action is shown on ‘The List’ we follow on the blog. Although there is plenty of price volatility in the companies we follow, all have raised their dividend and has posted an average increase of 10.6%! There has been no volatility when it comes to income.
Aside from having good dividend growth records, one of the reasons we have confidence in future income growth is that the dividend growth companies we follow do a good job of communicating dividend payout guidance/policies in their investor presentations. Some have already increased their dividends again (as they said they would) in 2023. See the dividend increases section below for three examples.
In summary, we have learned that dividend growth in quality companies is very predictable year over year and is something we can rely on. Every once in a while, there is a dividend freeze or dividend cut, but overall, our portfolio income grows yearly.
If you are looking for peace of mind and predictability with your investments in 2023, maybe it’s time to change how you keep score. Stop looking at the value of your portfolio and keep your score based on income growth. You will be much happier with your investment decisions.
A second truth, which we will discuss in more detail next week, is that a rising dividend income stream will eventually lead to rising stock prices.
Performance of ‘The List’
At the end of the post is a snapshot of ‘The List’ from last Friday’s close. Feel free to click on the ‘The List’ menu item above for a sortable version.
Last week, ‘The List’ was up slightly with a minus -1.3% YTD price return (capital). Dividend growth of ‘The List’ remains at +10.6% YTD, demonstrating the rise in income over the last year.
The best performers last week on ‘The List’ were Enghouse Systems Limited (ENGH-T), up +4.80%; Loblaws (L-T), up +3.85%; and Dollarama Inc. (DOL-T), up +3.76%.
TC Energy Corp. (TRP-T) was the worst performer last week, down -11.79%.
Recent News
Grocery costs to rise by up to 7% in 2023 as pandemic, Russia’s war fuel increase, report says (Globe & Mail)
“Canada’s Food Price Report says the cost of groceries will increase by 5 per cent to 7 per cent in 2023, compounding the financial burden of a year of record-high food inflation that saw prices climb 10.3 per cent between November, 2021, and September, 2022.
By way of comparison, in its October Monetary Policy Report, the Bank of Canada said it expects the consumer price index to fall to about 3 per cent by late 2023.”
Who to believe?
The article says that the Canadian dollar is the critical piece right now as it can impact the cost of imports.
Do you still think that the Bank of Canada has inflation under control, or are more interest rate hikes more probable than not?
Forecasters split on how high Bank of Canada will push next rate hike (Globe & Mail)
“The central bank has raised interest rates six times since March in an effort to tackle the highest inflation in four decades. Higher rates make it more expensive for Canadians to borrow money and service their existing debts, with the goal of curbing demand for goods and services and acting as a brake on price increases.”
The article says forecasters are split on whether we get a 50 basis point hike now or two 25 basis point hikes in the next two months.
We must be careful and not rush into the market or get caught up in all the talk about a ‘fed pivot’. The point is that all agree that interest rates will continue to rise, and this will slow down the economy, which will impact earnings. How much and how fast these rates rise will always be up for debate.
Dividend Increases
Three companies on ‘The List’ announced a dividend increase last week.
Royal Bank (RY-T) on Wednesday said it increased its 2023 quarterly dividend from $1.28 to $1.32 per share, payable February 24, 2023, to shareholders of record on January 26, 2023.
This represents a dividend increase of +3%, marking the 12th straight year of dividend growth for this quality financial institution.
Enbridge Inc. (ENB-T) on Wednesday said it increased its 2023 quarterly dividend from $3.44 to $3.55 per share, payable March 1, 2023, to shareholders of record on February 14, 2023.
This represents a dividend increase of +3.2%, marking the 27th straight year of dividend growth for this oil and gas midstream company.
TD Bank (TD-T) on Thursday said it increased its 2023 quarterly dividend from $0.89 to $0.96 per share, payable January 31, 2023, to shareholders of record on January 6, 2023.
This represents a dividend increase of +7.9%, marking the 12th straight year of dividend growth for this quality financial institution.
Earnings Releases
No companies on ‘The List’ are due to report earnings this week.
Both Royal Bank (RY-T) and TD Bank (TD-T) follow an off-cycle reporting schedule. Their fiscal year ends on October 31 each year. Their fiscal Q4 earnings were reported last week.
Royal Bank of Canada (RY-T) released its fourth-quarter 2022 results on Wednesday, November 30, 2022, before markets opened.
“While market conditions continue to be tough, our 2022 results reflect a resilient bank that is well-positioned to pursue strategic growth and deliver long-term shareholder value. Our premium businesses, strong balance sheet, prudent risk management and diversified business model mean we can deliver advice and services that help our clients navigate all cycles. RBC colleagues remain focused on building more exceptional experiences for our clients and supporting sustainable and prosperous communities.”
– RBC President and Chief Executive Officer, Dave McKay
Highlights:
2022 Full-Year Business Segment Performance
- 7% earnings growth in Personal & Commercial Banking, primarily attributable to higher net interest income, driven by average volume growth of 9% in both loans and deposits in Canadian Banking, and higher spreads. As a result of the rising interest rate environment (Bank of Canada raised the benchmark interest rate by 350 bps from March to October 2022), we saw higher spreads as compared to the prior year. Higher non-interest income, including higher foreign exchange revenue, card service revenue and service charges driven by increased client activity also contributed to the increase in earnings. These factors were partially offset by higher PCL, and higher staff and technology related costs. Our Canadian Banking franchise generated strong positive operating leverage of 3.8% while continuing to invest in digital initiatives to improve the client experience and deliver personalized advice.
- 20% earnings growth in Wealth Management, mainly due to higher net interest income driven by average volume growth of 19% in loans and 11% in deposits largely in U.S. Wealth Management (including City National), and higher interest rates. Higher average fee-based client assets primarily reflecting net sales, as well as the impact of a legal provision taken in U.S. Wealth Management (including City National) in the prior year that was partially released in the first quarter of 2022, also contributed to the increase. These factors were partially offset by higher staff-related costs and variable compensation.
- 4% lower earnings in Insurance, largely due to the impact of lower new longevity reinsurance contracts, partially offset by higher favourable investment-related experience.
- 17% earnings growth in Investor & Treasury Services, mainly due to higher revenue from client deposits reflecting improved margins, partially offset by higher technology-related costs.
- 30% lower earnings in Capital Markets, primarily driven by lower revenue in Corporate & Investment Banking, larger releases of provisions on performing assets in the prior year and lower revenue in Global Markets. Global investment banking fee pools were impacted by weakness in credit and equity markets beginning in the second fiscal quarter of 2022, resulting in an approximately 30% decline in global investment banking fee pools9 this fiscal year compared to record levels in fiscal 2021.

Outlook:
“Before I discuss the strategic initiatives that will drive our growth over the coming years, I will provide my perspective on the macro environment. Elevated uncertainty continues to affect asset valuations and market volatility, which in turn is impacting investor sentiment and client activity in both public and private markets.
While strong labour markets paint a favourable picture, and inflation appears to have peaked, we maintain our cautious stance on the outlook for economic growth. This caution stems from elevated housing and energy prices, political and geopolitical instability, a pressured manufacturing sector, and an aggressive monetary policy stance by central banks. Although higher interest rates are needed to preserve long-term economic stability, the lagging impact of monetary policy combined with strong employment and significant liquidity in the system has likely delayed what may end up being a brief and moderate recession.”
– President & Chief Executive Officer, Dave McKay
See the full Earnings Release here
TD Bank (TD-T) released its fourth-quarter 2022 results on Thursday, December 1, before markets opened.
“I’m extremely pleased with our earnings performance this quarter, which capped off a strong year demonstrating the benefit of our diversified business model and prudent risk and financial management. The strength and resilience of our franchise enabled the Bank to invest in our business and deliver for our shareholders.”
– President & Chief Executive Officer, Bharat Masrani
Highlights:
FOURTH QUARTER FINANCIAL HIGHLIGHTS, compared with the fourth quarter last year:
- Reported diluted earnings per share were $3.62 compared with $2.04.
- Adjusted diluted earnings per share were $2.18, compared with $2.09.
- Reported net income was $6,671 million, compared with $3,781 million.
- Adjusted net income was $4,065 million, compared with $3,866 million.
FULL YEAR FINANCIAL HIGHLIGHTS, compared with last year:
- Reported diluted earnings per share were $9.47, compared with $7.72.
- Adjusted diluted earnings per share were $8.36, compared with $7.91.
- Reported net income was $17,429 million, compared with $14,298 million.
- Adjusted net income was $15,425 million, compared with $14,649 million.
Outlook:
For the year ahead, there are both tailwinds (including the interest rate environment and the anticipated closing of the announced acquisitions) and headwinds (including geopolitical tensions, the complex operating environment, and the potential for an economic slowdown). On balance, unless macroeconomic conditions were to shift dramatically, TD expects to meet or exceed its medium-term adjusted EPS growth target range of 7-10% in fiscal 2023.
We enter 2023 from a position of strength, with growing businesses and a powerful purpose-driven brand. While there will be macroeconomic and geopolitical challenges in the year ahead, the progress we made in 2022 gives me great confidence in our future success,” added Masrani.
Below is a snapshot of ‘The List’ from last Friday’s close. For a sortable version of ‘The List’, please click on The List menu item.
‘The List’ is not meant to be a template for investors to copy exactly. Instead, its purpose is to provide investment ideas and a real-time illustration of dividend growth investing in action. It is not a ‘Buy List’ nor does it reflect the composition or returns of our Magic Pants Wealth-Builder (CDN) Portfolio. It is only a starting point for our analysis and discussion.
The List (2022)
Last updated by BM on December 02, 2022
*Note: The following graph is wide, you can scroll to the right on your device to see more of the data.
| SYMBOL | COMPANY | YLD | PRICE | YTD % | DIV | YTD % | STREAK |
|---|---|---|---|---|---|---|---|
| AQN-N | Algonquin Power & Utilities | 9.3% | $7.55 | -47.4% | $0.70 | 5.4% | 11 |
| ATD-T | Alimentation Couche-Tard Inc. | 0.8% | $61.38 | 17.8% | $0.47 | 26.2% | 12 |
| BCE-T | Bell Canada | 5.7% | $63.65 | -3.4% | $3.64 | 4.0% | 13 |
| BIP-N | Brookfield Infrastructure Partners | 4.1% | $35.35 | -13.2% | $1.44 | 5.9% | 14 |
| CCL-B-T | CCL Industries | 1.5% | $62.38 | -8.0% | $0.96 | 14.3% | 20 |
| CNR-T | Canadian National Railway | 1.7% | $172.04 | 11.1% | $2.93 | 19.1% | 26 |
| CTC-A-T | Canadian Tire | 3.8% | $155.49 | -15.1% | $5.85 | 21.1% | 11 |
| CU-T | Canadian Utilities Limited | 4.9% | $36.40 | -0.6% | $1.78 | 1.0% | 50 |
| DOL-T | Dollarama Inc. | 0.3% | $83.79 | 32.1% | $0.22 | 9.2% | 11 |
| EMA-T | Emera | 5.1% | $52.33 | -16.4% | $2.68 | 4.1% | 15 |
| ENB-T | Enbridge Inc. | 6.3% | $54.69 | 10.4% | $3.44 | 3.0% | 26 |
| ENGH-T | Enghouse Systems Limited | 2.3% | $31.63 | -31.0% | $0.72 | 16.3% | 15 |
| FNV-N | Franco Nevada | 0.9% | $145.54 | 6.9% | $1.28 | 10.3% | 14 |
| FTS-T | Fortis | 4.0% | $54.07 | -10.6% | $2.17 | 4.3% | 48 |
| IFC-T | Intact Financial | 2.0% | $204.68 | 25.0% | $4.00 | 17.6% | 17 |
| L-T | Loblaws | 1.3% | $122.28 | 19.0% | $1.54 | 12.4% | 10 |
| MGA-N | Magna | 2.9% | $61.30 | -24.9% | $1.80 | 4.7% | 12 |
| MRU-T | Metro | 1.4% | $77.67 | 15.9% | $1.10 | 12.2% | 27 |
| RY-T | Royal Bank of Canada | 3.7% | $134.21 | -1.9% | $4.96 | 14.8% | 11 |
| SJ-T | Stella-Jones Inc. | 1.6% | $48.98 | 20.4% | $0.80 | 11.1% | 17 |
| STN-T | Stantec Inc. | 1.0% | $67.61 | -3.7% | $0.71 | 6.8% | 10 |
| TD-T | TD Bank | 3.9% | $92.36 | -7.0% | $3.56 | 12.7% | 11 |
| TFII-N | TFI International | 1.0% | $105.82 | -4.5% | $1.08 | 12.5% | 11 |
| TIH-T | Toromont Industries | 1.5% | $103.48 | -9.0% | $1.52 | 15.2% | 32 |
| TRP-T | TC Energy Corp. | 6.1% | $58.19 | -2.6% | $3.57 | 4.4% | 21 |
| T-T | Telus | 4.7% | $28.60 | -3.9% | $1.33 | 6.2% | 18 |
| WCN-N | Waste Connections | 0.6% | $145.45 | 8.5% | $0.95 | 11.8% | 12 |
| Averages | 3.0% | -1.3% | 10.6% | 18 |

I’ll coach you on how to identify high-quality individual dividend growth stocks when they are sensibly priced, and hold them for the growing income.