“You have a pair of pants. In the left pocket, you have $100. You take $1 out of the left pocket and put in the right pocket. You now have $101. There is no diminution of dollars in your left pocket. That is one magic pair of pants.”

Category: Uncategorized

‘The List’ – Portfolio Review (June 2022)

Posted by BM on June 30, 2022 

Summary:

  • This article is part of our monthly series where we highlight companies on ‘The List’ that meet our minimum criteria of 6.5% EPS yield.
  • A fair valuation is the second rule in our three-step process. Buying when our quality stocks are sensibly priced will help ensure our future investment returns meet our expectations.
  • This month we will review Stella-Jones Inc. (SJ-T).
  • Are you looking for a portfolio of ideas like this one? Magic Pants DGI Premium Membership Subscribers get exclusive access to the MP Wealth-Builder Model Portfolio (CDN). Learn More

Proper investing is all about taking advantage of the long-run opportunities that the short-run imbalances give you. In arriving at a sensible price, we use an earnings-determined market price. Emotions determine the market price in the short run, and earnings determine the price in the long run.

We rely heavily on the fundamentals analyzer software tool (FASTgraphs) and YCHARTS to help us understand the operating results of the stocks we invest in. We then read the Company’s website for investor presentations and recent earnings reports to learn more.

Source: FASTgraphs 

Intro:

Stella-Jones Inc. (SJ-T) is North America’s leading producer of pressure-treated wood products. It supplies all of the continent’s major electrical utilities and telecommunication companies with wood utility poles and North America’s Class 1, short line and commercial railroad operators with railway ties and timbers.

Stella-Jones also provides industrial products, which include wood for railway bridges and crossings, marine and foundation pilings, construction timbers and coal tar-based products. Additionally, the Company manufactures and distributes premium residential lumber and accessories to Canadian and American retailers for outdoor applications. A significant portion of the business is devoted to servicing the Canadian market through its national manufacturing and distribution network.

Source: Investor Presentation May 2022-Company website

Historical Graph:

Source: FASTgraphs

Comments:

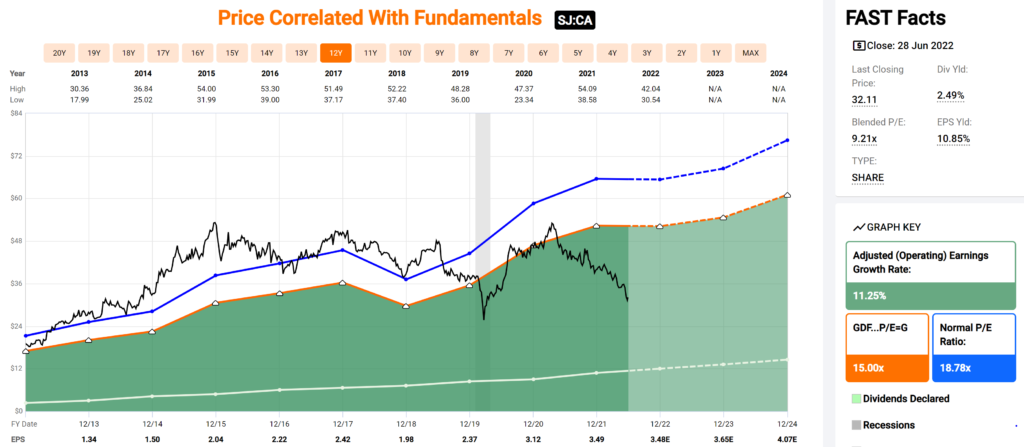
Stella-Jones’ valuation corridor has widened in recent years. For much of the last decade, a sensible price (Black Line) was at or close to the normal P/E (Blue Line). When COVID hit, the volatility of lumber prices either helped or hindered the share price. The normal P/E is now hitting levels not seen since the financial crisis in 2008-09.

The long-term fundamentals show a company whose annualized earnings have grown steadily over the last ten years at ~11.25%. A more recent analysis, however, sees earnings growth slowing to about half of that.

Dividend/Price Growth Alignment:

Comments:

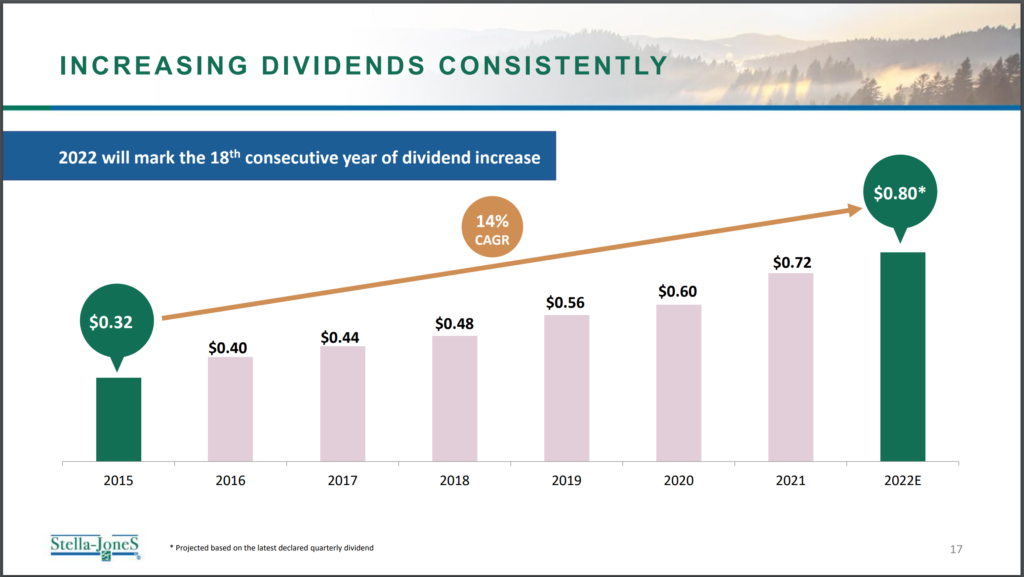
We talk a lot in our blog about dividend growth and price growth alignment over the longer term. Stella-Jones Inc. has grown its dividend much faster than its price has increased. This can sometimes be a red flag if the payout ratio rises too high and puts the dividend at risk. This is not the case with Stella-Jones Inc. as the dividend payout ratio is only 24% and well covered by free cash flow.

We like to see our dividend growers double our income and capital over a decade. (SJ-T) has more than met this criterion. 

Yield Chart:

Comments:

Popularized by Investment Quality Trends (IQT) in the 1960s, ‘Dividend Yield Theory’ is simple and intuitive. It says that dividend yields tend to revert to the mean for quality dividend growth stocks, meaning those with stable business models that don’t significantly change over time.

In the case of Stella-Jones Inc., the dividend yield is the highest in the last ten years at 2.32%. According to the theory, (SJ-T) is currently undervalued based on today’s price. A five-year chart will show a similar undervaluation.

Performance Graph:

Source: FASTgraphs

Comments:

Stella-Jones Inc. has had an average annualized dividend growth rate of 19.14% over the last ten years. The Company also has an annualized total return of 12.94% over that period. (SJ-T) recently announced a dividend increase of ~11.0. 

Estimated Earnings:

Source: FASTgraphs

Comments:

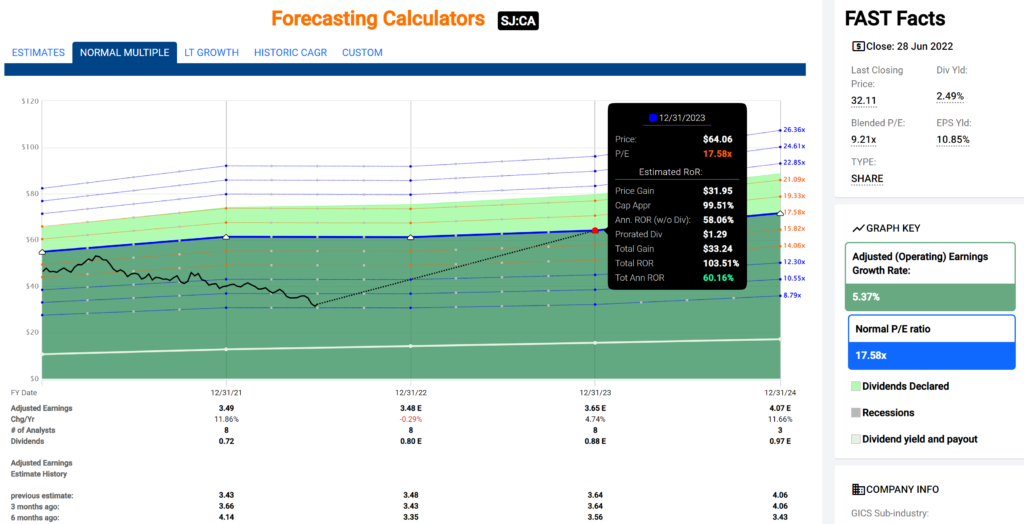
Using the “Normal Multiple’ estimating tool from FASTgraphs, we see a Normal P/E average over the last five years of 17.58. Based on Analysts’ forecasts one and a half years out, they are estimating an annualized return, based on today’s price, of 60.16% should (SJ-T) trade at its five-year average P/E.

Of importance is that analysts have been revising their estimates for 2022 downward but 2023 and 2024 upwards. Analysts believe the rest of 2022 will be challenging for Stella-Jones Inc. In the longer term, earnings are estimated to recover and grow.

Analyst Scorecard:

Source: FASTgraphs

Comments:

Analyst performance on hitting estimates over the years is above average on one and two-year earnings projections. Analysts’ forecasts have hit or beat ~77% of the time on one-year estimates and ~85% on two-year forecasts.

Recent Earnings Report-Q1 2022:

“With 2022 underway, we are pleased to report first-quarter results that delivered on our expectations,” stated Éric Vachon, President and CEO of Stella-Jones. “Sales increased quarter-over-quarter primarily due to strong organic growth in our infrastructure-related businesses and contributions from the recent Cahaba acquisitions. This growth was largely offset by lower residential lumber sales which, coupled with increasing input costs, pressured our margins. While contractual price adjustments are being implemented to cover escalating costs across the industry supply chain, we anticipate a certain degree of lag until the cost environment stabilizes.”

Sales for the first quarter of 2022 amounted to $651 million, up from sales of $623 million for the same period in 2021. Excluding the contribution from the acquisitions of Cahaba Pressure Treated Forest Products, Inc. and Cahaba Timber, Inc. of $15 million dollars, pressure-treated wood sales rose by $21 million, or 4%, mainly driven by strong organic growth across the Company’s infrastructure-related businesses, namely utility poles, railway ties and industrial products, offset in large part by a decrease in sales for residential lumber and logs and lumber product categories when compared to their exceptional sales growth in the first quarter of 2021.

Pressure-treated wood products:

  • Utility poles (39% of Q1-22 sales): Utility poles sales amounted to $254 million in the first quarter of 2022, up from $206 million for the same period last year. Excluding the contribution from acquisitions, sales increased 16%, driven by the continued improvement in maintenance demand, upward price adjustments in response to cost increases and a better sales mix, mainly due to the impact of additional fire-resistant wrapped pole sales volumes.
  • Railway ties (27% of Q1-22 sales): Sales of railway ties amounted to $175 million in the first quarter of 2022, up from $158 million for the corresponding period last year. The sales growth was almost all attributable to favourable sales price adjustments for Class 1 customers, largely to cover higher fibre costs, and higher pricing for non-Class 1 customers. Overall, volumes were relatively unchanged compared to the same period last year.
  • Residential lumber (20% of Q1-22 sales): Residential lumber sales totalled $132 million in the first quarter of 2022, down from $166 million of sales generated in the first quarter of 2021. This decrease was largely attributable to lower sales volume, offset in part by the higher market price of lumber. While sales in the first quarter of 2022 were lower compared to the strong sales realized in the same quarter last year, they exceeded the $58 million of sales generated in the first quarter of the pre-pandemic year 2019, due to both pricing and volume gains.
  • Industrial products (5% of Q1-22 sales): Industrial product sales amounted to $33 million in the first quarter of 2022, slightly up compared to the $28 million of sales generated a year ago, largely due to increased demand for pilings and timber.

Logs and lumber:

  • Logs and lumber (9% of Q1-22 sales): Logs and lumber sales totaled $57 million in the first quarter of 2022, down from $65 million compared to the same period last year. In the course of procuring residential lumber, excess lumber is obtained and resold. The decrease in sales is largely due to less lumber trading activity compared to same period last year.

Outlook:

Stella-Jones’ sales are primarily to critical infrastructure-related businesses. While all product categories can be impacted by short-term fluctuations, the overall business is mostly based on replacement and maintenance-driven requirements, which are rooted in long-term planning. Corresponding to this longer-term horizon and to better reflect the expected sales run-rate for residential lumber and reduce the impact of commodity price volatility, the Company shifted its guidance to a three-year outlook in early 2022. Below are key highlights of the 2022-2024 outlook with a more comprehensive version, including management assumptions, available in the Company’s MD&A.

Key Highlights:

  • Compound annual sales growth rate in the mid-single digit range from 2019 pre-pandemic levels to 2024;
  • EBITDA margin of approximately 15% for the 2022-2024 period;
  • Capital investment of $90 to $100 million to support the growing demand of its infrastructure-related customer base, in addition to the $50 to $60 million of annual capital expenditures;
  • Residential lumber sales expected to stabilize between 20-25% of total sales while infrastructure-related businesses expected to grow and represent 75-80% of total sales by 2024;
  • Anticipated returns to shareholders between $500 and $600 million during three-year outlook period;
  • Leverage ratio of 2.0x-2.5x between 2022-2024, but may temporarily exceed range to pursue acquisitions.

“In terms of market dynamics, customer demand for utility poles remains robust, based on planned infrastructure investments as well as ongoing replacement programs by utility and telecommunication companies. The trend for railway ties is also positive for 2022, although we are experiencing longer than expected tightness in the market supply for untreated ties. Residential lumber sales in the first quarter were higher than expected, but the peak summer season will be more telling as to the overall performance of this business for the year. In short, we are laying the foundation to achieve our three-year strategic plan and our performance for the first quarter provides a good start,” concluded Mr. Vachon.

Analyst coverage:

Analyst Michael Tupholme lowered his price target on shares of the Canadian producer of industrial pressure-treated wood products to $45 from $50, following a series of virtual investor meetings with SJ’s management.

“There was no material new information provided that would cause us to change our views regarding SJ’s overall outlook,” Tupholme said in a note to clients. “Still, on the whole, we characterize management’s commentary and the tone of the meetings as generally encouraging, particularly when considered in the context of recent equity market declines and increased concerns regarding the broader economic outlook.”

“We continue to see SJ’s valuation as overly depressed and believe that the stock offers compelling long-term upside potential,” the analyst said. “At the same time, given current heightened investor concern around the economic outlook, we believe that a recovery in the stock’s valuation may take longer than previously expected, which, along with what we see as a lack of near-term catalysts for SJ, has caused us to lower our recommendation…”

Conclusion:

(SJ-T) issensibly priced’ at current levels. There is also a margin of safety built-in compared to historical fundamentals. We are watching this one closely for revised guidance or further price weakness and a possible entry point for our MP Wealth-Builder Model Portfolio (CDN). Learn More.

‘The List’ – Portfolio Review (May 2022)

Posted by BM on May 31, 2022 

Each month we walk through our valuation process using a company on ‘The List’ that meets our minimum of 6.5% EPS Yield. The company we will review today is Royal Bank (RY-T).

A fair valuation is the second rule in our three-step process. Buying when our quality stocks are sensibly priced will help ensure our future investment returns meet our expectations. We rely heavily on the fundamentals analyzer software tool (FASTgraphs) to help us understand the operating results of the stocks we invest in and then read the company’s website for investor presentations and recent earnings reports to learn more.
In arriving at a sensible price, we use an earnings-determined market price. Emotions determine the market price in the short run, and earnings determine the price in the long run. Proper investing is all about taking advantage of long-run opportunities that the short-run imbalances give you.

Intro:

Royal Bank of Canada is one of the two largest banks in Canada. It is a diversified financial services company offering personal and commercial banking, wealth management services, insurance, corporate banking, and capital markets services. The bank is concentrated in Canada, with additional operations in the U.S. and other countries.

Historical Graph:

Price Correlated with Fundamentals May 2022
Source: FASTgraphs

Comments:

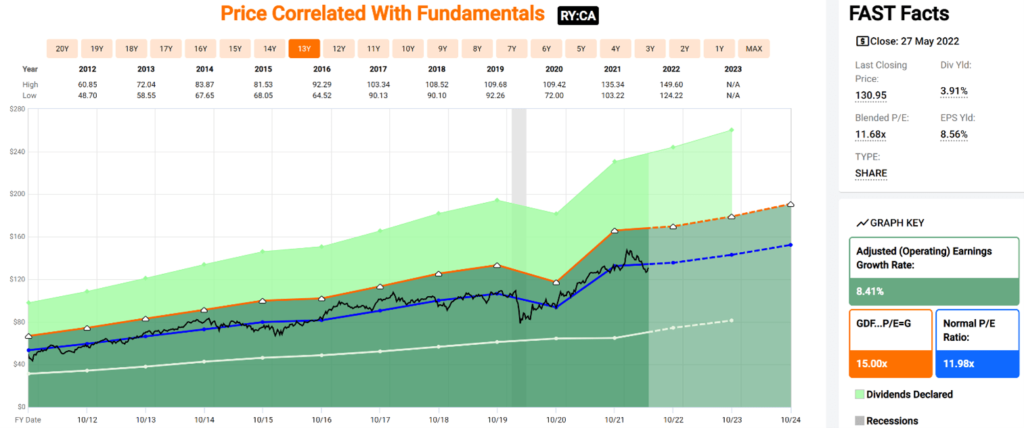
Royal Bank has a narrow valuation corridor. The Black Line (Price) never strays too far from the Blue Line (Normal P/E). A price below the average P/E line has historically been a good entry point for RY-T.

The fundamentals show a company whose annualized earnings have grown steadily over the last ten years at ~8.41%.

Dividend/Price Growth Alignment:

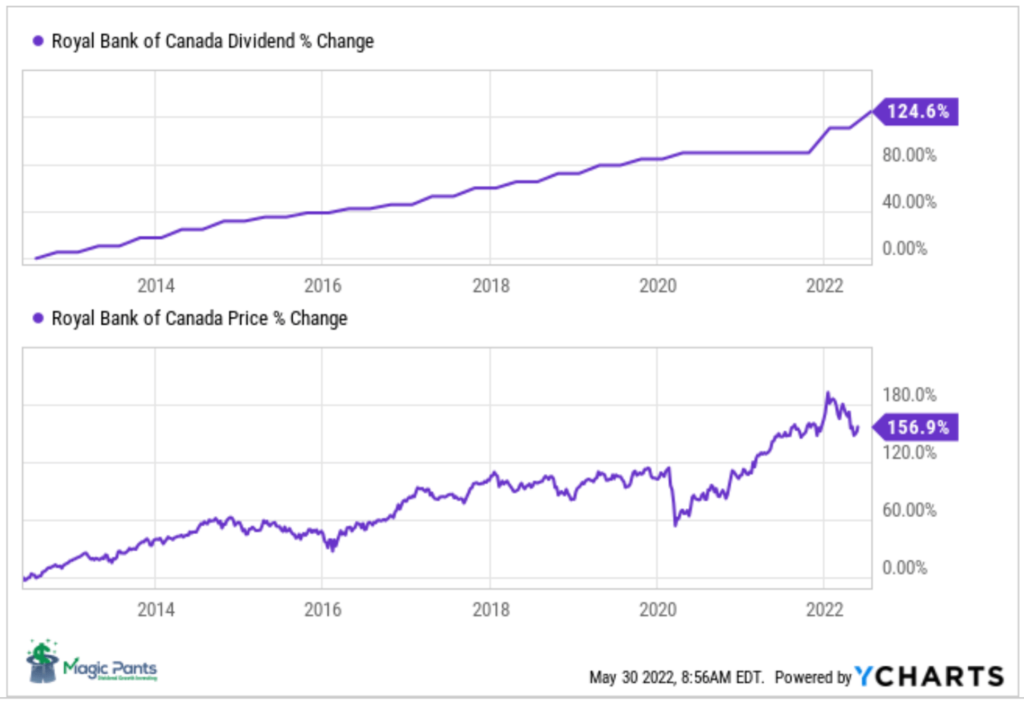
Comments:

We talk a lot in our blog about dividend growth and price growth alignment over the longer term. RY-T is one of those companies that follow this pattern. We like to see our income and capital double over ten years. These graphs show that the price growth is currently slightly ahead of dividend growth, a sign of overvaluation.

Yield Chart:

Comments:

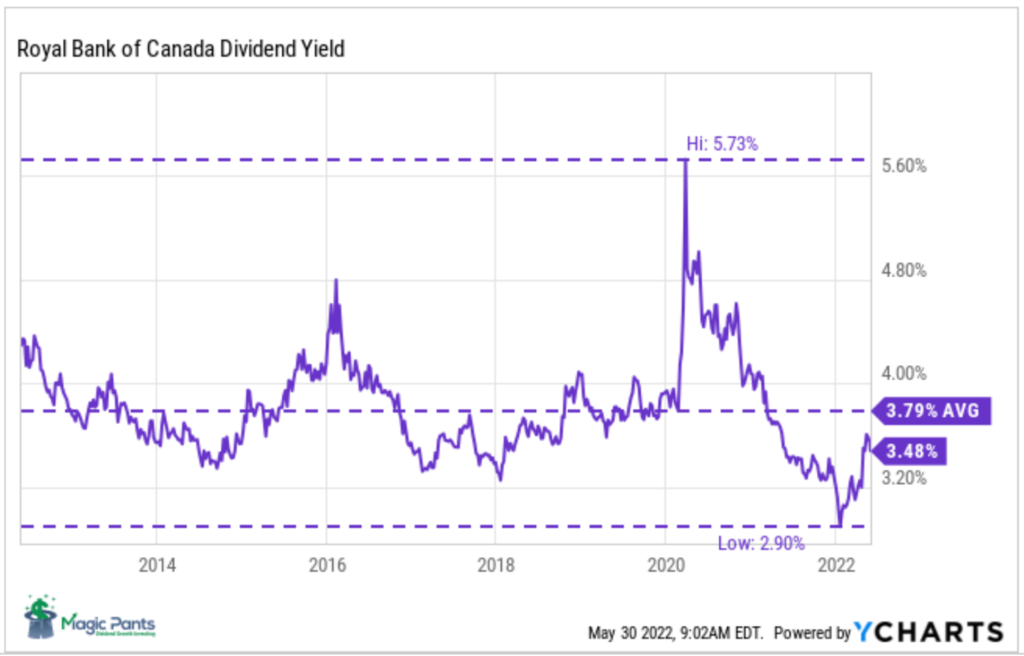
Popularized by Investment Quality Trends (IQT) in the 1960s, ‘Dividend Yield Theory’ is simple and intuitive. It says that for quality dividend growth stocks, meaning those with stable business models that don’t significantly change over time, dividend yields tend to revert to the mean.

In the case of Royal Bank, the dividend is not quite at its average ten-year historical yield of 3.79%. This conveys that RY-T is slightly overvalued based on today’s price. A five-year chart will show similar overvaluation.

Performance Graph:

Source: FASTgraphs

Comments:

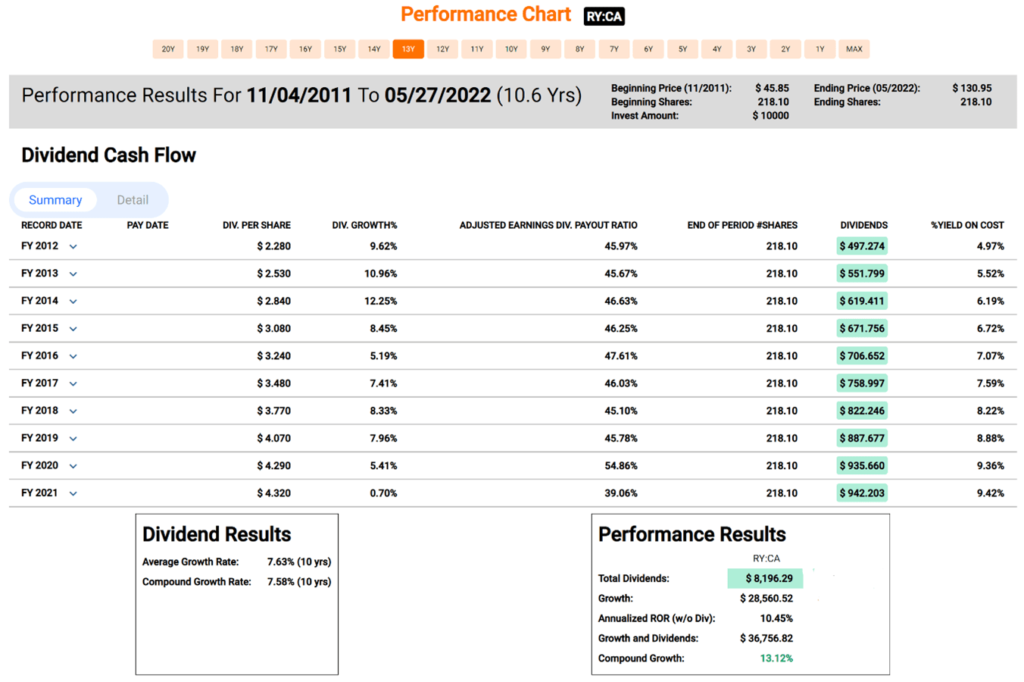
Royal Bank has had an average annualized dividend growth rate of 7.63% over the last ten years. The company also has an annualized total return of 13.12% over that same period. RY-T recently announced a dividend increase of ~7.0%, bringing their 2022 growth rate to 14.8%. This increase helps make up for the restrictions imposed in March of 2020 by regulators not to allow banks and insurers to raise dividends or do share buybacks due to the stimulus provided by the Bank of Canada during the pandemic.

Estimated Earnings:

Estimated Earnings May 2022
Source: FASTgraphs

Comments:

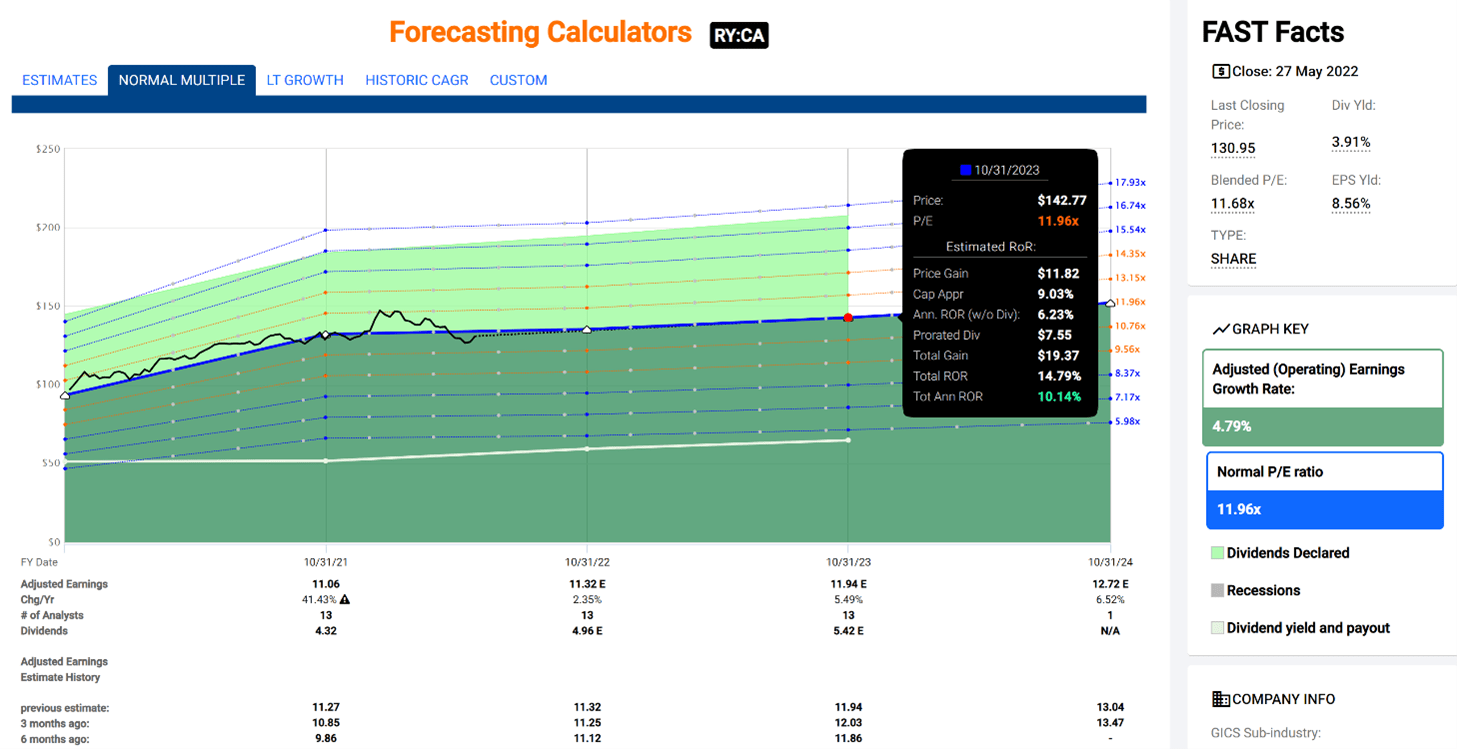
Using the “Normal Multiple’ estimating tool from FASTgraphs, we see a blended P/E average over the last five years of 11.68. Based on Analysts’ forecasts one and a half years out, they are estimating an annualized return, based on today’s price, of 10.14% should RY-T trade at its five-year average blended P/E.

Blended P/E is based upon a weighted average of the most recent actual value and the closest forecast value.

Of importance is that analysts have been revising their estimates for 2023 and beyond downwards recently. This year, analysts do not see a pullback in earnings but are being a bit cautious on earnings growth for RY-T twelve to eighteen months out.

Analyst Scorecard:

Source: FASTgraphs

Comments:

Analyst performance on hitting estimates over the years is above average on one and two-year earnings projections. Analysts’ forecasts have hit or beat ~85% of the time on one-year estimates and ~92% on two-year forecasts.

Recent Earnings Report-Q2 2022:

“The resilience of our diversified business model, prudent risk and capital management, and strategic investments in talent and technology continued to define our performance in the second quarter. We remain well-positioned for future growth, and to deliver differentiated long-term value for our clients, employees and shareholders. At a time when geopolitical tensions, inflationary pressures and global supply chain issues are creating an uncertain macroeconomic backdrop, I’m proud of how RBC employees continue to drive positive change in our communities and deliver trusted advice and insights for those we serve. We will continue to leverage our scale and financial strength, and the powerful combination of our people and culture, to play a leading role in shaping a thoughtful transition to net zero and an inclusive post-pandemic future.”

– Dave McKay, RBC President and Chief Executive Officer

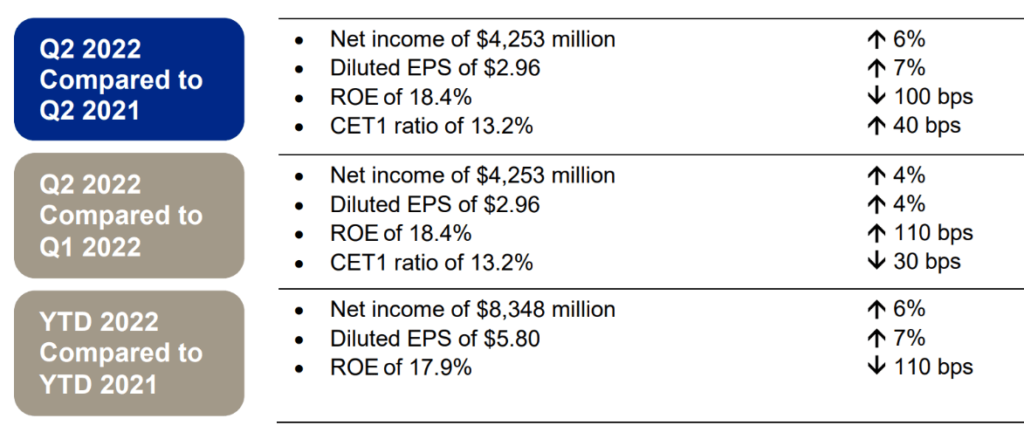
Highlights:

Outlook:

“Inflation has surged higher and unemployment rates have continued to fall, prompting central banks in Canada, the U.S. and the United Kingdom (U.K.) to increase interest rates and to reduce asset holdings. The conflict between Russia and Ukraine has exacerbated global supply chain challenges and pushed key commodity prices higher, intensifying inflationary pressures. The economic impact from the COVID-19 pandemic has eased in most regions with recoveries in travel and hospitality sectors contributing to near-term growth momentum. However, the COVID-19 pandemic continues to impact goods manufacturing and supply, including economic disruptions in China resulting from stringent efforts to control virus spread. Low unemployment and strong demand for workers are driving wages higher. Central banks are expected to continue raising interest rates at the most aggressive pace in decades, which is expected to slow GDP growth later this year and into calendar 2023.

Summary:

Royal Bank is a high-quality Canadian dividend growth stock, as shown by every metric we use to assess quality. Valuation is a little high based on today’s price but not frothy. Rising interest rates are generally suitable for bank stocks, but loan and mortgage defaults are not. Entering a position now is not a terrible idea, but given the volatility of the markets lately, we are hoping for a better entry point.

‘The List’ – Portfolio Review (April 2022)

Posted by BM on April 20, 2022 

Each month we walk through our valuation process using a stock on ‘The List’ that meets our minimum screen of 6.5% EPS Yield. The company we will review today is TFI International (TFII-T).

A fair valuation is the second rule in our three-step process. Buying when our quality stocks are sensibly priced will help ensure our future investment returns meet our expectations. We rely heavily on the fundamental analyzer software tool (FASTgraphs) to help us understand the fundamentals of the stocks we invest in and then read the company’s website for investor presentations and recent earnings reports to learn more.
Intro:

TFI International Inc is a transportation and logistics company located in Canada. The company organizes itself into four segments: package and courier, less-than-truckload, truckload, and logistics. The package and courier segment picks up, transports, and delivers items across North America. The less-than-truckload segment transports smaller loads. The truckload segment transports goods by flatbed trucks, containers, or a more specialized service. The company provides general logistics services through the logistics segment. TFI International derives the majority of revenue domestically, followed by the United States.

Historical Graph:

Historical Graph-TFII
Source: FASTgraphs

Comments:

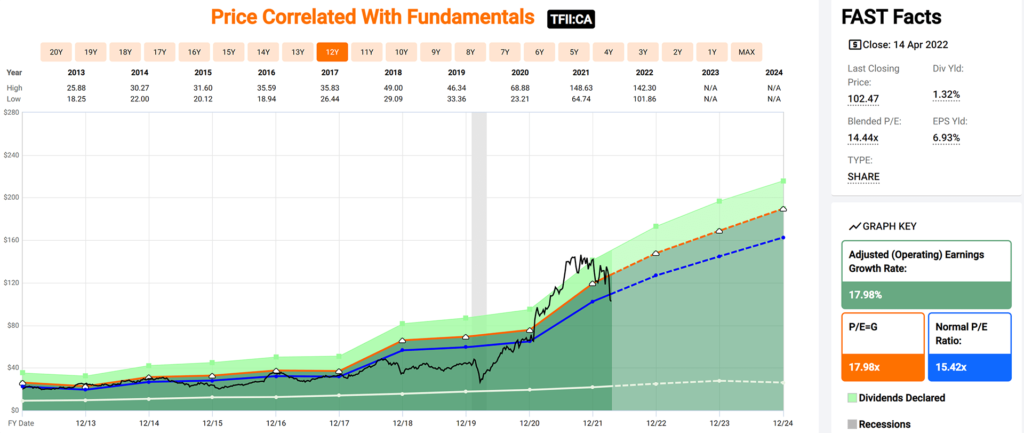
TFI International has a narrow valuation corridor. As you can see from the Blue Line on the graph (Normal P/E) and the Black Line (Price), there seems to be a correlation between Price and P/E. A price below the average P/E line has historically been a good entry point for TFII-T.

The fundamentals show a company whose earnings have grown steadily over the last ten years at an annualized rate of ~17.98%.

Performance Graph:

Source: FASTgraphs

Comments:

TFI International has an annualized dividend growth rate of 9.16% over the last ten years. The company also has an annualized total return of 22.49% over that period. TFII-T recently announced a dividend increase of ~17.4% for 2022 which is almost double their ten-year growth rate.

Estimated Earnings:

Forecast-TFII-min
Source: FASTgraphs

Comments:

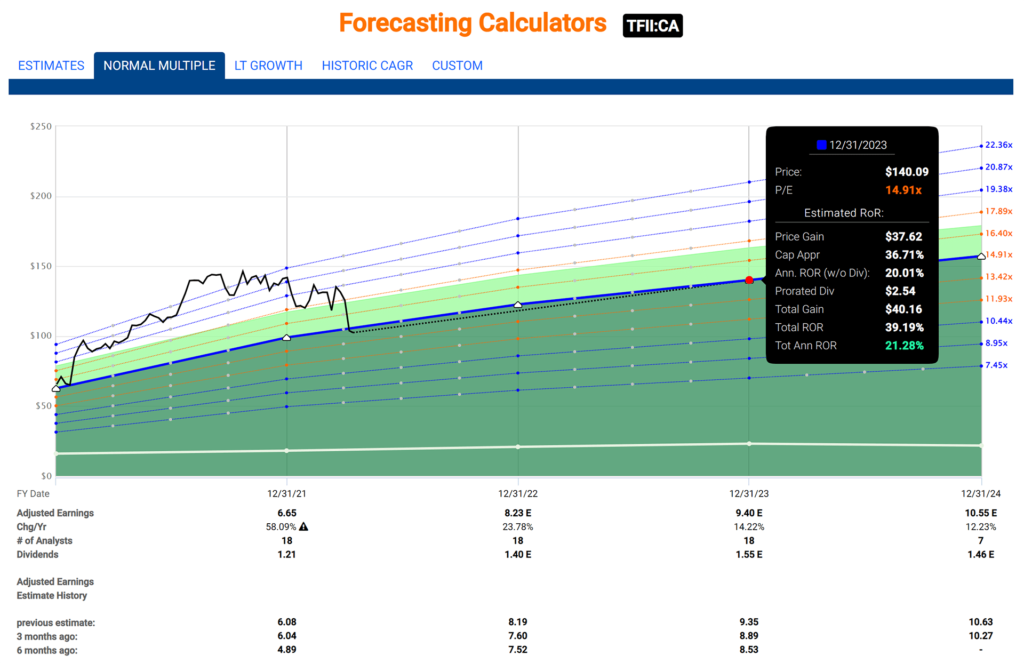
Using the “Normal Multiple’ estimating tool from FASTgraphs, we see a blended P/E average over the last five years of 14.91. Based on Analysts’ forecasts two years out, they are estimating an annualized return, based on today’s price, of 21.28% should TFII-T trade at its five-year average blended P/E.

Blended P/E is based upon a weighted average of the most recent actual value and the closest forecast value.

Of importance is that analysts have been revising their estimates upwards recently. Both the six and three months ago projections for 2022 and 2023 have been increasing. It means that analysts are bullish on TFI International in the short term.

Analyst Scorecard:

Scorecard-TFII
Source: FASTgraphs

Comments:

Analyst performance on hitting estimates over the years are above average on one and two-year earnings projections. Analysts’ projections have hit or beat ~69% of the time on one-year estimates and ~69% on two-year estimates.

Recent Earnings Report-Full Year and Q4 2021:

“TFI International completed a highly successful year that featured our transformational acquisition of UPS Ground Freight, which is already helping to drive our robust financial results reported today. During the fourth quarter, our operating income grew 84% and our adjusted diluted EPS grew 60%,” said Alain Bédard, Chairman, President and Chief Executive Officer. “It is gratifying to see all our business segments delivering year-over-year growth in revenues and operating income, on the tremendous efforts of our thousands of talented team members. By focusing through the pandemic on our longstanding operating principles that emphasize efficiency, strong cash flow, and the strategic allocation of capital, we have entered the new year stronger than ever. I am therefore confident that regardless of operating conditions, our proven approach to the business and the synergies still to come from our rebranded TForce Freight position us well over the long term, for additional growth, superior customer service, and the continued creation of shareholder value.”

Q4 2021 Highlights:

  • Total revenue of $2.14 billion was up 91% and, revenue before fuel surcharge of $1.89 billion was up 80% compared to the prior year period.
  • Operating income grew 84% to $215.0 million from $117.1 million the prior year period, primarily driven by acquisitions, strong execution across the organization, increased quality of revenue, an asset-right approach, and cost efficiencies.
  • Net income grew 67% to $144.1 million from $86.3 million the prior year period, and net income of $1.52 per diluted share was up relative to $0.91 the prior year period. Adjusted net income, a non-IFRS measure, was $148.6 million, or $1.57 per diluted
  • share, as compared to $93.4 million, or $0.98 per diluted share, the prior year period.
  • Total revenue grew for all segments relative to the prior year period with increases of 6% for Package and Courier, 509% for Less-Than-Truckload, 22% for Truckload and 35% for Logistics. Operating income was also higher across all segments in thefourth quarter in comparison to the prior-year.

Full Year 2021 Highlights:

  • Total revenue was $7.22 billion for 2021 versus $3.78 billion in 2020. Revenue before fuel surcharge of $6.47 billion was up 86% compared to the prior year.
  • Operating income totaled $889.2 million, or 14% of revenue before fuel surcharge, an increase of 113% compared to $416.6 million and 12% of revenue before fuel surcharge in the prior year. The increase is mainly attributable to the contributions from acquisitions, including a bargain purchase gain of $193.5 million, and despite a decrease in the Canadian Emergency Wage Subsidy of $40.0 million and an expense recognized on the mark-to-market of the DSUs of $22.9 million.
  • Net income was $664.4 million, or $6.97 per diluted share, compared to $275.7 million, or $3.03 per diluted share a year earlier. Adjusted net income and Adjusted EPS, non-IFRS measures, were $498.3 million, or $5.23 per diluted share, compared to $299.8 million, or $3.30 per diluted share the prior year period.
  • During 2021, total revenue grew 21% for Package and Courier, 378% for Less-Than-Truckload, 24% for Truckload and 76% for Logistics relative to the prior year. Operating income was up 38% for Package and Courier, 449% for Less-Than-Truckload, 12% for Truckload and 69% for Logistics.

Summary:

TFI International (TFII-T) was a known entity to me when I worked in the technology sector. One of our target markets was the trucking industry. TFI International was acquiring our customers and prospects at a rapid pace, and they seemed to integrate their acquisitions very well. As an investor, they first came on our radar in 2020 when we noticed that they were knocking on the door of becoming a DGI candidate and meeting our ten-year dividend growth streak criteria. We were fortunate to initiate a position at that time and ride the ecommerce wave over the next few years. During that time, TFI International continued to acquire and integrate, growing their earnings at an even faster rate. It has only been recently that the company’s fundamentals and stock price came back in alignment.

Coming off an amazing 2021 with an over 100% return on its stock price, it was only a matter of time until TFII-T’s P/E came back closer to its historical average. As of last Thursday, the company’s stock price was down ~-27% YTD bringing its P/E down below its ten-year average.

Trucking likes high growth and high inflation economies both of which are under pressure currently. Short term investors looking to initiate or add to their positions must be aware that both growth and inflation rates of change are decelerating which means there may be more bad news to come for this sector. Longer term investors are watching carefully. Based on the fundamentals alone, the company appears ‘sensibly priced’ today.

‘The List’ – Portfolio Review (March 2022)

Posted by BM on March 23, 2022 

Each month we walk through our valuation process using a stock on ‘The List’ that meets our minimum screen of 6.5% EPS Yield. With many of our good dividend growers still not in our ‘sensible price’ range, we sometimes go looking outside of ‘The List’ for candidates. The company we will review today is Manulife Financial (MFC-T).

Valuation is the second step in our three-step process. Buying when our quality stocks are sensibly priced will help ensure our future investment returns meet our expectations. We rely heavily on the fundamental analyzer software tool (FASTgraphs) to help us understand the fundamentals of the stocks we invest in and then read the company’s website for investor presentations and recent earnings reports to learn more.

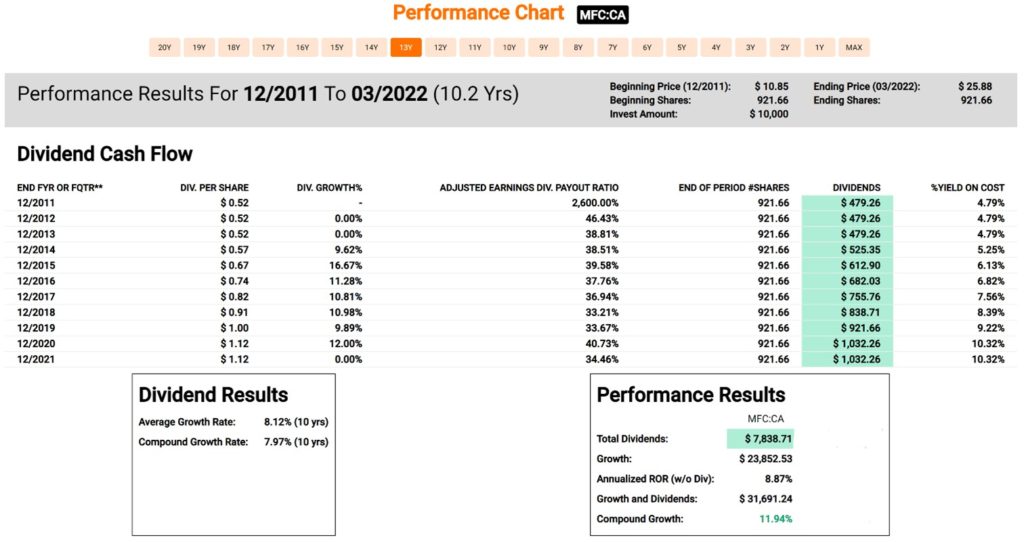
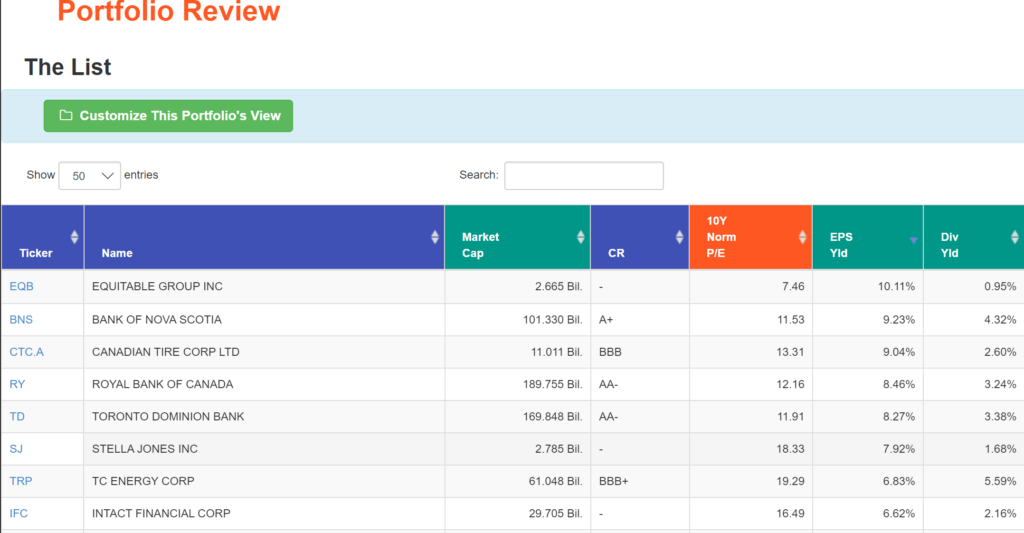
MFC-T has a dividend streak of eight years. We have added MFC-T to our screen to demonstrate where it sits from a valuation perspective. As you can see, it would be at the top of our list if it was on the 2022 List.

Intro:

Manulife was founded in 1887 in Toronto, Canada (“The Manufacturers Life Insurance Company” by Act of Parliament on 23 June 1887). Manulife provides life insurance and wealth management products and services to individuals and group customers in Canada, the United States, and Asia. Manulife is one of Canada’s Big Three Life Insurance companies (the other two are Sun Life and Great-West Life).

It’s the third-largest insurance company in Canada and the seventh-largest publicly-traded insurance company on earth. But it’s also highly diversified globally.

  • Asia 48% of operating income
  • US 21%
  • Canada 20%
  • Other 11%

Historical Graph:

MFC Fundamentals
Source: FASTgraphs

Comments:

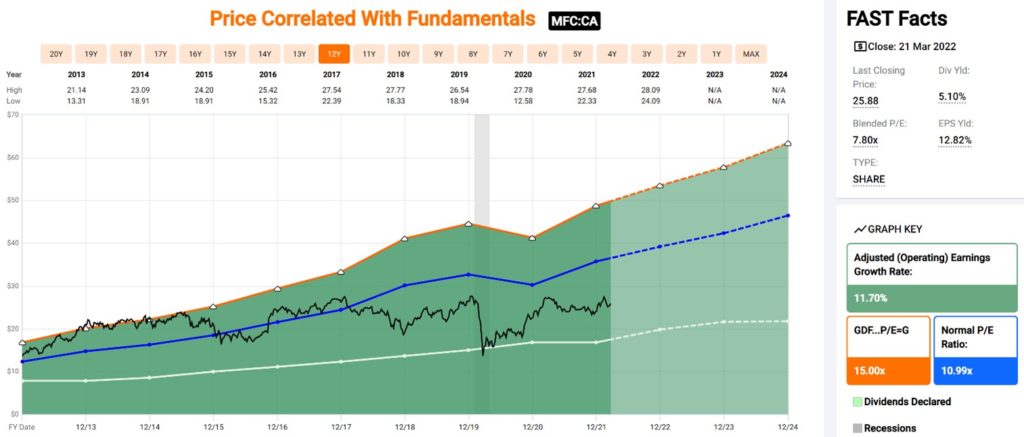
Manulife Financial has a narrow valuation corridor. As you can see from the Blue Line on the graph (Normal P/E) and the Black Line (Price), there seems to be a correlation between Price and P/E. You would be wise to invest in MFC-T when it is below its average P/E of 10.99.

The fundamentals show a company whose earnings have grown steadily over the last ten years at an annualized rate of ~11.70%. This is rare for a company to have double digit earnings growth and such a high starting yield (5.1%).

Performance Graph:

MFC Performance Chart
Source: FASTgraphs

Comments:

Manulife Financial has an annualized dividend growth rate of 7.97% over the last ten years. The company also has an annualized Total Return of 11.94% over that period. MFC-T recently announced a dividend increase of ~18.0% for 2022 which is more than double their ten-year growth rate. Manulife has been a terrific investment over the last decade, especially as an income holding, with investors in 2012 now generating a 10.32% return on their initial investment from dividends alone.

Estimated Earnings:

MFC Forecasting Calculators
Source: FASTgraphs

Comments:

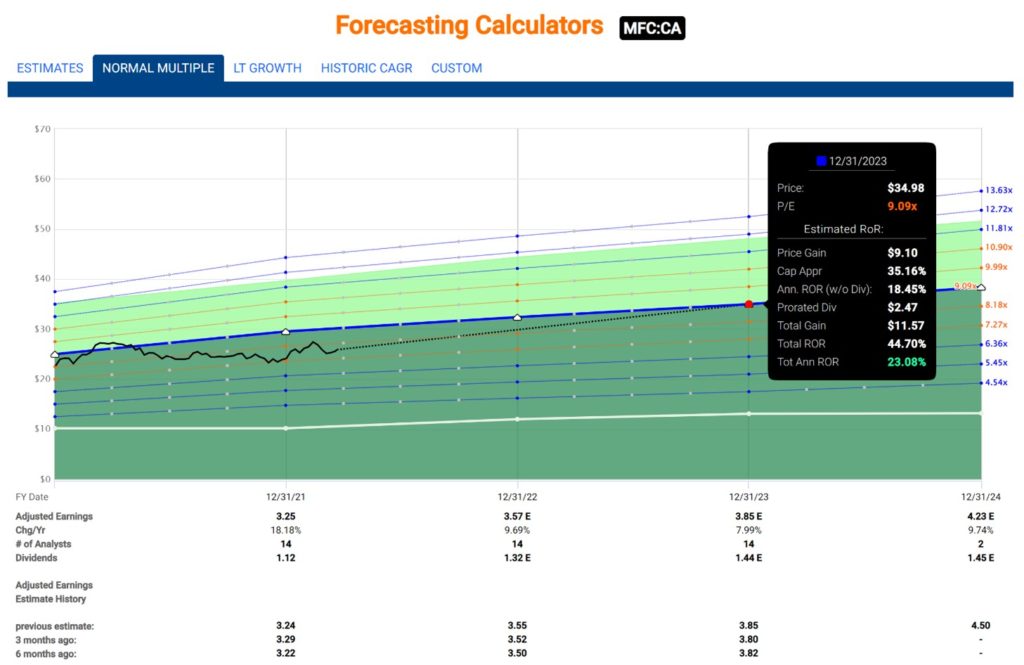
Using the “Normal Multiple’ estimating tool from FASTgraphs, we see a blended P/E average over the last five years of 9.09. Based on Analysts’ forecasts two years out, you can expect an annualized return based on today’s price of 23.08% should MFC-T trade at its five-year average blended P/E.

Blended P/E is based upon a weighted average of the most recent actual value and the closest forecast value.

Of importance is that Analysts have been revising their estimates upwards recently. Both the six and three months ago projections for 2022 and 2023 have been increasing. It means that Analysts are more bullish on Manulife Financial in the short term.

Analyst Scorecard:

Source: FASTgraphs

Comments:

Analyst estimates over the years are slightly above average on one and two-year earnings projections. Analysts’ projections have hit or beat ~62% of the time on one-year estimates and ~69% on two-year estimates.

Recent Earnings Report-Q4 2021:

“Our ability to adapt and serve clients across the globe who are navigating a very uncertain environment continues to drive our operating results with record net income of $7.1 billion and core earnings of $6.5 billion in 2021 driven by our insurance businesses delivering double-digit growth in APE sales and NBV and Global WAM delivering strong net inflows of $27.9 billion,” said Manulife President & Chief Executive Officer Roy Gori.

Highlights:

  • Net income attributed to shareholders of $7.1 billion in 2021, up $1.2 billion from 2020, and $2.1 billion in 4Q21, up $304 million from the fourth quarter of 2020 (“4Q20”)
  • Core earnings of $6.5 billion in 2021, up 26% on a constant exchange rate basis from 2020, and $1.7 billion in 4Q21, up 20% on a constant exchange rate basis from 4Q202
  • Strong LICAT ratio of 142%
  • Core ROE of 13.0% in 2021 and 12.7% in 4Q21, and ROE of 14.2% in 2021 and 15.6% in 4Q21
  • NBV of $2.2 billion in 2021, up 31% from 2020, and $555 million in 4Q21, up 17% from 4Q20
  • APE sales of $6.1 billion in 2021, up 13% from 2020, and $1.4 billion in 4Q21, up 5% from 4Q20
  • Global Wealth and Asset Management (“Global WAM”) net inflows of $27.9 billion in 2021 compared with net inflows of $8.9 billion in 2020 and net inflows of $8.1 billion in 4Q21 compared with net inflows of $2.8 billion in 4Q20. A record year for our retail wealth business with net inflows of $29.2 billion
  • Global WAM average AUMA increased by 20% in 2021
  • Remittances were $4.4 billion in 2021 compared with $1.6 billion in 2020, an increase of $2.8 billion
  • Quarterly common share dividend increased by 18% in 4Q21
  • Launched a Normal Course Issuer Bid (“NCIB”) that permits repurchase of up to 5% of outstanding common

Summary:

When I first started dividend growth investing, my mentor Tom Connolly made a point of staying away from life insurance companies due to their sub-par dividend growth. I agreed and have not looked at life insurance companies until now. Manulife Financials’ (MFC-T) balance sheet and risk-management look nothing like the company that had to cut its dividend twice during the Great Recession.

MFC-T’s fundamentals look good, and it has been growing earnings since 2016. Throw in a recent 18% dividend increase, an S&P Quality Financial ‘A’ rating, and we like what we see from this up and coming dividend grower. On the macro side, high inflation tends to cause rising interest rates and that’s a boon to financial blue chips like Manulife Financial.

Based on the fundamentals alone, the company seems ‘sensibly priced’ today.

‘The List’ – Portfolio Review (February 2022)

Posted by BM on February 28, 2022 

Each month we walk through our valuation process using a stock on ‘The List’ that meets our minimum screen of 6.5% EPS Yield. This month it is Magna International (MG-T).

Valuation is the second step in our three-step process. Buying when our quality stocks are sensibly priced will help ensure our future investment returns meet our expectations. We rely heavily on the fundamental analyzer software tool (FASTgraphs) to help us understand the fundamentals of the stocks we invest in and then read the company’s website for investor presentations and recent earnings reports to learn more.

Intro:

Magna is more than one of the world’s largest suppliers in the automotive space. They are a mobility technology company with a global, entrepreneurial-minded team of over 158,000 employees and an organizational structure designed to innovate like a startup.

With 60+ years of expertise, and a systems approach to design, engineering and manufacturing that touches nearly every aspect of the vehicle, they are positioned to support advancing mobility in a transforming industry. Thier global network includes 343 manufacturing operations and 91 product development, engineering and sales centres spanning 28 countries. Roughly half of Magna’s revenue comes from North America while Europe accounts for approximately 44% 

Historical Graph:

Source: FASTgraphs

Comments:

Magna International has a slightly wider valuation corridor than some of our other dividend growers. As you can see from the Blue Line on the graph (Normal P/E) and the Black Line (Price), there has been quite a swing in valuation recently. A company that traded below a 10 P/E for most of the last decade has now traded at more than a 22 P/E (almost twice its average) as recently as June of 2021.

The fundamentals show a company whose earnings have grown steadily over the last ten years at an annualized rate of ~14.36%. One other thing of note is that with Magna’s transformation into an EV company, Analysts are predicting an uptick in earnings growth out until the end of 2024 at a much higher growth rate (~28%).

Performance Graph:

Magna International Performance Chart
Source: FASTgraphs

Comments:

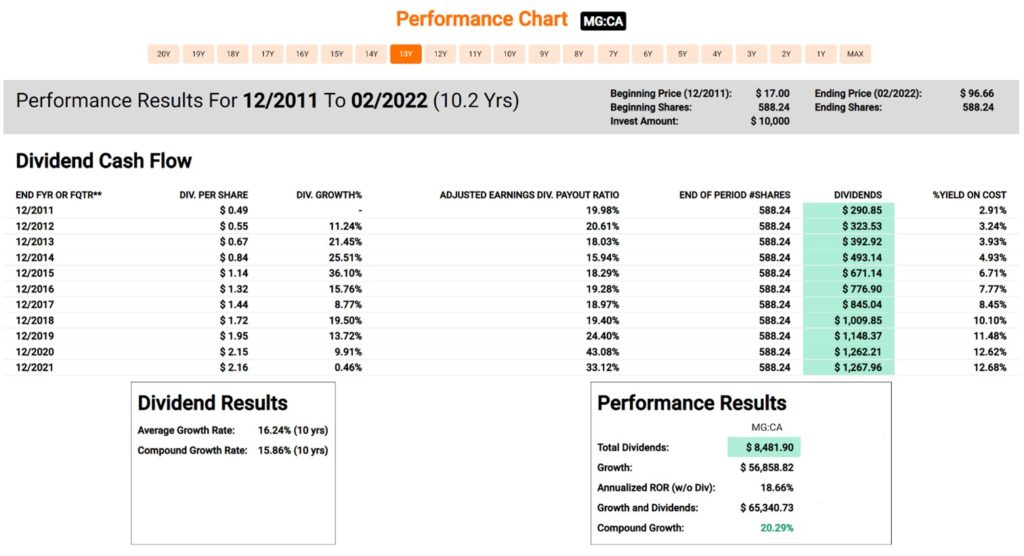
Magna International has an annualized dividend growth rate of 15.86% over the last ten years. The company also has an annualized Total Return of 20.29% over that time period. MG-T recently announced a dividend increase of ~5.0% for 2022 which is about half of last year’s increase. Magna has been a terrific investment over the last decade both from a capital and income growth perspective.

Estimated Earnings:

Magna International Forecasting Calculators
Source: FASTgraphs

Comments:

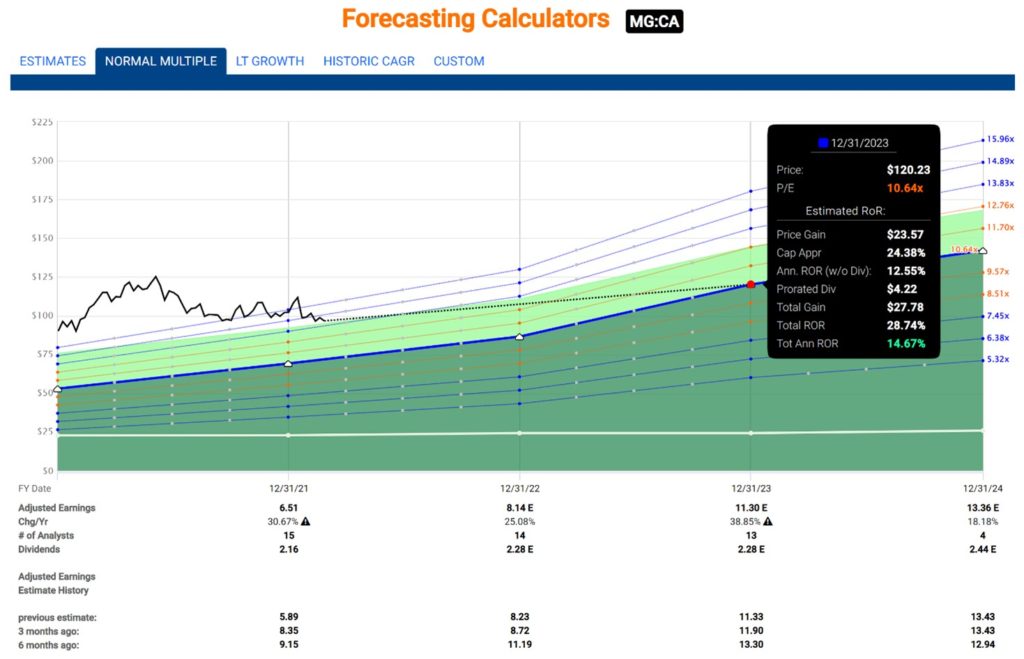
Using the “Normal Multiple’ estimating tool from FASTgraphs, we see a blended P/E average over the last five years of 10.64. Based on Analysts’ forecasts two years out, you can expect an annualized return based on today’s price of 14.67% should MG-T trade at its five-year average blended P/E.

Blended P/E is based upon a weighted average of the most recent actual value and the closest forecast value.

Of importance is that Analysts have been revising their estimates downwards recently. Both the six and three months ago projections for 2022 and 2023 have been dropping. It means that Analysts are more bearish on Magna in the short term.

Analyst Scorecard:

Magna International Analyst Scorecard
Source: FASTgraphs

Comments:

Analyst estimates over the years are fairly accurate based on one and two-year earnings projections. Analysts’ projections have hit or beat ~70% of the time on one-year estimates and ~76% on two-year estimates.

Recent Earnings Report-Q4 2021:

“Although 2021 presented its share of challenges, we delivered above-market sales growth and generated solid free cash flow, as we worked closely with our customers and suppliers to minimize the impacts on vehicle production. Despite significant input cost headwinds, we expect improved operating results in 2022 as the industry recovers and production schedules normalize. In addition, we remain confident in our ability to capitalize on the opportunities in front of us, especially in the areas of electrification, autonomy and new mobility.”

– Swamy Kotagiri, Magna’s Chief Executive Officer

Highlights

Fourth Quarter 2021 Highlights

  • Sales of $9.1 billion decreased 14%, compared to a 17% decrease in global light vehicle production
  • Diluted earnings per share and adjusted diluted earnings per share of $1.54 and $1.30, respectively, compared to $2.45 and $2.83 last year
  • Returned $378 million to shareholders through share repurchases and dividends
  • Raised quarterly cash dividend by 5% to $0.45 per share

Full Year 2021 Highlights

  • Sales of $36.2 billion increased 11%, compared to global vehicle production which increased 4%
  • Diluted earnings per share and adjusted diluted earnings per share of $5.00 and $5.13, respectively, compared to $2.52 and $3.95 last year
  • Returned over $1 billion to shareholders through share repurchases and dividends

Summary:

Input cost increases due to inflation and the semi-conductor crisis have and will continue to affect Magna’s fundamentals in the short run. A belief in the ability of central banks to manage inflation through interest rate hikes and an improvement in the chip shortage situation in the coming year, will be required to see Magna’s fundamentals improve in 2022. Looking further ahead, the company is well positioned to take advantage of growth opportunities as the auto industry undergoes significant transformation.

When we have purchased Magna shares in the past (MP Wealth-Builder CDN Portfolio), it was always when the P/E was below 8. Although those days may be behind us now, we would like to see a further pullback in the share price or at the very least a clear indication that some of the operational headwinds they experienced in 2021 are now behind them. Like most investors right now, we are waiting for a better entry point.

‘The List’ – Portfolio Review (January 2022)

Posted by BM on January 31, 2022 

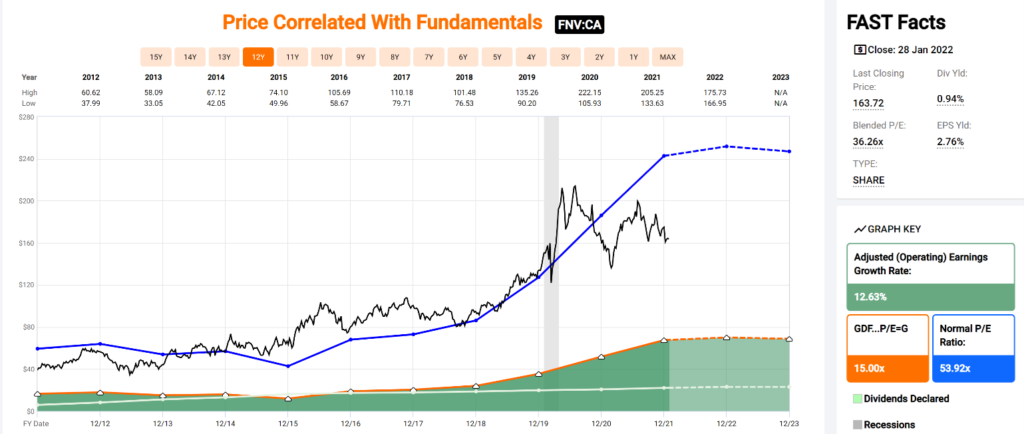
Each month we walk through our valuation process using a stock on ‘The List’ that meets our minimum screen of 6.5% EPS Yld. This month is a little different as we have already reported on companies, in previous reviews, that meet this criterion and there are no new companies to add. There is however one company on ‘The List’ that is valued differently and has recently come into what we would call a ‘sensible price’ range based on its own unique historical valuation pattern. That stock is Franco Nevada Corporation (FNV-T)

Valuation is the second step in our three-step process. Buying when our quality stocks are sensibly priced will help ensure our future investment returns meet our expectations. We rely heavily on the fundamental analyzer software tool (FASTgraphs) to help us understand the fundamentals of the stocks we invest in and then read the company’s website for investor presentations and recent earnings reports to learn more.

Intro:

Franco-Nevada Corp is a precious-metals-focused royalty and investment company. The company owns a diversified portfolio of precious metals and royalty streams, which is actively managed to generate the bulk of its revenue from gold, silver, and platinum. The company does not operate mines, develop projects, or conduct exploration. Franco-Nevada’s short-term financial performance is linked to the price of commodities and the amount of production from its portfolio of producing assets. Its long-term performance is affected by the availability of exploration and development capital. The company holds a portfolio of assets, diversified by commodity, revenue type, and stage of a project, primarily located in the United States, Canada, and Australia.

Historical Graph:

FNV Historical Graph
Source: FASTgraphs

Comments:

Franco Nevada Corp. is another of our good dividend growers that trades within a narrow valuation corridor. As you can see from the Blue Line on the graph (Normal P/E) and the Black Line (Price), there is typically very little variance. Investment opportunities typically occur when the Black Line falls below the Blue Line (53.9 PE) with this quality dividend grower. The fundamentals show a company whose earnings have grown steadily over the last ten years at an annualized rate of ~12.63%.

Performance Graph:

FNV Performance Graph
Source: FASTgraphs

Comments:

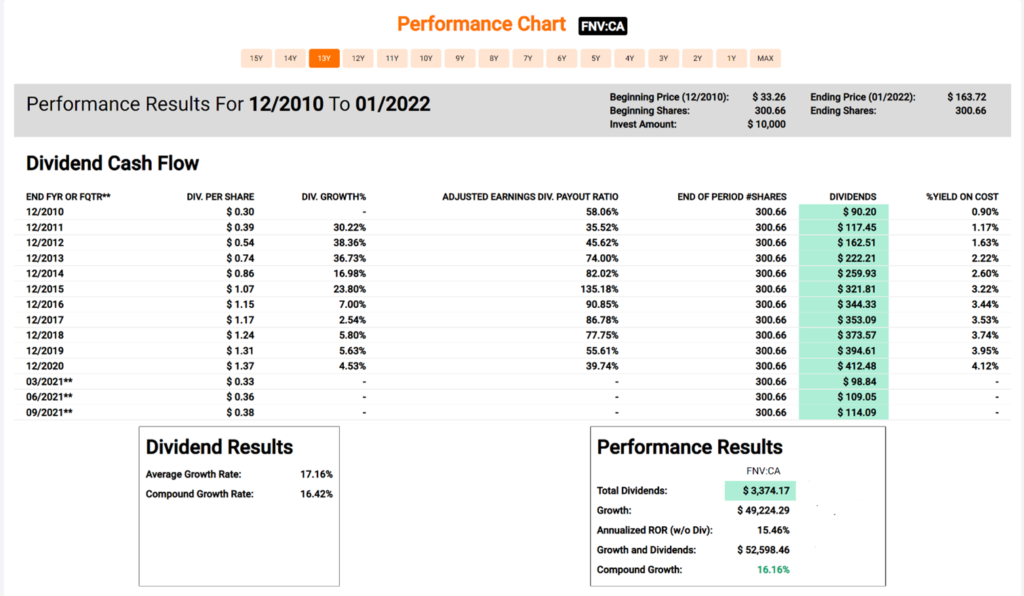
Franco Nevada Corp. has an annualized dividend growth rate of 16.42% over the last decade but growth has slowed over the last five years. The company also has an annualized Total Return of 16.16% over that time. FNV-T recently announced another dividend increase of 6.7% for 2022 which is more in line with the recent past.

Estimated Earnings:

Source: FASTgraphs

Comments:

Using the “Normal Multiple’ estimating tool from FASTgraphs, we see a blended P/E average over the last five years of 63.66. Based on Analysts’ forecasts two years out, you can expect an annualized return of 35.75% should FNV-T trade at its five-year average blended P/E.

Blended P/E is based upon a weighted average of the most recent actual value and the closest forecast value.

Another thing I like about Franco Nevada Corp.’s earnings is that they are being revised upwards from both six months and three months ago for both 2022 and 2023. Analysts seem bullish on FNV-T in the short term.

Analyst Scorecard:

FNV Analyst Scorecard
Source: FASTgraphs

Comments:

Analyst estimates over the years are fairly accurate based on one and two-year earnings projections. Analysts’ projections have hit or beat 75% of the time on one-year estimates and 71% on two-year estimates.

Recent Earnings Report-Q3 2021:

Franco-Nevada Reports Strong Q3 Results; 2021 Energy Guidance Increased

Highlights

“Franco-Nevada delivered a strong third quarter, setting the stage for a record year in 2021. Our diversified portfolio continues to serve us well with strong contributions during the quarter from precious metals, energy and iron ore,” stated Paul Brink, President & CEO. “Higher energy prices have led us to increase our 2021 Energy guidance for the second time this year. Margins have moved higher this year due to the inflation-protected nature of our business model. Franco-Nevada is debt-free and is growing its cash balances.”

Strong Financial Position

  • No debt and $1.6 billion in available capital as of September 30, 2021
  • Generated $206.9 million in operating cash flow for the quarter
  • Quarterly dividend of $0.30/share

Sector-Leading ESG

  • Ranked #1 gold company by Sustainalytics, AA by MSCI and Prime by ISS ESG
  • Committed to the World Gold Council’s “Responsible Gold Mining Principles”
  • Partnering with our operators on community and ESG initiatives
  • Goal of 40% diverse representation at the Board and top leadership levels

Diverse, Long-Life Portfolio

  • Most diverse royalty and streaming portfolio by asset, operator, and country
  • Core assets outperforming since time of acquisition
  • Growth in long-life reserves

Growth and Optionality

  • Acquisitions, mine expansions and new mines driving growth
  • 1-million-ounce increase in Measured and Indicated Mineral Resources at Detour Lake
  • Long-term options in gold, copper and nickel
  • Noront consolidation likely to accelerate development of Ring of Fire properties

Summary:

Franco Nevada Corp. is one of only two companies in our ‘Double-Double Club’ and has been a stellar performer from a total return perspective for many years now. Although Franco Nevada is weighted heavily in the gold sector, it has been much more stable than the price of gold has been. Those of us who follow macro investing believe that gold may have its day again soon and FNV-T is an excellent way to benefit. The current yield is low at ~1% but growth is acceptable and if you believe that gold is a currency you want exposure to, then you will want to look closely at adding FNV-T to your dividend growth portfolio.

Franco Nevada Corp. appears to be sensibly priced based on historical metrics. It is well below its blended P/E at this point. Both its forecasted earnings growth and dividend growth appear to be trending along recent historical norms. Throw in a recent dividend increase (14 years and counting) and there is a lot to like about FNV-T.   

Q4 2021 Earnings Calendar-Intro

Posted by JM on January 21, 2021 

Benjamin Graham once remarked that earnings are the principal factor driving stock prices.

Each quarter we will provide readers with weekly earnings updates of stocks on ‘The List’ during the calendar earnings season. Q4 2021 has now ended, and companies are now beginning to report.

Earnings growth and dividend growth tend to go hand in hand so this information can tell us a lot about future dividend growth of our quality companies. Monitoring our dividend growers periodically is part of the process and reading the quarterly earnings releases is a good place to start.

Some of our dividend growers from ‘The List’ have reported quarterly earnings already, based on their fiscal year, with the majority of Q4 2021 earnings scheduled to report in February 2022.

The complete chart can be found below the updated List by selecting ‘The List’ menu item at the top of the site home page.

Q4 Estimates and Results:

SYMBOL COMPANY DATE ESTIMATE RESULT
ATD-B-T Alimentation Couche-Tard Inc. 23-Nov $0.65 $0.65 0.0%
RY-T Royal Bank of Canada 1-Dec $2.81 $2.71 -3.6%
TD-T TD Bank 2-Dec $1.96 $2.09 6.6%
DOL-T Dollarama Inc. 8-Dec $0.57 $0.61 7.0%
ENGH-T Enghouse Systems Limited 15-Dec $0.44 $0.54 22.7%

Although most companies on ‘The List’ will probably exceed earnings expectations once again in Q4, macro investors are predicting a slow down in the rate of change of earnings growth in 2022. This will impact valuations and put downward pressure on prices. With very few of our quality dividend growers currently in their ‘sensible’ price range, we are waiting patiently for an opportunity soon to add to our positions.

‘The List’ – Portfolio Review (December 2021)

Posted by BM on December 22, 2021 

Each month I will walk through our valuation process using a stock on ‘The List’ that meets our minimum screen of 6.5% EPS Yld. This month it is Intact Financial Corp. (IFC-T).

Valuation is the second step in our three-step process. Buying when our quality stocks are sensibly priced will help ensure our future investment returns meet our expectations. We rely heavily on the fundamental analyzer software tool (FASTgraphs) to help us understand the fundamentals of the stocks we invest in and then read the company’s website for investor presentations and recent earnings reports to learn more.

Intro:

Intact Financial Corporation (IFC-T) is the largest provider of property and casualty (P&C) insurance in Canada, a leading provider of global specialty insurance, and, with RSA, a leader in the U.K. and Ireland. The business has grown organically and through acquisitions to over $20 billion of total annual premiums.

In Canada, Intact distributes insurance under the Intact Insurance brand through a wide network of brokers, including its wholly-owned subsidiary BrokerLink, and directly to consumers through Belairdirect. Intact also provides affinity insurance solutions through the Johnson Affinity Groups.

In the U.S., Intact Insurance Specialty Solutions provides a range of specialty insurance products and services through independent agencies, regional and national brokers, and wholesalers and managing general agencies.

Outside of North America, the Company provides personal, commercial and specialty insurance solutions acro ss the U.K., Ireland, Europe and the Middle East through the RSA brands.

Intact directly manages its investments through subsidiary Intact Investment Management. Most of these invested assets are fixed-income securities. Its asset mix is designed to generate interest and dividend income.

Historical Graph:

ifct price correlated with fundamentals 2021
Source: FASTgraphs

Comments:

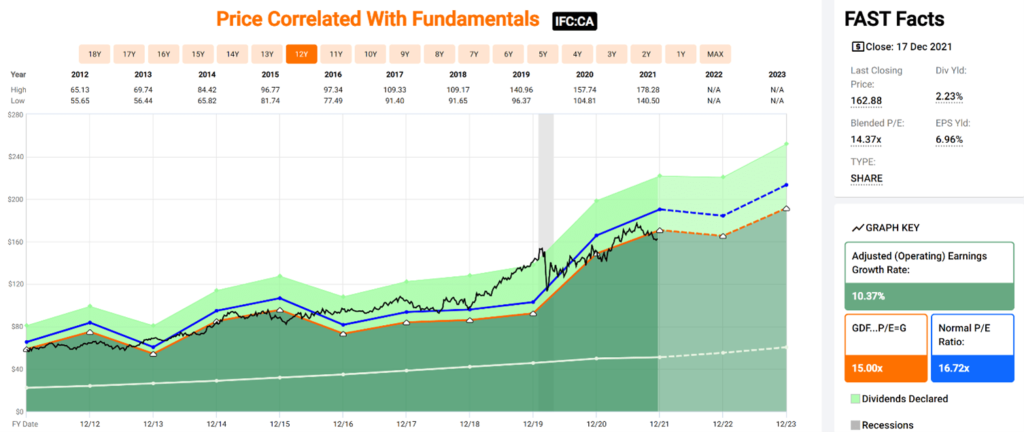
Intact Financial Corp. is another of our good dividend growers that trades within a narrow valuation corridor. As you can see from the Blue Line on the graph (Normal P/E) and the Black Line (Price), there is typically very little variance. Investment opportunities occur when the Black Line falls below the Orange Line (15 PE) with this quality dividend grower. The fundamentals show a company whose earnings have grown steadily over the last ten years at an annualized rate of ~10%.

Performance Graph:

Source: FASTgraphs

Comments:

Intact Financial Corp. has an annualized dividend growth rate of 9.34% over the last decade. The company also has an annualized Total Return of 12.70% over that time. IFC-T recently announced another dividend increase of 9.64% for 2022.

Estimated Earnings:

ifct estimated earnings
Source: FASTgraphs

Comments:

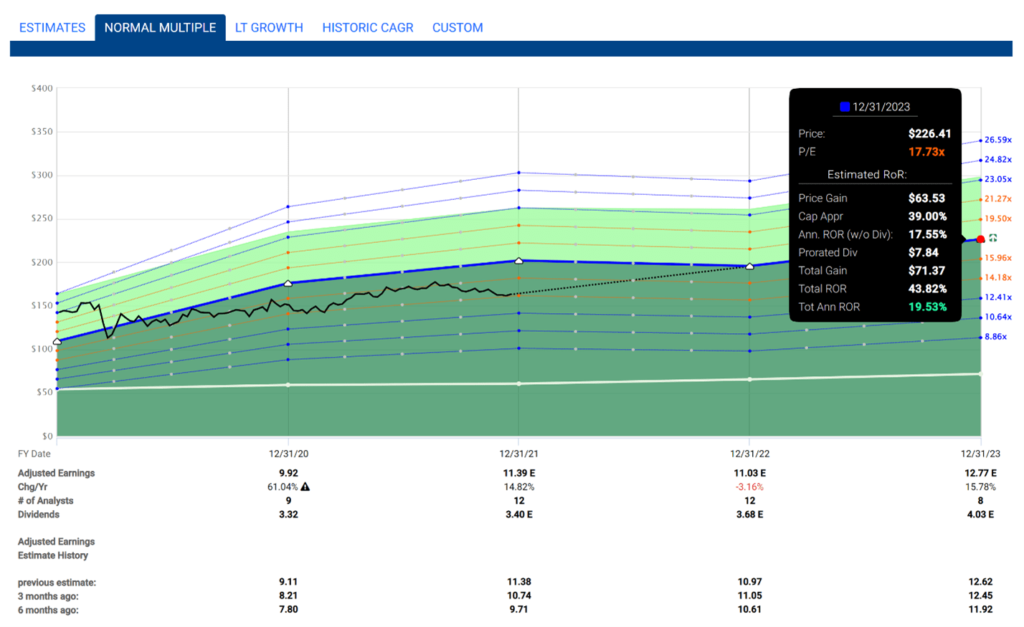
Using the “Normal Multiple’ estimating tool from FASTgraphs, we see a blended P/E average over the last five years of 17.73. Based on Analysts’ forecasts two years out, you can expect an annualized return based on today’s price of 19.53% should IFC-T trade at its blended P/E.

Blended P/E is based upon a weighted average of the most recent actual value and the closest forecast value.

Another thing I like about Intact Financial Corp.’s earnings is that they are being revised upwards from both six months and three months ago for both 2022 and 2023. Analysts seem bullish on IFC-T in the short term.

Analyst Scorecard:

Source: FASTgraphs

Comments:

Analyst estimates over the years are not very accurate based on one and two-year earnings projections. Analysts’ projections have hit or beat 33% of the time on one-year estimates and 45% on two-year estimates. This does not give us a lot of confidence on estimating the future with Intact Financial Corp.’s earnings. Monitoring quarterly earnings reports will give us a better idea on where things are headed.

Recent Earnings Report-Q3 2021:

Highlights

  • Net operating income per share of $2.87 driven by strong underwriting performance and an accretive contribution from RSA
  • Premiums grew 68%, reflecting the first full quarter of RSA in our results and continued strength in commercial lines
  • Combined ratio of 91.3%, driven by strength in all business segments despite an elevated 7.5 pts of catastrophe losses
  • OROE of 18.3% with a total capital margin of $2.7 billion
  • EPS of $1.60 reflects strong operating results tempered by an investment loss and integration costs
  • Quarterly dividend increased by 10% to $0.91 per common share

Charles Brindamour, Chief Executive Officer, said:

“The strength of our business was again evident this quarter, with robust operating performance across the platform, despite an elevated level of catastrophes. Our people have worked hard to get customers back on track following many severe weather events. We are making great progress on the integration of RSA, with synergies being realized as expected. The acquisition is already delivering high single-digit accretion to NOIPS since closing on June 1, and we remain on track to generate upper teens accretion within 36 months. With a strong and resilient balance sheet and momentum in all segments, we are increasing dividends to our common shareholders for the sixteenth consecutive year.”

UBS Keeps Buy Rating, $187 Target Price on Intact Financial, Ups EPS Estimates

01:22 PM EST, 11/30/2021 (MT Newswires) — UBS has kept its 12-month Buy rating and $187 TP on Intact Financial Corporation. 2021 EPS estimate goes to $11.42 from $10.11 to reflect stronger underlying results and distribution income, stronger RSA results, and a lower personal auto underlying loss ratio, partially offset by lower growth in personal auto. 2022 EPS estimate goes to $11.30 from $10.90 on stronger RSA results, partially offset by lower personal auto growth. 2023 estimate is also increasing to $12.91 from $12.44.

Summary:

Intact Financial Corp. appears to be sensibly priced based on historical metrics. Both its forecasted earnings growth and dividend growth appear to be trending along historical norms as well (~10%). Throw in a recent dividend increase (16 years and counting) and there is a lot to like about IFC-T. The company seems to be integrating its newest acquisition, RSA, quite well which will help improve the bottom line. Incrementally buying when the price gets below a 15 P/E has worked well over the last decade with this dividend grower.

Q3 2021 Earnings Calendar

Posted by JM on November 22, 2021 

Earnings are in! 

As part of our process, we monitor earnings releases to make sure our good dividend growers are continuing to grow their earnings and that management continues to provide positive guidance going forward. See full earnings calendar at the bottom of the post.

As expected, Q3 was another good quarter for the stocks on ‘The List’ with twenty one of our twenty-seven stocks meeting or exceeding Analyst expectations.

Beats:

Brookfield Infrastructure Partners (BIP-N) was our big winner again due to earnings contributions from a recent acquisition (Inter Pipeline) and the sale of a US district energy operation which closed in July.

Intact Financial (IFC-T) was also up significantly, exceeding estimates by over 50%. This was primarily due to the additional earnings provided by the RSA Insurance Group acquisition in June of this year.

“RSA contributed 8% accretion to Q3-2021 NOIPS, bringing accretion to 9% for the four-month period since closing. Given the overall strength of Intact’s results, immediate high single-digit accretion is evidence of the quality of the acquired portfolio. We have increased confidence in achieving our target of high single-digit accretion in the first 12 months and upper teens within 36 months of closing.”

Great to see our companies on ‘The List’ acquiring and integrating successfully. This bodes well for continued growth.

Dividend Increases:

A few of our dividend growers did exactly that, extending their dividend growth streaks and announcing dividend increases in Q3, getting a head start on 2022.

TFII-T from .23 to .27 up 17.4%
WCN-N from .205 to .23 up 12.2%
CTC-A-T from 1.175 to 1.3 up 10.6%
IFC-T from .83 to .91 up 9.64%
FTS-T from .505 to .535 up 5.94%
EMA-T from .6375 to .6625 up 3.92%
T-T from .3162 to .3274 up 3.54%

In the news:

Equitable Group Inc. (EQB-T) announces two for one split of its common shares this quarter. We sent out a tweet when this happened. We mentioned that we like stock splits for the simple reason they prove that there has been growth.

Another announcement of significance this quarter was the lifting of pandemic-related restrictions that prevented banks and insurers from raising dividends and buying back shares. We will be watching our bank stocks on ‘The List’ closely for dividend increases when they report Q4 earnings later this year.

Misses:

The stocks that surprised the most with significant earnings misses were MGA-N and SJ-T.

Magna International Inc. (MGA-N) missed expectations due to a sales decrease of 13% in Q3.

“Industry pressures intensified in the third quarter of 2021, resulting in a challenged operating environment. As a result of semiconductor chip shortages, our customers’ production schedules were unpredictable, causing labour and other operational inefficiencies at our facilities. Semiconductor chip shortages and related production disruptions are expected to continue into 2022, and the negative impacts continue to exceed our expectations from earlier this year. Our results were also negatively impacted by inflationary cost increases in production inputs including freight, labour and commodities.”

We will watch closely to see if the uncertainties above are transitory in nature or become longer term concerns.

Stella Jones Inc. (SJ-T) missed earnings expectations by 20%. Management attributes the miss to the volatility of lumber prices during the quarter which increased their costs in their utility pole and railway ties segments that outpaced any price adjustments. They also saw a softening of demand in their logs and lumber sales. Management remains confident in the near term that revenue and profitability will be up year over year and announced an acquisition during the quarter, Cahaba Pressure Treated Forest Products Inc.

“Based on current market conditions and assuming the conclusion of the acquisitions of Cahaba Pressure and Cahaba Timber, management is forecasting sales, EBITDA and EBITDA margin in 2022 to be comparable to the solid results expected in 2021. The Company anticipates that the robust demand for utility poles, the sustained railway ties maintenance demand and the contribution from the pending acquisitions will offset the normalization of residential lumber sales in 2022.”

We are always wary of earnings misses but management seems confident going into the fourth quarter and beyond. We will give them the benefit of the doubt for now.

Update:

Enghouse Systems Limited (ENGH-T) which we highlighted as an under-performer last quarter showed a slight uptick in fundamental performance. Revenue and EBITDA were up slightly over Q2 and management announced two acquisitions during the quarter. The business seems to be trending in the right direction for now. We will continue to monitor.

Summary:

For the most part the Analysts were close with their estimates, with the median ‘beat’ in the range of 2%. Compare this to last quarter (8%), and earnings estimates are getting a bit more predictable as we come out of the pandemic.

Here is ‘The List’ sorted by reporting date complete with the market’s consensus estimates and actual reported results.

COMPANY DATE ESTIMATE RESULT
Bank of Nova Scotia 24-Aug $1.90 $2.01
Royal Bank of Canada 25-Aug $2.71 $3.00
TD Bank 26-Aug $1.92 $1.96
Alimentation Couche-Tard Inc. 31-Aug $0.65 $0.71
Dollarama Inc. 9-Sep $0.49 $0.48
Enghouse Systems Limited 9-Sep $0.39 $0.38
Canadian National Railway 19-Oct $1.43 $1.52
Canadian Utilities Limited 27-Oct $0.31 $0.33
Waste Connections 28-Oct $0.85 $0.89
TFI International 29-Oct $1.26 $1.46
Fortis 29-Oct $0.64 $0.64
Equitable Group Inc. 3-Nov $2.06 $2.07
Toromont Industries 3-Nov $1.13 $1.13
Brookfield Infrastructure Partners 3-Nov $0.13 $0.72
Franco Nevada 4-Nov $0.85 $0.87
Telus 4-Nov $0.28 $0.29
Enbridge Inc. 4-Nov $0.57 $0.59
Bell Canada 4-Nov $0.82 $0.82
Magna 4-Nov $0.64 $0.56
Trans Canada 5-Nov $0.99 $0.99
Stella-Jones Inc. 9-Nov $0.65 $0.52
Intact Financial 10-Nov $1.04 $1.60
CCL Industries 10-Nov $0.87 $0.85
Algonquin Power & Utilities 10-Nov $0.15 $0.15
Emera 11-Nov $0.66 $0.68
Canadian Tire 11-Nov $4.33 $4.20
Metro 17-Nov $0.80 $0.81

‘The List’ – Portfolio Review (November 2021)

Posted by BM on November 15, 2021 

Each month I will walk through our valuation process using a stock on ‘The List’ that meets our minimum screen of 6.5% EPS Yld. This month it is TC Energy Corp. (TRP-T).

Valuation is the second step in our three-step process. Buying when our quality stocks are sensibly priced will help ensure our future investment returns meet our expectations. We rely heavily on the fundamental analyzer software tool (FASTgraphs) to help us understand the fundamentals of the stocks we invest in and then read the company’s website for investor presentations and recent earnings reports to learn more.

Intro:

TC Energy Corp. is a vital part of everyday life – delivering the energy millions of people rely on to power their lives in a sustainable way. Thanks to a safe, reliable network of natural gas and crude oil pipelines, along with power generation and storage facilities, wherever life happens. Guided by the core values of safety, innovation, responsibility, collaboration and integrity, 7,500 people make a positive difference in the communities where they operate across Canada, the U.S. and Mexico.

TC Energy Corp., formerly TransCanada Corp, is an energy infrastructure company. The Company is engaged in the development and operation of North American energy infrastructure, including natural gas and liquids pipelines, power generation and natural gas storage facilities. Its segments include Canadian Natural Gas Pipelines, U.S. Natural Gas Pipelines, Mexico Natural Gas Pipelines, Liquids Pipelines and Energy. The Company operates in three businesses: Natural Gas Pipelines, Liquids Pipelines and Energy. The Natural Gas Pipelines and Liquids Pipelines segments principally consist of its respective natural gas and liquids pipelines in Canada, the United States and Mexico, as well as its regulated natural gas storage operations in the United States. The Energy segment includes its power operations and the non-regulated natural gas storage business in Canada.

Historical Graph:

Historical Graph TRP
Source: FASTgraphs

Comments:

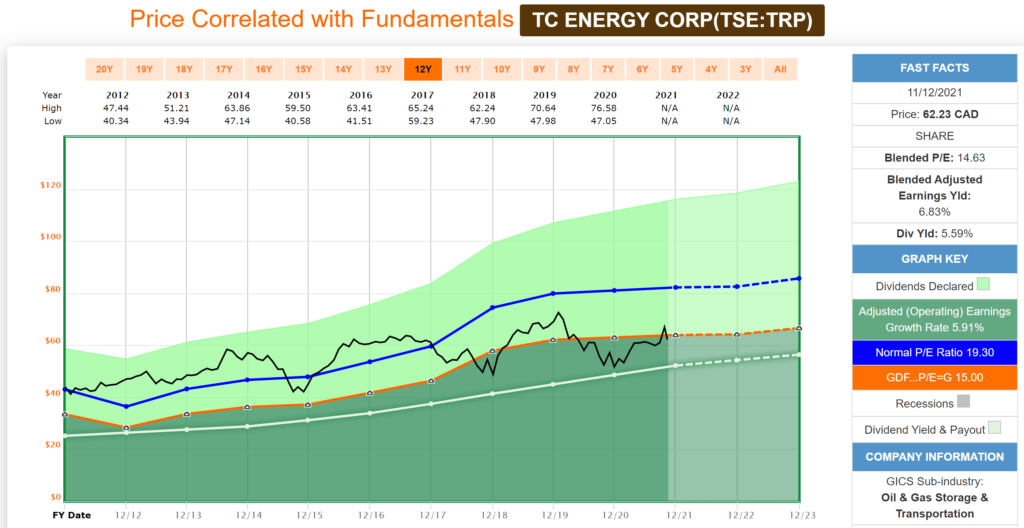
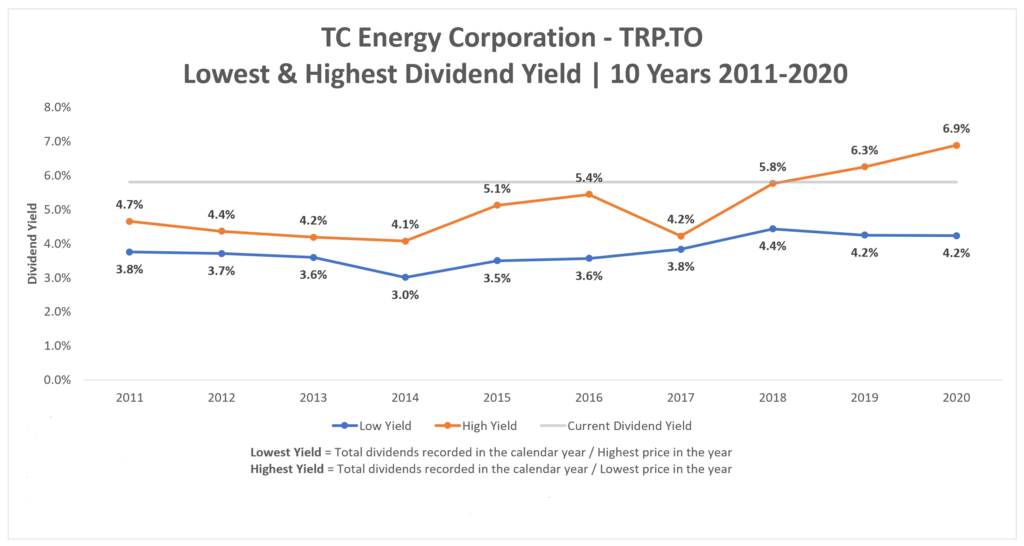
TC Energy Corp. is another of our good dividend growers that trades within a narrow valuation corridor. As you can see from the Blue Line on the graph (Normal P/E) and the Black Line (Price), there is typically very little variance (except for the large dips in 2018 and 2020). Investment opportunities occur when the Black Line falls below the Blue Line or below the Orange Line (15 PE) in a sell-off with this quality dividend grower. The fundamentals show a company whose earnings have grown steadily over the last ten years at an annualized rate of ~6%.

In the yield chart below, you will see a spike in the dividend yield above 6% last year when the price came under pressure. If you believed in ‘Dividend Yield Theory’ you would have been aggressively adding to your position last fall. The yield has come down a bit off its highs but is still trading well above its ten-year average of 4.3%.

Yield Chart:

Yield Chart TRP
Source: Dividend Growth Investing & Retirement

Performance Graph:

Performance TRP
Source: FASTgraphs

Comments:

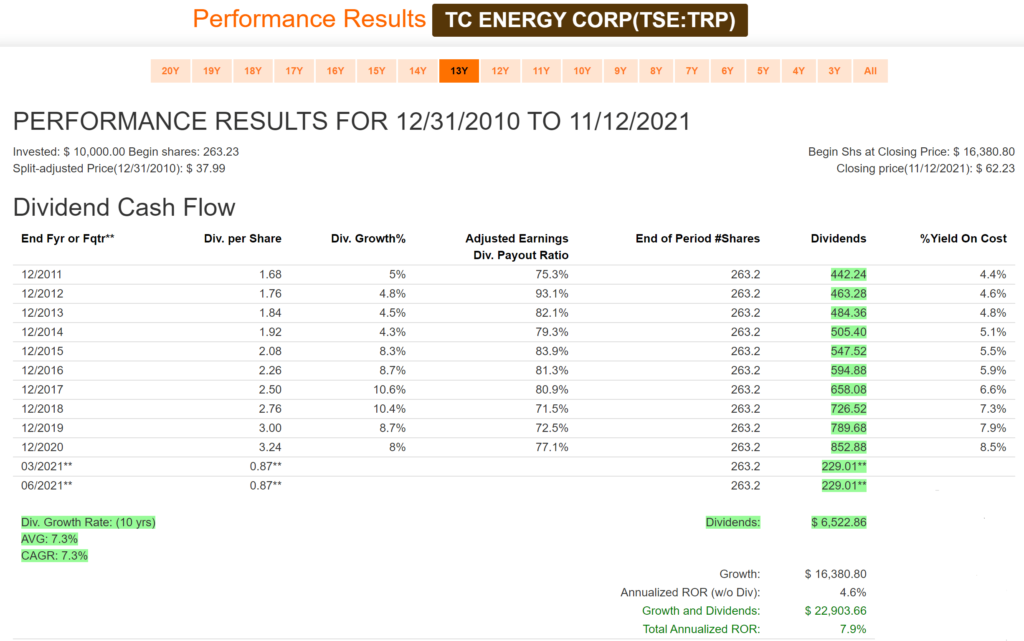
TC Energy Corp. has an annualized dividend growth rate of 7.3% over the last decade. With a yield on cost of 8.5% from an initial purchase a decade ago, investors now enjoy a healthy return from the dividend alone. Up until their Q3 Earnings announcement last week, investors of this quality company were expecting the trend of 7% dividend growth to continue. Management has now modified their dividend growth outlook to between 3-5% to help strengthen their Balance Sheet and have ‘dry powder’ to take advantage of opportunities when they arise.

Estimated Earnings:

Earnings TRP
Source: FASTgraphs

Comments:

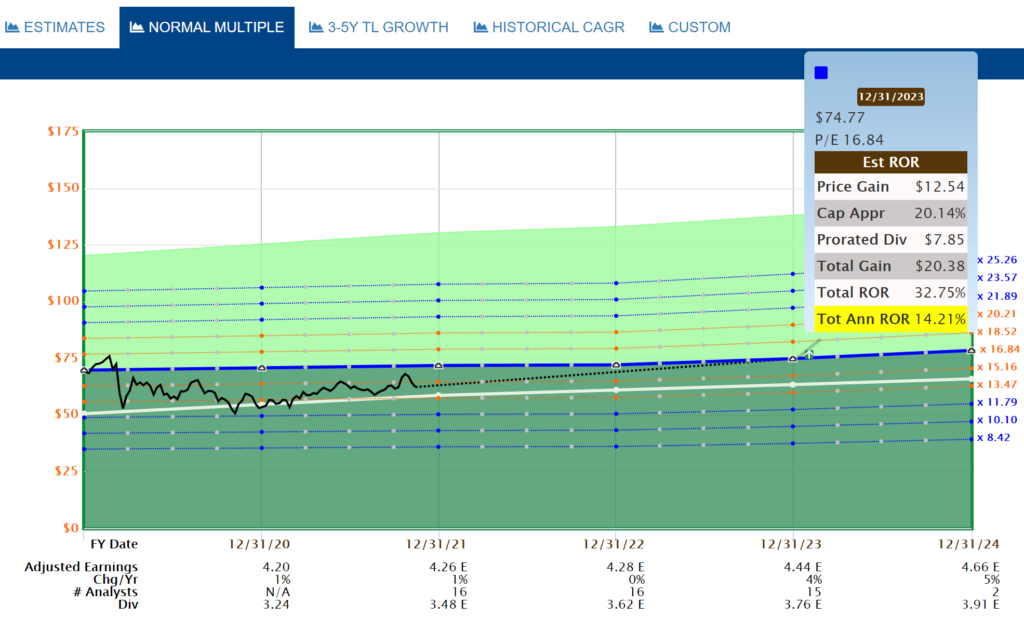
Using the “Normal Multiple’ estimating tool from FASTgraphs, we see a blended P/E average over the last five years of 16.84. Based on fifteen analysts’ forecasts two years out, you can expect an annualized return based on today’s price of 14.21% should TRP.TO trade at its blended P/E.

Blended P/E is based upon a weighted average of the most recent actual value and the closest forecast value.

Analyst Scorecard:

Scorecard TRP
Source: FASTgraphs

Comments:

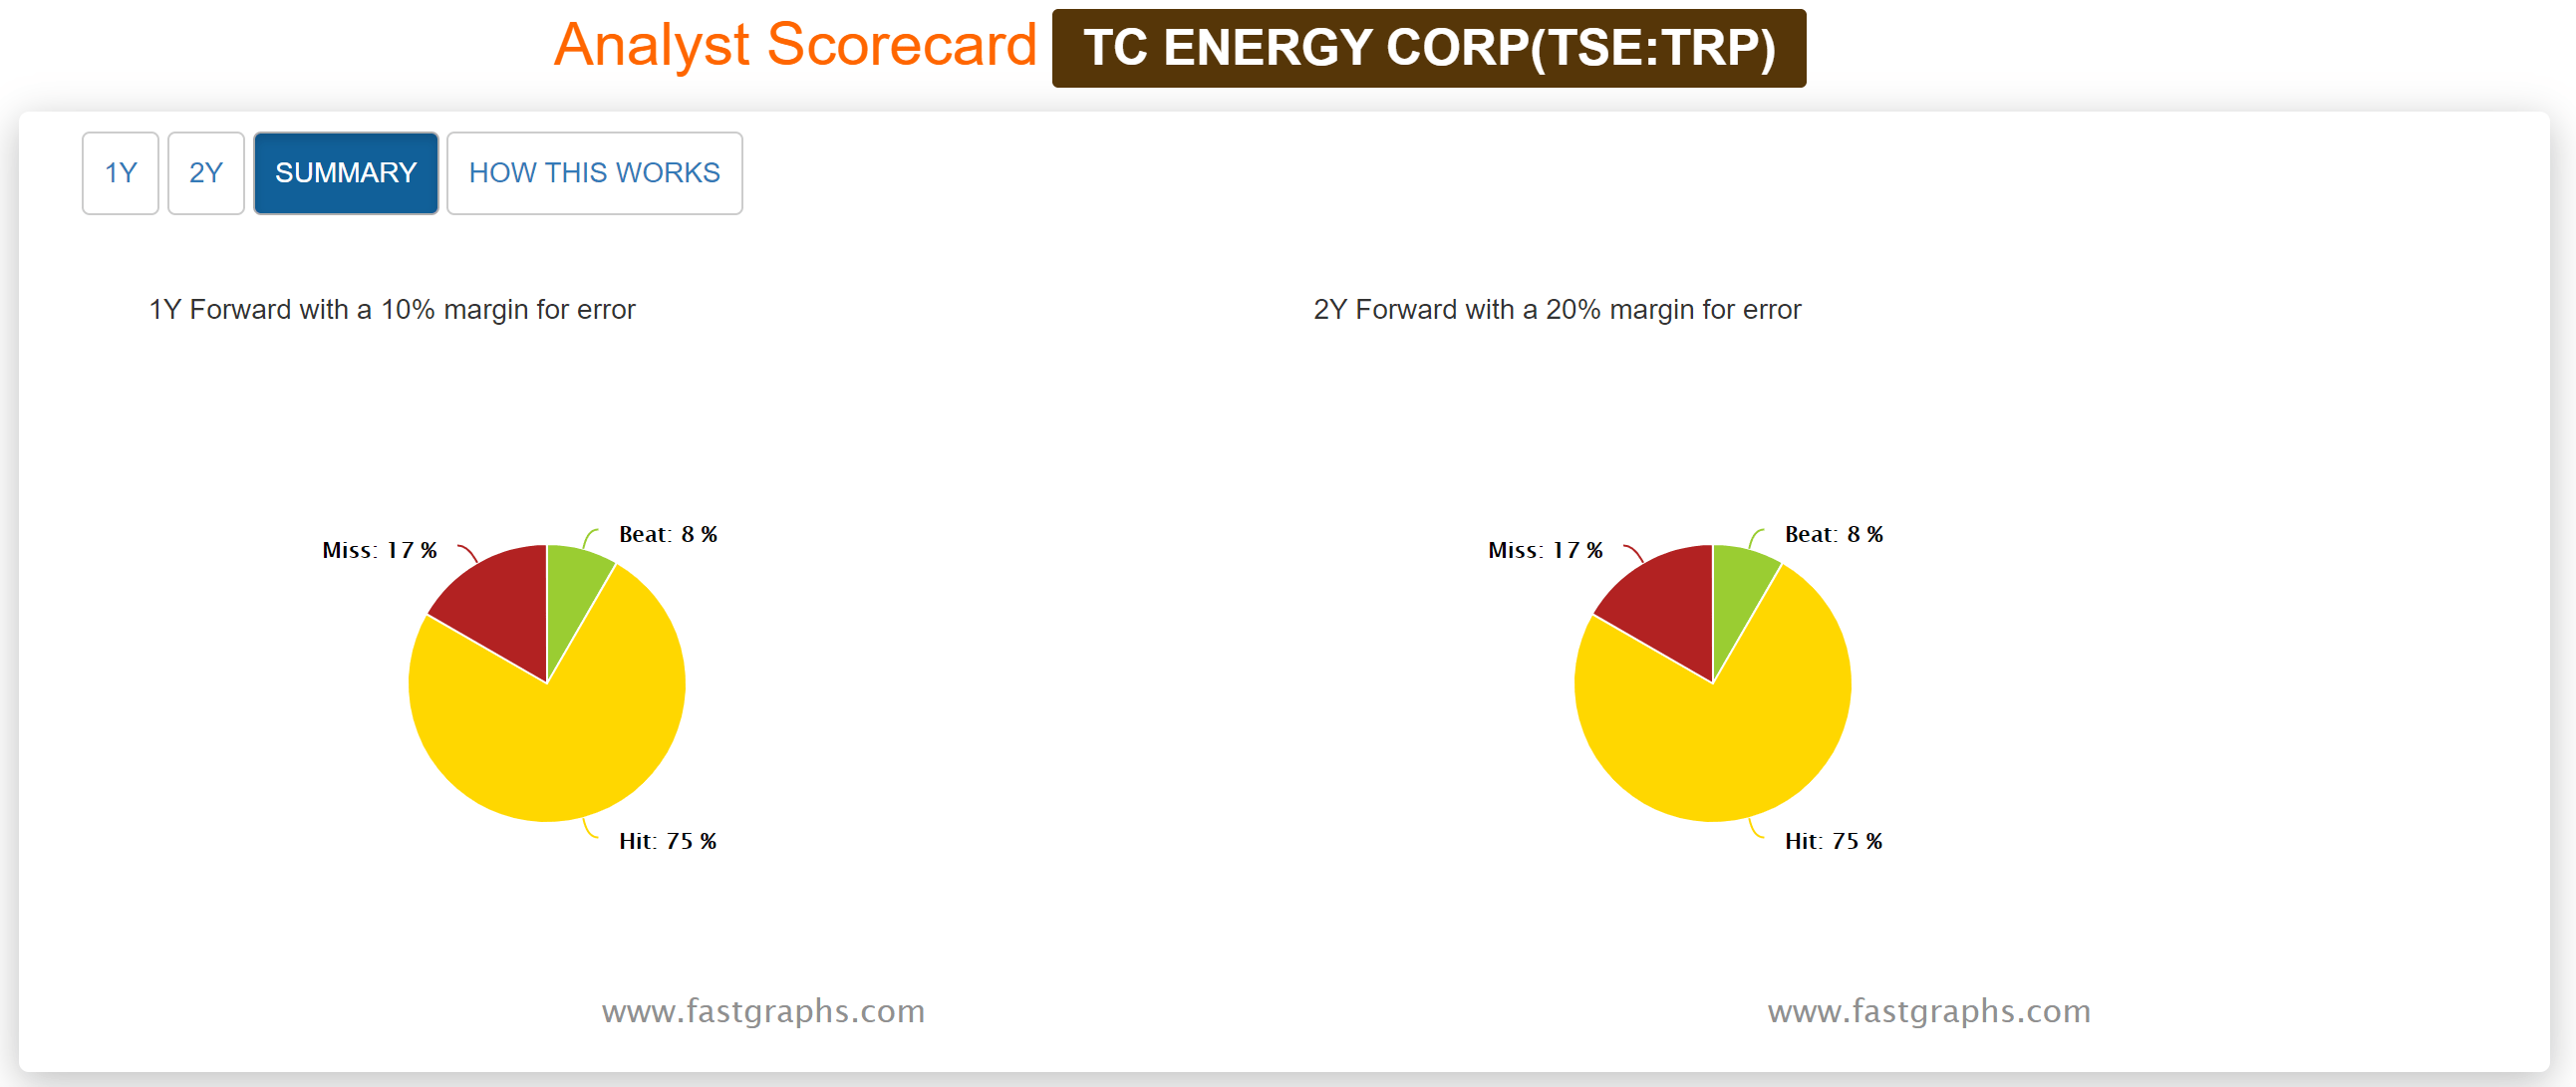
Analyst estimates over the years are quite accurate based on one and two-year earnings projections. Analysts’ projections have hit or beat 83% of the time on one and two year estimates.

Recent Earnings Report-Q3 2021:

Third quarter 2021 financial results

  • Net income attributable to common shares of $779 million or $0.80 per common share
  • Comparable earnings of $1.0 billion or $0.99 per common share
  • Comparable EBITDA of $2.2 billion
  • Net cash provided by operations of $1.7 billion
  • Comparable funds generated from operations of $1.6 billion

Declared a quarterly dividend of $0.87 per common share for the quarter ending December 31, 2021

Continued to advance our $22 billion secured capital program by investing $1.7 billion in various growth projects

Began construction on the 2022 NGTL System Expansion Program

Continued to actively develop projects on our U.S. Natural Gas Pipeline network that will replace and upgrade certain facilities while reducing emissions including the US$0.8 billion WR project on ANR

Uncontested GTN rate settlement filed with FERC which would set new recourse rates for GTN effective January 1, 2022

Filed Columbia Gas rate settlement with FERC in October which includes continuation of its modernization program with approval expected in early 2022

Executed a 15-year Power Purchase Agreement (PPA) in September for 100 per cent of the power produced and the rights to all environmental attributes from the 297 MW Sharp Hills Wind Farm

Advanced the Bruce Power Unit 6 MCR program on budget and on schedule

Project 2030 launched by Bruce Power with the goal of achieving a site peak output of 7,000 MW by 2030 in support of climate change targets and future clean energy needs

Continued to develop a 1,000 MW pumped hydro storage project in Meaford, Ontario which is designed to provide emission-free electricity to the province while reducing greenhouse gas emissions

Signed a memorandum of understanding in August with Irving Oil to explore the joint development of a series of proposed energy projects focused on reducing greenhouse gas emissions and creating new economic opportunities in New Brunswick and Atlantic Canada

Partnered with Nikola Corporation in October to collaborate on developing, constructing, operating and owning large-scale hydrogen production facilities in the United States and Canada

Issued US$1.25 billion of 3-year and US$1.0 billion of 10-year fixed rate Senior Unsecured Notes in October

Released our 2021 Report on Sustainability in October which includes targets for our sustainability commitments, including reducing the emissions intensity from our operations 30 per cent by 2030 and positioning to achieve net zero emissions from our operations by 2050.

“During the first nine months of 2021, our diversified portfolio of essential energy infrastructure assets continued to perform very well and reliably meet North America’s growing demand for energy,” said François Poirier, TC Energy’s President and Chief Executive Officer.

“We are in the midst of an unprecedented period that is providing a significant number of investment opportunities driven by both the growing demand for energy and the transition to a cleaner energy future, added Poirier. We expect to sanction approximately $7 billion of new projects in 2021 with a risk-adjusted return profile that is consistent with previous investments and anticipate annual amounts of more than $5 billion will be added to our secured projects portfolio in each of the next several years. In order to judiciously fund our attractive suite of growth opportunities, maintain a strong financial position and enhance our already conservative, utility-like dividend payout ratios, we have modified our near-term dividend growth outlook,” continued Poirier. “We now expect to increase our common share dividend at an average annual rate of three to five per cent. While our previous outlook remains affordable and supported by the strong underlying performance of our business, we believe a modest change is prudent given our vast opportunity set. It will allow us to fund a larger portion of our future capital programs through internally generated cash flow, moderate our leverage and continue to deliver superior long-term total shareholder returns.”

Summary:

The market seems to have shaken off the ‘modified near-term dividend growth outlook’ announced last week. Analysts are mostly in agreement with management’s decision to strengthen their Balance Sheet and increase cash flow as opposed to paying out more dividends. Earnings are still projected to be in the traditional 7% range.

In the Magic Pants Wealth Builder (CDN) portfolio we added to our position in TC Energy incrementally last fall when the dividend yield was well above 6%. Once again, our process signaled that this was the time to buy even though the short-term narrative was negative surrounding the cancellation of the Keystone XL pipeline under a Biden administration. The pipeline was indeed cancelled but the stock has rebounded nicely from its December lows and we were able to purchase more income at a discounted price.

Quality companies find a way to overcome short-term setbacks. With no new pipelines being built in the foreseeable future and energy demand increasing, management sees the value of ‘pipe in the ground’ and is optimistic this will help increase margins. Combine that with new projects underway, higher cash flow and a disciplined management team, there is optimism that TC Energy will be able to transition to a cleaner energy future successfully. We will be monitoring our position closely.

As an investor looking for income there is a lot to like about TC Energy Corporation. A twenty-year dividend growth streak, an above average starting yield and currently, modest dividend growth at a sensible price.

We buy quality individual dividend growth stocks when they are sensibly priced and hold for the growing income.