MP Market Review – March 24, 2023
Last updated by BM on March 27, 2023
Summary
- This is a weekly installment of our MP Market Review series, which provides updates on the financial markets and Canadian dividend growth companies we monitor on ‘The List’.
- Last week, ‘The List’ was flat with a YTD price return of +2.4% (capital). Dividend growth also remained the same at +7.3% YTD, highlighting growth in income over the past year.
- Last week, there were no dividend increases from companies on ‘The List’.
- Last week, there were no earnings reports from companies on ‘The List’.
- One company on ‘The List’ is due to report earnings this week.
- If you’re interested in creating your own income portfolio, consider subscribing to our premium service, which grants you access to the MP Wealth-Builder Model Portfolio (CDN) and exclusive subscriber-only content. Learn More
Introduction
“You have a pair of pants. In the left pocket, you have a $100. You take $1 out of the left pocket and put in the right pocket. You now have a $101. There is no diminution of dollars in your left pocket. That is one magic pair of pants.”
This ‘magic pants’ analogy was from a Seeking Alpha article on dividend investing I read about a decade ago and was one of the catalysts for me to take a closer look at this type of investing and see if it truly was magical.
After conducting additional research, I have shifted towards utilizing a dividend growth investing (DGI) strategy as my primary investment approach. While I maintain portfolios consisting of high-quality dividend growers from both the United States and Canada, I have opted to concentrate on Canadian (CDN) dividend growth companies in this blog. This is due to several reasons, including a smaller pool of DGI companies to track, a lack of coverage for the DGI strategy by Canadian investment media, and a tendency for those who do cover DGI to narrowly focus on only a handful of sectors (Energy and Financials).
While ‘The List’ is not a portfolio in itself, it serves as an excellent initial reference for individuals seeking to diversify their investments and attain higher returns in the Canadian stock market. Through our blog, we provide weekly updates on ‘The List’ and offer valuable perspectives and real-life examples of the dividend growth investing strategy in practice. This helps readers gain a deeper understanding of how to implement and benefit from this investment approach.
DGI Thoughts
“Experience is the name we give to our mistakes.”
– Oscar Wilde
Reflecting on the current banking liquidity issues reminded me of a lesson I learned early on in my journey as a dividend growth investor. The company was Home Capital Group (HCG-T).
Home Capital Group is a Canadian company that provides mortgage lending, deposits, and consumer credit services. In July 2015, the company suspended 45 mortgage brokers for submitting fraudulent income information on mortgage applications. The value of mortgages at the time from the suspended brokers on Home Capital’s books was estimated to be between $1.5 billion and $2 billion.
In March 2017, the company’s President and CEO, Martin Reid, was fired. This came two weeks after several current and former officers and directors of the company received enforcement notices from the Ontario Securities Commission (OSC). The OSC’s notices were related to the company’s past disclosure practices and, in some cases, trades in its shares.
The OSC’s enforcement action followed a series of events that had put the company under intense scrutiny. In April 2015, the Globe and Mail newspaper published an investigation that alleged that some Home Capital brokers had falsified borrower incomes on mortgage applications. The company initially denied the allegations but later launched an investigation that confirmed the fraud and led to the suspension of the 45 brokers.
The fallout from the fraud scandal had a significant impact on Home Capital’s business. The company’s stock price fell sharply, and it faced a run on deposits as some customers withdrew their money. The company was forced to seek a $2 billion credit line from the Healthcare of Ontario Pension Plan to support its operations.
As an investor, it is important to thoroughly research and understand the risks associated with any investment, especially in the financial sector. This includes evaluating a bank’s financial strength, management quality, and regulatory compliance. Keeping up with news and developments related to the company and the broader industry can also be helpful in identifying potential risks and opportunities.
Thankfully, my position size at the time was small enough so that the impact on my overall portfolio was minimal. Whenever possible, I now only invest in larger capitalized companies with several quality indicators.
If you have not yet joined as a subscriber of the blog to receive DGI Alerts on the activity in our model portfolio, it’s not too late. Click Here.
Recent News
How to beat the pros, Part 3: Identifying high-quality stocks (Globe & Mail)
“To reiterate what we said in the last article, stock picking is a subtraction process. We believe that enterprising investors would have a great chance of harvesting long-term alpha by rejecting the temptation of betting on most public companies that are speculative in nature, and, instead, concentrating on only a few high-quality ones on an exceedingly selective basis. We define quality as the predictable ability for a business to generate a superior return on capital over time.”
The author identifies his ‘quality indicators’ as companies with capital-light business models, management with an owner mindset and market leadership.
We have been in agreement with much of what the author has written about in his first two articles, including the quote above. We do, however, have specific ‘quality indicators’ when it comes to our strategy of investing.
U.S. banking crisis plunges TD’s First Horizon deal into uncertainty (Globe & Mail)
https://www.theglobeandmail.com/business/article-td-first-horizon-banking-crisis/
“Shares of First Horizon have been plummeting, sinking more than 20 per cent since Silicon Valley Bank’s demise nearly two weeks ago, sending U.S. regional banks stocks tumbling. Early last year, TD agreed to buy First Horizon for US$25 a share, higher than the US$15.58 that the U.S. bank’s share price closed at on Wednesday. At its widest, the spread between TD’s offer and First Horizon’s beleaguered stock was US$10 on Friday.”
The author seems to feel that Toronto-Dominion Bank can now go back and renegotiate a better deal. We never know what exactly the outcome will be, which is why we stick to our process.
Negative news about our quality dividend growers is usually short-lived. That is why we don’t pay much attention to it unless it gives us an opportunity to add to our positions at a sensible price. This was the case with Toronto-Dominion Bank over the last few weeks.
The List (2023)
Last updated by BM on March 24, 2023
The Magic Pants List contains 27 Canadian dividend growth stocks. ‘The List’ contains Canadian companies that have raised their dividend yearly for at least the last ten years and have a market cap of over a billion dollars. Provided below is each stock’s symbol, name, current yield, current price, price return year-to-date, current dividend, dividend growth year-to-date and current dividend growth streak. Companies on ‘The List’ are added or subtracted once a year, on January 1. After that, ‘The List’ is set for the next twelve months. Prices and dividends are updated weekly.
| SYMBOL | COMPANY | YLD | PRICE | YTD % | DIV | YTD % | STREAK |
|---|---|---|---|---|---|---|---|
| AQN-N | Algonquin Power & Utilities | 6.3% | $8.02 | 19.2% | $0.51 | -29.0% | 12 |
| ATD-T | Alimentation Couche-Tard Inc. | 0.9% | $64.66 | 7.5% | $0.56 | 19.1% | 13 |
| BCE-T | Bell Canada | 6.3% | $60.79 | 0.9% | $3.82 | 5.0% | 14 |
| BIP-N | Brookfield Infrastructure Partners | 4.4% | $31.79 | 5.2% | $1.44 | 6.3% | 15 |
| CCL-B-T | CCL Industries | 1.6% | $64.66 | 11.4% | $1.06 | 10.4% | 21 |
| CNR-T | Canadian National Railway | 2.0% | $156.11 | -4.2% | $3.16 | 7.8% | 27 |
| CTC-A-T | Canadian Tire | 4.1% | $167.53 | 14.3% | $6.90 | 17.9% | 12 |
| CU-T | Canadian Utilities Limited | 5.0% | $35.93 | -2.7% | $1.79 | 1.0% | 51 |
| DOL-T | Dollarama Inc. | 0.3% | $78.72 | -1.4% | $0.22 | 2.3% | 12 |
| EMA-T | Emera | 5.0% | $54.70 | 4.0% | $2.76 | 3.0% | 16 |
| ENB-T | Enbridge Inc. | 7.0% | $50.43 | -5.4% | $3.55 | 3.2% | 27 |
| ENGH-T | Enghouse Systems Limited | 2.3% | $37.38 | 4.7% | $0.85 | 18.2% | 16 |
| FNV-N | Franco Nevada | 0.9% | $144.42 | 4.5% | $1.36 | 6.3% | 15 |
| FTS-T | Fortis | 4.0% | $56.16 | 1.5% | $2.26 | 4.1% | 49 |
| IFC-T | Intact Financial | 2.3% | $193.41 | -1.2% | $4.40 | 10.0% | 18 |
| L-T | Loblaws | 1.4% | $116.29 | -3.4% | $1.62 | 5.2% | 11 |
| MGA-N | Magna | 3.7% | $50.18 | -12.8% | $1.84 | 2.2% | 13 |
| MRU-T | Metro | 1.7% | $70.74 | -6.3% | $1.21 | 10.0% | 28 |
| RY-T | Royal Bank of Canada | 4.2% | $126.81 | -1.0% | $5.28 | 6.5% | 12 |
| SJ-T | Stella-Jones Inc. | 1.8% | $50.27 | 1.4% | $0.92 | 15.0% | 18 |
| STN-T | Stantec Inc. | 1.0% | $75.97 | 16.3% | $0.77 | 8.5% | 11 |
| TD-T | TD Bank | 4.9% | $77.62 | -11.5% | $3.84 | 7.9% | 12 |
| TFII-N | TFI International | 1.2% | $112.25 | 12.1% | $1.40 | 29.6% | 12 |
| TIH-T | Toromont Industries | 1.6% | $106.62 | 9.1% | $1.68 | 10.5% | 33 |
| TRP-T | TC Energy Corp. | 7.1% | $52.00 | -2.4% | $3.69 | 3.4% | 22 |
| T-T | Telus | 5.1% | $27.30 | 3.7% | $1.40 | 5.4% | 19 |
| WCN-N | Waste Connections | 0.8% | $133.62 | 1.5% | $1.02 | 7.9% | 13 |
| Averages | 3.2% | 2.4% | 7.3% | 19 |
Six Canadian stocks on ‘The List’ declare earnings and dividends in US dollars and are inter-listed on a US exchange in US dollars. The simplest way to display dividend and price metrics for these stocks is to show their US exchange symbols along with their US dividends and price. The stocks I am referring to have a -N at the end of their symbols. You can still buy their Canadian counterparts (-T), but your dividends will be converted into CDN dollars and will fluctuate based on the exchange rate.
Note: When the currency of the dividend and share price match, the calculation is straightforward. But it’s not so simple when the dividend is declared in one currency and the share price is quoted in another. Dividing the former by the latter would produce a meaningless result because it’s a case of apples and oranges. To calculate the yield properly, you would need to express the dividend and share price in the same currency.
Performance of ‘The List’
Feel free to click on this link, ‘The List’ for a sortable version from our website.
Last week, ‘The List’ was flat with a YTD price return of +2.4% (capital). Dividend growth also remained the same at +7.3% YTD, highlighting growth in income over the past year.
The best performers last week on ‘The List’ were Alimentation Couche-Tard Inc. (ATD-T), up +4.98%; Intact Financial (IFC-T), up +2.12%; and Canadian Tire (CTC-A-T), up +2.05%.
TFI International (TFII-N) was the worst performer last week, down -3.34%.
Dividend Increases
“The growth of dividend paying ability is of significance in the determination of a stock’s quality, or general safety…”
– Arnold Bernhard (the founder of Value Line)
“As a dividend increase is a positive sign of a company’s financial strength, the safest purchase, after research, is a stock with a recent dividend increase.”
– Tom Connolly (the founder of dividendgrowth.ca)
Last week, there were no dividend increases from companies on ‘The List’.
Earnings Releases
Benjamin Graham once remarked that earnings are the principal factor driving stock prices.
Each quarter we will provide readers with weekly earnings updates of stocks on ‘The List’ during the calendar earnings season.
The updated earnings calendar can be found here.
Earnings growth and dividend growth tend to go hand in hand, so this information can tell us a lot about the future dividend growth of our quality companies. Monitoring our dividend growers periodically is part of the process, and reading the quarterly earnings releases is a good place to start.
One company on ‘The List’ is due to report earnings this week.
Dollarama Inc. (DOL-T) follows an off-cycle reporting schedule. It will release its fourth-quarter 2023 results on Wednesday, March 29, 2023, after markets open.
Last week, there were no earnings reports from companies on ‘The List’.
MP Market Review – March 17, 2023
Last updated by BM on March 20, 2023
Summary
- This is a weekly installment of our MP Market Review series, which provides updates on the financial markets and Canadian dividend growth companies we monitor on ‘The List’.
- Last week, ‘The List’ was up slightly with a YTD price return now of +2.4% (capital). Dividend growth remained the same at +7.3% YTD, highlighting growth in income over the past year.
- Last week, there were no dividend increases from companies on ‘The List’.
- Last week, there were three earnings reports from companies on ‘The List’.
- No companies on ‘The List’ are due to report earnings this week.
- If you’re interested in creating your own income portfolio, consider subscribing to our premium service, which grants you access to the MP Wealth-Builder Model Portfolio (CDN) and exclusive subscriber-only content. Learn More
Introduction
“You have a pair of pants. In the left pocket, you have a $100. You take $1 out of the left pocket and put in the right pocket. You now have a $101. There is no diminution of dollars in your left pocket. That is one magic pair of pants.”
This ‘magic pants’ analogy was from a Seeking Alpha article on dividend investing I read about a decade ago and was one of the catalysts for me to take a closer look at this type of investing and see if it truly was magical.
After conducting additional research, I have shifted towards utilizing a dividend growth investing (DGI) strategy as my primary investment approach. While I maintain portfolios consisting of high-quality dividend growers from both the United States and Canada, I have opted to concentrate on Canadian (CDN) dividend growth companies in this blog. This is due to several reasons, including a smaller pool of DGI companies to track, a lack of coverage for the DGI strategy by Canadian investment media, and a tendency for those who do cover DGI to narrowly focus on only a handful of sectors (Energy and Financials).
While ‘The List’ is not a portfolio in itself, it serves as an excellent initial reference for individuals seeking to diversify their investments and attain higher returns in the Canadian stock market. Through our blog, we provide weekly updates on ‘The List’ and offer valuable perspectives and real-life examples of the dividend growth investing strategy in practice. This helps readers gain a deeper understanding of how to implement and benefit from this investment approach.
DGI Thoughts
“Earnings are the principal factor driving stock prices.”
– Benjamin Graham
Q4 2022 earnings season is over for companies on ‘The List’.
The earnings results are now available for viewing at the bottom of the page under the ‘The List’ menu item. Here we track analysts estimated earnings and compare them to actual results. One-third of the companies on ‘The List’ missed expectations last quarter, which is the highest since we started the blog in early 2021.
The probability is rising of an earnings recession in 2023 which will put downward pressure on stock markets both here and in the United States. Additional events, like the banking system issues last week in Europe and the US, could make markets unpredictable in the short term. With lots of cash available in our subscriber model portfolio, we are looking to take advantage of short-term mispricing of the quality companies we follow.
If you have not yet joined as a subscriber of the blog to receive DGI Alerts on the activity in our model portfolio, it’s not too late. Click Here.
Recent News
Who’s to blame for this banking and markets mess? The addiction to debt that started with the baby boomers (Globe & Mail)
“The aim of the wise is not to secure pleasure but to avoid pain”
– Aristotle
“Silicon Valley Bank (SVB) is a bank that wanted to grow fast and took excessive levels of risk by buying billions of dollars of treasury and other bonds when rates were almost zero, but lost significant value when rates started to move higher over the past 12 months. Rather than minimize risk, the bank tried to maximize profits and this backfired exactly as Aristotle had warned.”
The author is not convinced that things are going to end well.
Canadian Banks have always had the reputation of being better regulated and governed than their US counterparts. We will see how deep this problem goes here in Canada.
Couche-Tard to buy more than 2,000 European service stations from French energy giant TotalEnergies (Globe & Mail)
https://www.theglobeandmail.com/business/article-couche-tard-totalenergies-europe-gas-stations/
“This transaction has all the hallmarks of a Couche-Tard deal,” RBC Capital Markets analyst Irene Nattel said in a research note, adding that it is strategically compelling, geographically complementary and attractive in terms of valuation. Couche-Tard is paying a multiple of eight times operating profits, based on the stores’ 2022 results.
This deal looks like it is in Alimentation Couche-Tard’s wheelhouse. Adding significantly more stores in Europe in four new countries gives Couche-Tard a significant market share with 4900 stores now in Europe.
The List (2023)
Last updated by BM on March 17, 2023
The Magic Pants List contains 27 Canadian dividend growth stocks. ‘The List’ contains Canadian companies that have raised their dividend yearly for at least the last ten years and have a market cap of over a billion dollars. Provided below is each stock’s symbol, name, current yield, current price, price return year-to-date, current dividend, dividend growth year-to-date and current dividend growth streak. Companies on ‘The List’ are added or subtracted once a year, on January 1. After that, ‘The List’ is set for the next twelve months. Prices and dividends are updated weekly.
| SYMBOL | COMPANY | YLD | PRICE | YTD % | DIV | YTD % | STREAK |
|---|---|---|---|---|---|---|---|
| AQN-N | Algonquin Power & Utilities | 6.4% | $7.96 | 18.3% | $0.51 | -29.0% | 12 |
| ATD-T | Alimentation Couche-Tard Inc. | 0.9% | $61.59 | 2.4% | $0.56 | 19.1% | 13 |
| BCE-T | Bell Canada | 6.4% | $60.02 | -0.3% | $3.82 | 5.0% | 14 |
| BIP-N | Brookfield Infrastructure Partners | 4.4% | $32.46 | 5.2% | $1.44 | 6.3% | 15 |
| CCL-B-T | CCL Industries | 1.7% | $63.63 | 9.6% | $1.06 | 10.4% | 21 |
| CNR-T | Canadian National Railway | 2.0% | $158.30 | -2.8% | $3.16 | 7.8% | 27 |
| CTC-A-T | Canadian Tire | 4.2% | $164.16 | 12.0% | $6.90 | 17.9% | 12 |
| CU-T | Canadian Utilities Limited | 4.9% | $36.80 | -0.4% | $1.79 | 1.0% | 51 |
| DOL-T | Dollarama Inc. | 0.3% | $77.93 | -2.4% | $0.22 | 2.3% | 12 |
| EMA-T | Emera | 4.9% | $55.92 | 6.3% | $2.76 | 3.0% | 16 |
| ENB-T | Enbridge Inc. | 7.1% | $50.19 | -5.9% | $3.55 | 3.2% | 27 |
| ENGH-T | Enghouse Systems Limited | 2.3% | $36.68 | 2.7% | $0.85 | 18.2% | 16 |
| FNV-N | Franco Nevada | 0.9% | $143.50 | 3.9% | $1.36 | 6.3% | 15 |
| FTS-T | Fortis | 3.9% | $57.91 | 4.6% | $2.26 | 4.1% | 49 |
| IFC-T | Intact Financial | 2.3% | $189.40 | -3.3% | $4.40 | 10.0% | 18 |
| L-T | Loblaws | 1.4% | $116.06 | -3.5% | $1.62 | 5.2% | 11 |
| MGA-N | Magna | 3.7% | $50.18 | -12.8% | $1.84 | 2.2% | 13 |
| MRU-T | Metro | 1.7% | $69.95 | -7.3% | $1.21 | 10.0% | 28 |
| RY-T | Royal Bank of Canada | 4.1% | $127.26 | -0.6% | $5.28 | 6.5% | 12 |
| SJ-T | Stella-Jones Inc. | 1.8% | $51.27 | 3.4% | $0.92 | 15.0% | 18 |
| STN-T | Stantec Inc. | 1.0% | $78.35 | 19.9% | $0.77 | 8.5% | 11 |
| TD-T | TD Bank | 4.9% | $77.90 | -11.1% | $3.84 | 7.9% | 12 |
| TFII-N | TFI International | 1.2% | $116.13 | 16.0% | $1.40 | 29.6% | 12 |
| TIH-T | Toromont Industries | 1.6% | $107.77 | 10.3% | $1.68 | 10.5% | 33 |
| TRP-T | TC Energy Corp. | 7.2% | $51.03 | -4.3% | $3.69 | 3.4% | 22 |
| T-T | Telus | 5.2% | $26.87 | 2.1% | $1.40 | 5.4% | 19 |
| WCN-N | Waste Connections | 0.8% | $134.36 | 2.0% | $1.02 | 7.9% | 13 |
| Averages | 3.2% | 2.4% | 7.3% | 19 |
Six Canadian stocks on ‘The List’ declare earnings and dividends in US dollars and are inter-listed on a US exchange in US dollars. The simplest way to display dividend and price metrics for these stocks is to show their US exchange symbols along with their US dividends and price. The stocks I am referring to have a -N at the end of their symbols. You can still buy their Canadian counterparts (-T), but your dividends will be converted into CDN dollars and will fluctuate based on the exchange rate.
Note: When the currency of the dividend and share price match, the calculation is straightforward. But it’s not so simple when the dividend is declared in one currency and the share price is quoted in another. Dividing the former by the latter would produce a meaningless result because it’s a case of apples and oranges. To calculate the yield properly, you would need to express the dividend and share price in the same currency.
Performance of ‘The List’
Feel free to click on this link, ‘The List’ for a sortable version from our website.
Last week, ‘The List’ was up slightly with a YTD price return now of +2.4% (capital), while its dividend growth remained the same at +7.3% YTD, highlighting growth in income over the past year.
The best performers last week on ‘The List’ were Enghouse Systems Limited (ENGH-T), up +11.93%; Franco Nevada (FNV-N), up +10.01%; and Fortis (FTS-T), up +8.71%.
Stella-Jones Inc. (SJ-T) was the worst performer last week, down -8.71%.
Dividend Increases
“The growth of dividend paying ability is of significance in the determination of a stock’s quality, or general safety…”
– Arnold Bernhard (the founder of Value Line)
“As a dividend increase is a positive sign of a company’s financial strength, the safest purchase, after research, is a stock with a recent dividend increase.”
– Tom Connolly (the founder of dividendgrowth.ca)
Last week, there were no dividend increases from companies on ‘The List’.
Earnings Releases
Benjamin Graham once remarked that earnings are the principal factor driving stock prices.
Each quarter we will provide readers with weekly earnings updates of stocks on ‘The List’ during the calendar earnings season. Last week we saw the end of the Q4 2022 earnings season for companies on ‘The List’.
The updated earnings calendar can be found here.
Earnings growth and dividend growth tend to go hand in hand, so this information can tell us a lot about the future dividend growth of our quality companies. Monitoring our dividend growers periodically is part of the process, and reading the quarterly earnings releases is a good place to start.
No companies on ‘The List’ are due to report earnings this week.
Last week, three companies on ‘The List’, reported their earnings.
Franco Nevada (FNV-N) released its fourth-quarter 2022 results on Wednesday, March 15, 2023, after markets closed.
“Franco-Nevada is reporting strong fourth quarter and annual results for 2022. Our Diversified assets outperformed due to elevated energy prices in the year, stated Paul Brink, CEO. We are pleased that First Quantum and the Government of Panama have agreed on terms for a refreshed concession contract and look forward to Cobre Panama achieving its expanded throughput capacity later this year. Precious metal GEOs and Diversified production in 2023 are expected to be consistent with 2022. We are however guiding to lower total GEOs for the year as current energy prices are below 2022 levels. The organic growth in our 5 year outlook comes from both mine expansions and new mines. Franco-Nevada is debt-free, is growing its cash balances and has an active pipeline of growth opportunities.”
– Chief Executive Officer, Paul Brink
Highlights:
- Earned record GEOs, revenue, Adjusted Net Income, Adjusted EBITDA and operating cash flow in 2022
- No debt and $2.2 billion in available capital as at December 31, 2022
- Generated close to $1 billion in operating cash flow in 2022
- Quarterly dividend increased 6.25% to $0.34/share effective Q1 2023
Outlook:
For 2023, we expect GEO sales from our Precious Metal assets to range between 490,000 and 530,000 GEOs, consistent with 2022, but anticipate total GEOs sales to be between 640,000 and 700,000 GEOs, a reduction from 2022 primarily based on lower assumed oil and gas prices. With respect to Cobre Panama, based on First Quantum’s most recent 2023 guidance of between 350,000 and 380,000 tonnes of copper, our attributable GEO production would be between 131,000 and 142,000 GEOs. Following the restriction of concentrate shipments in February, we have made a larger allowance for the impact of shipment timing for the year. We have estimated GEOs delivered and sold from Cobre Panama to be between 115,000 and 135,000 GEOs. We expect higher production from Antapaccay, MWS and Musselwhite, and initial contributions from new mines including Magino, Séguéla and Salares Norte, partly offset by anticipated decreases in GEO sales from Antamina, Hemlo and Candelaria. For our Diversified assets, we are guiding to lower GEOs, reflecting lower assumed oil and gas prices, partly offset by higher GEO contributions from our Iron Ore and Other Mining assets.
We estimate depletion expense to be between $275 and $305 million. Our remaining capital commitment to the Royalty Acquisition Venture with Continental is $79.4 million. In addition, we expect to commence funding of our $250 million stream on the Tocantinzinho project at the end of Q1 2023.
Source: (FNV-N) Q4-2022 Earnings Release
Alimentation Couche-Tard Inc. (ATD-T) released its third-quarter 2023 results on Wednesday, March 15, 2023, after markets closed.
“As our markets across the globe, especially those in Europe, continue to face persistently high inflationary conditions, we have remained focused and committed to delivering a strong and consistent value to our customers and maintaining cost discipline in our operations. In convenience across the network, we had notable sales in our food program as well as with our private brand items, both offering high quality at lower price points. Throughout the quarter, we continued to be pleased with the resilience of our customers, and through our localized pricing efforts and on-going fuel promotions, we are providing them with further benefits. While our mobility results are still impacted by stay-at-home work patterns and higher prices, we continued to generate healthy fuel margins offsetting the decline in volumes,”.
– Brian Hannasch, President and Chief Executive Officer
Highlights:
- Net earnings were $737.4 million, or $0.73 per diluted share for the third quarter of fiscal 2023 compared with $746.4 million, or $0.70 per diluted share for the third quarter of fiscal 2022. Adjusted net earnings were approximately $741.0 million compared with $746.0 million for the third quarter of fiscal 2022. Adjusted diluted net earnings per share were $0.74, representing an increase of 5.7% from $0.70 for the corresponding quarter of last year. The translation of foreign currencies into US dollar had a net unfavorable impact of approximately $28.0 million on net earnings and adjusted net earnings.
- Total merchandise and service revenues of $5.0 billion, an increase of 3.5%. Same-store merchandise revenues increased by 4.8% in the United States, by 3.5% in Europe and other regions, and by 2.3% in Canada.
- Merchandise and service gross margin decreased by 0.4% in the United States to 33.2%, by 0.5% in Europe and other regions to 37.3%, and increased by 0.7% in Canada to 32.3%.
- Same-store road transportation fuel volumes decreased by 2.3% in the United States, by 1.2% in Europe and other regions, and increased by 0.5% in Canada.
- Road transportation fuel gross margin of 46.85¢ per gallon in the United States, an increase of 7.22¢ per gallon, CA 12.52¢ per liter in Canada, an increase of CA 0.74¢ per liter, and US 8.01¢ per liter in Europe and other regions, a decrease of US 2.82¢ per liter, driven by the impact of currency translation as well as by the volatility of the European fuel market. Fuel margins remained healthy throughout the network due to favorable market conditions and the continued work on the optimization of the supply chain.
- Subsequent to the end of the quarter, the Corporation closed the acquisition of 65 express tunnel car wash sites conveniently located in our core markets in the United States. The Corporation also reached an agreement to acquire 45 modern high-quality company-owned and operated convenience retail and fuel sites, in the United States.
- During the third quarter and first three quarters of fiscal 2023, the Corporation repurchased shares for amounts of $1.2 billion and $1.9 billion, respectively. Subsequent to the end of the quarter, shares were repurchased for an amount of $373.0 million.
Outlook:
LAVAL, QC, March 16, 2023 /CNW/ – Alimentation Couche-Tard Inc. (“Couche-Tard” or the “Corporation”) (TSX: ATD) announces today that it has agreed to a firm and irrevocable offer to acquire certain assets to be carved out from TotalEnergies and has entered into exclusive negotiations on this basis. The proposed acquisition would comprise 100% of TotalEnergies retail assets in Germany and the Netherlands as well as a 60% controlling interest in the Belgium and Luxembourg entities.
“We are excited to welcome the TotalEnergies employees and stores into the Couche-Tard family. As we learned more about their business, it became clear that we share the same customer-centric approach, values, and focus on an engaged workforce. We have deep respect for its operations, management, and people as well as great confidence that by joining forces together, we will build a winning global retail operation in the region. We see this as a strong geographical fit with our existing European network, which will allow us to grow together in some of Europe’s strongest economies and move forward in our vision to become the world’s preferred destination for convenience and mobility,” said Brian Hannasch, President and Chief Executive Officer of Alimentation Couche-Tard.
Source: (ATD-T) Q3-2023 Earnings Release
Algonquin Power & Utilities (AQN-N) released its fourth-quarter 2022 results on Friday, March 17, 2023, before markets opened.
“Despite various challenges throughout the year, we ended 2022 on stable footing, with our Adjusted Net Earnings per common share having met the Company’s revised guidance estimate,” said Arun Banskota, President and Chief Executive Officer of AQN. “We remain confident that the decisive actions previously announced by the Company to realign capital allocation will strengthen our financial and strategic foundation and position AQN for sustainable, long-term growth. AQN continues to be supported by a high-quality asset base and has the right skills and expertise to capitalize on the energy transition and deliver value for shareholders.”
– Arun Banskota, President and Chief Executive Officer
Highlights:
- Fourth quarter Adjusted EBITDA of $358.3 million, an increase of 20%;
- Fourth quarter Adjusted Net Earnings of $151.0 million, an increase of 10%;
- Fourth quarter Adjusted Net Earnings per common share of $0.22, an increase of 5%;
- Annual Adjusted EBITDA of $1,256.8 million, an increase of 17%;
- Annual Adjusted Net Earnings of $474.9 million, an increase of 6%;
- Annual Adjusted Net Earnings per common share of $0.69, a decrease of 3%, in each case on a year-over-year basis.
Outlook:
Reiterate Estimated 2023 Adjusted Net Earnings Per Common Share – The Company reiterates its previously-disclosed estimate of Adjusted Net Earnings per common share for the 2023 fiscal year within a range of $0.55-$0.61 (see “Non-GAAP Measures”).
Source: (AQN-N) Q4-2022 Earnings Call Presentation
MP Market Review – March 10, 2023
Last updated by BM on March 13, 2023
Summary
- This is a weekly installment of our MP Market Review series, which provides updates on the financial markets and Canadian dividend growth companies we monitor on ‘The List’.
- Last week, ‘The List’ was down sharply with a YTD price return now of +2.0% (capital), while its dividend growth jumped to +7.3% YTD, highlighting growth in income over the past year.
- Last week, there were two dividend increases from companies on ‘The List’.
- Last week, there were two earnings reports from companies on ‘The List’.
- Three companies on ‘The List’ are due to report earnings this week.
- If you’re interested in creating your own income portfolio, consider subscribing to our premium service, which grants you access to the MP Wealth-Builder Model Portfolio (CDN) and exclusive subscriber-only content. Learn More
Introduction
“You have a pair of pants. In the left pocket, you have a $100. You take $1 out of the left pocket and put in the right pocket. You now have a $101. There is no diminution of dollars in your left pocket. That is one magic pair of pants.”
This ‘magic pants’ analogy was from a Seeking Alpha article on dividend investing I read about a decade ago and was one of the catalysts for me to take a closer look at this type of investing and see if it truly was magical.
After conducting additional research, I have shifted towards utilizing a dividend growth investing (DGI) strategy as my primary investment approach. While I maintain portfolios consisting of high-quality dividend growers from both the United States and Canada, I have opted to concentrate on Canadian (CDN) dividend growth companies in this blog. This is due to several reasons, including a smaller pool of DGI companies to track, a lack of coverage for the DGI strategy by Canadian investment media, and a tendency for those who do cover DGI to narrowly focus on only a handful of sectors (Energy and Financials).
While ‘The List’ is not a portfolio in itself, it serves as an excellent initial reference for individuals seeking to diversify their investments and attain higher returns in the Canadian stock market. Through our blog, we provide weekly updates on ‘The List’ and offer valuable perspectives and real-life examples of the dividend growth investing strategy in practice. This helps readers gain a deeper understanding of how to implement and benefit from this investment approach.
DGI Thoughts
“Every decade or so, dark clouds will fill the economic skies, and they will briefly rain gold. When downpours of that sort occur, it’s imperative that we rush outdoors carrying washtubs, not teaspoons.”
– Warren Buffett
In our blog, we frequently discuss the process of determining a reasonable price for investing in a quality company. One such approach is the utilization of ‘Dividend Yield Theory’.
IQT (Investment Quality Trends) popularized this theory in the 1960s, and it is straightforward and logical. Essentially, it suggests that for high-quality dividend growth stocks, which are characterized by consistent business models that don’t undergo significant changes over time, dividend yields have a tendency to return to their average.
What makes ‘Dividend Yield Theory’ easy to comprehend is that if the current yield surpasses the ‘historical yield’ (i.e., the average yield), then the stock is probably undervalued, whereas if it falls below the average yield, it is likely overvalued.
Here are the top ten firms on ‘The List,’ which are currently within a range of a ‘reasonable price’ using ‘Dividend Yield Theory’ alone for valuation purposes (as of last Friday’s market close).
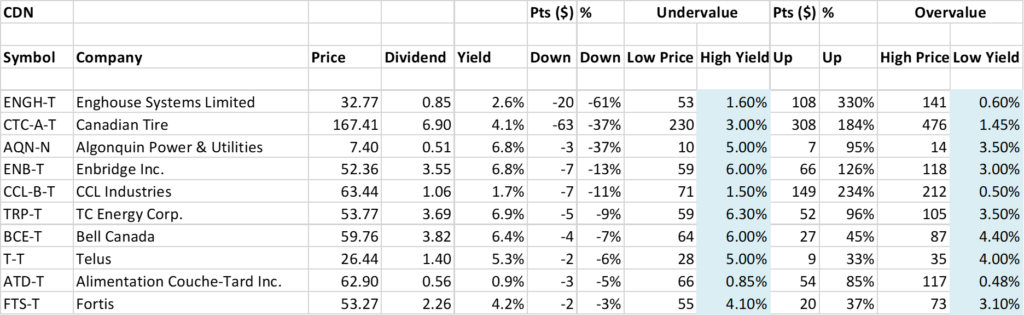
Source: magicpants.ca
I can’t recall a week in the past few years where I’ve seen so many high-quality companies on this list. If the current market decline continues, we may have to bring out our washtub!
Recent News
Bank of Canada maintains policy rate, continues quantitative tightening (Bank of Canada)
https://www.bankofcanada.ca/2023/03/fad-press-release-2023-03-08/
“Governing Council will continue to assess economic developments and the impact of past interest rate increases, and is prepared to increase the policy rate further if needed to return inflation to the 2% target.”
As expected, the Bank of Canada did not raise interest rates last week. As one of the first Central Banks to take this approach, Canada is betting that previous rate hikes will be enough to bring inflation down. They did, however keep the door open for further rate hikes if necessary.
Failure of Silicon Valley Bank stuns tech sector already reeling from downturn (Globe & Mail)
https://www.theglobeandmail.com/business/article-canada-silicon-valley-bank-impact/
“The shutdown of SVB stemmed from its decision in 2021 to pull back on lending and instead stash tens of billions into long-term, low-interest-rate mortgage-backed securities. But as interest rates rose, bond values fell, saddling SVB with a paper loss, which it crystalized when it was forced to sell some bonds for a US$1.8-billion loss.”
This sounded a bit like 2008 to many people, and we know what happened after that.
As of late Sunday night the U.S. Treasury, the Federal Reserve and the Federal Deposit Insurance Corp. said the government would back Silicon Valley Bank deposits beyond the federally insured ceiling of $250,000.
“Depositors will have access to all of their money starting Monday, March 13,” the agencies said in a joint statement Sunday evening. “No losses associated with the resolution of Silicon Valley Bank will be borne by the taxpayer.”
The List (2023)
Last updated by BM on March 10, 2023
The Magic Pants List contains 27 Canadian dividend growth stocks. ‘The List’ contains Canadian companies that have raised their dividend yearly for at least the last ten years and have a market cap of over a billion dollars. Provided below is each stock’s symbol, name, current yield, current price, price return year-to-date, current dividend, dividend growth year-to-date and current dividend growth streak. Companies on ‘The List’ are added or subtracted once a year, on January 1. After that, ‘The List’ is set for the next twelve months. Prices and dividends are updated weekly.
| SYMBOL | COMPANY | YLD | PRICE | YTD % | DIV | YTD % | STREAK |
|---|---|---|---|---|---|---|---|
| AQN-N | Algonquin Power & Utilities | 6.8% | $7.40 | 10.0% | $0.51 | -29.0% | 12 |
| ATD-T | Alimentation Couche-Tard Inc. | 0.9% | $62.90 | 4.6% | $0.56 | 19.1% | 13 |
| BCE-T | Bell Canada | 6.4% | $59.76 | -0.8% | $3.82 | 5.0% | 14 |
| BIP-N | Brookfield Infrastructure Partners | 4.4% | $32.08 | 5.2% | $1.44 | 6.3% | 15 |
| CCL-B-T | CCL Industries | 1.7% | $63.44 | 9.3% | $1.06 | 10.4% | 21 |
| CNR-T | Canadian National Railway | 2.0% | $159.71 | -1.9% | $3.16 | 7.8% | 27 |
| CTC-A-T | Canadian Tire | 4.1% | $167.41 | 14.2% | $6.90 | 17.9% | 12 |
| CU-T | Canadian Utilities Limited | 5.1% | $35.22 | -4.7% | $1.79 | 1.0% | 51 |
| DOL-T | Dollarama Inc. | 0.3% | $77.25 | -3.3% | $0.22 | 2.3% | 12 |
| EMA-T | Emera | 5.2% | $52.75 | 0.2% | $2.76 | 3.0% | 16 |
| ENB-T | Enbridge Inc. | 6.8% | $52.36 | -1.8% | $3.55 | 3.2% | 27 |
| ENGH-T | Enghouse Systems Limited | 2.6% | $32.77 | -8.2% | $0.85 | 18.2% | 16 |
| FNV-N | Franco Nevada | 1.0% | $130.44 | -5.6% | $1.36 | 6.3% | 15 |
| FTS-T | Fortis | 4.2% | $53.27 | -3.7% | $2.26 | 4.1% | 49 |
| IFC-T | Intact Financial | 2.3% | $190.11 | -2.9% | $4.40 | 10.0% | 18 |
| L-T | Loblaws | 1.4% | $115.58 | -3.9% | $1.62 | 5.2% | 11 |
| MGA-N | Magna | 3.5% | $52.51 | -8.7% | $1.84 | 2.2% | 13 |
| MRU-T | Metro | 1.8% | $68.65 | -9.0% | $1.21 | 10.0% | 28 |
| RY-T | Royal Bank of Canada | 4.0% | $133.11 | 4.0% | $5.28 | 6.5% | 12 |
| SJ-T | Stella-Jones Inc. | 1.7% | $55.27 | 11.5% | $0.92 | 15.0% | 18 |
| STN-T | Stantec Inc. | 1.0% | $78.44 | 20.1% | $0.77 | 8.5% | 11 |
| TD-T | TD Bank | 4.6% | $83.77 | -4.4% | $3.84 | 7.9% | 12 |
| TFII-N | TFI International | 1.2% | $121.27 | 21.1% | $1.40 | 29.6% | 12 |
| TIH-T | Toromont Industries | 1.5% | $108.95 | 11.5% | $1.68 | 10.5% | 33 |
| TRP-T | TC Energy Corp. | 6.9% | $53.77 | 0.9% | $3.69 | 3.4% | 22 |
| T-T | Telus | 5.3% | $26.44 | 0.5% | $1.40 | 5.4% | 19 |
| WCN-N | Waste Connections | 0.8% | $131.04 | -0.5% | $1.02 | 7.9% | 13 |
| Averages | 3.2% | 2.0% | 7.3% | 19 |
Six Canadian stocks on ‘The List’ declare earnings and dividends in US dollars and are inter-listed on a US exchange in US dollars. The simplest way to display dividend and price metrics for these stocks is to show their US exchange symbols along with their US dividends and price. The stocks I am referring to have a -N at the end of their symbols. You can still buy their Canadian counterparts (-T), but your dividends will be converted into CDN dollars and will fluctuate based on the exchange rate.
Note: When the currency of the dividend and share price match, the calculation is straightforward. But it’s not so simple when the dividend is declared in one currency and the share price is quoted in another. Dividing the former by the latter would produce a meaningless result because it’s a case of apples and oranges. To calculate the yield properly, you would need to express the dividend and share price in the same currency.
Performance of ‘The List’
Feel free to click on this link, ‘The List’ for a sortable version from our website.
Last week, ‘The List’ was down sharply with a YTD price return now of +2.0% (capital), while its dividend growth jumped to +7.3% YTD, highlighting growth in income over the past year.
The best performers last week on ‘The List’ were Stella-Jones Inc. (SJ-T), up +8.86%; Dollarama Inc. (DOL-T), up +0.39%; and Canadian Utilities Limited (CU-T), up +0.26%.
Enghouse Systems Limited (ENGH-T) was the worst performer last week, down -24.49%.
Dividend Increases
“The growth of dividend paying ability is of significance in the determination of a stock’s quality, or general safety…”
– Arnold Bernhard (the founder of Value Line)
“As a dividend increase is a positive sign of a company’s financial strength, the safest purchase, after research, is a stock with a recent dividend increase.”
– Tom Connolly (the founder of dividendgrowth.ca)
Last week, there were two dividend increases from companies on ‘The List’.
Stella-Jones Inc. (SJ-T) on Wednesday, March 8, 2023, said it increased its 2023 quarterly dividend from $0.20 to $0.23 per share, payable April 21, 2023, to shareholders of record on April 3, 2023.
This represents a dividend increase of +15.0%, marking the 19th straight year of dividend growth for this quality lumber and wood product manufacturer.
Enghouse Systems Limited (ENGH-T) on Thursday, March 9, 2023, said it increased its 2023 quarterly dividend from $0.185 to $0.22 per share, payable May 31, 2023, to shareholders of record on May 17, 2023.
This represents a dividend increase of +18.9%, marking the 17th straight year of dividend growth for this quality provider of software and services.
Earnings Releases
Benjamin Graham once remarked that earnings are the principal factor driving stock prices.
Each quarter we will provide readers with weekly earnings updates of stocks on ‘The List’ during the calendar earnings season. Q4 2022 will come to an end this week, and we are now seeing the beginning of the next earnings season with (ATD-T) reporting. Not all companies on ‘The List’ follow the calendar year schedule.
The updated earnings calendar can be found here.
Earnings growth and dividend growth tend to go hand in hand, so this information can tell us a lot about the future dividend growth of our quality companies. Monitoring our dividend growers periodically is part of the process, and reading the quarterly earnings releases is a good place to start.
Three companies on ‘The List’ are due to report earnings this week.
Franco Nevada (FNV-N) will release its fourth-quarter 2022 results on Wednesday, March 15, 2023, after markets close.
Alimentation Couche-Tard Inc. (ATD-T) will release its third-quarter 2023 results on Wednesday, March 15, 2023, after markets close.
Algonquin Power & Utilities (AQN-N) will release its fourth-quarter 2022 results on Friday, March 17, 2023, before markets open.
Last week, two companies on ‘The List’, reported their earnings.
Stella-Jones Inc. (SJ-T) released its fourth-quarter 2022 results on Wednesday, March 8, 2023, before markets opened.
“Stella-Jones concluded 2022 on a very strong note, and I am proud of the robust performance we delivered as a Company. Our fourth quarter sales continued their upward trajectory, reflecting more than a 25% organic increase in utility poles sales, sustained growth in railway ties sales and better than anticipated residential lumber sales. Our exceptional results in 2022 can be credited to several contributors, from the efforts of our dedicated team to our expansive North American network. In a year of challenging market and macroeconomic conditions, our proven ability to procure the fibre required to meet customer demand and pass through cost increases were true keystones of our success, and a testament to the resilient character of our business model.”
– President and Chief Executive Officer, Eric Vachon
Highlights:
- Sales of $3,065 million, up 11%, driven by infrastructure-related product category sales
- EBITDA up 12% to $448 million, from $400 million in 2021
- Net income reached $241 million, or $3.93 per share
- Acquired wood utility pole manufacturing business of Texas Electric Cooperatives, Inc.
- Quarterly cash dividend increased 15% to $0.23 per share
Outlook:
“2022 marks a 22nd consecutive year of increased sales for Stella-Jones and the completion of the first year of our three-year plan, marked by exceptional utility poles sales growth, which we expect will continue in 2023. From where we stand, we are well on our way to meet or exceed our objectives, and remain favourably positioned for the future, with continued growth in sales, profitability and in turn, shareholder value.”
– President and Chief Executive Officer, Eric Vachon

Source: (SJ-T) Q4-2022 Earnings Release
Enghouse Systems Limited (ENGH-T) released its first-quarter 2023 results on Thursday, March 9, 2023, after markets closed.
“Over the last four quarters, revenue in both the Asset and Interactive Management Groups has stabilized significantly, particularly in comparison to the revenue fluctuations that were driven by changing demands throughout the COVID-19 pandemic. Despite the ongoing shift to the cloud, inflation, rising interest rates, economic uncertainty and some competitors experiencing significant financial distress announcing restructuring and employee layoffs, Enghouse continues to operate consistently with positive income and operating cashflows. Enghouse remains well positioned to complete and fund future acquisitions. Subsequent to quarter end, we announced the acquisitions of Qumu and Navita with integrations progressing according to plan.”
– Stephen J. Sadler, Chairman and Chief Executive Officer
Highlights:
- Revenue achieved was $106.4 million compared to revenue of $111.1 million;
- Results from operating activities was $29.9 million compared to $35.7 million;
- Net income was $17.0 million compared to $21.6 million;
- Adjusted EBITDA was $32.3 million compared to $38.6 million;
- Cash flows from operating activities excluding changes in working capital were $32.6 million compared to $38.7 million.
Outlook:
Enghouse remains focused on its long-term growth strategy, investing in products while ensuring profitability and maximizing operating cashflows. As a result, Enghouse continues to replenish its acquisition capital while annually increasing its eligible quarterly dividend.
MP Market Review – March 03, 2023
Last updated by BM on March 06, 2023
Summary
- This is a weekly installment of our MP Market Review series, which provides updates on the financial markets and Canadian dividend growth companies we monitor on ‘The List’.
- Last week, ‘The List’ was up slightly with a YTD price return of +5.4% (capital), while its dividend growth remained the same at +6.2% YTD, highlighting growth in income over the past year.
- Last week, there were no dividend increases from companies on ‘The List’.
- Last week, there were three earnings reports from companies on ‘The List’.
- Two companies on ‘The List’ are due to report earnings this week.
- If you’re interested in creating your own income portfolio, consider subscribing to our premium service, which grants you access to the MP Wealth-Builder Model Portfolio (CDN) and exclusive subscriber-only content. Learn More
Introduction
“You have a pair of pants. In the left pocket, you have a $100. You take $1 out of the left pocket and put in the right pocket. You now have a $101. There is no diminution of dollars in your left pocket. That is one magic pair of pants.”
This ‘magic pants’ analogy was from a Seeking Alpha article on dividend investing I read about a decade ago and was one of the catalysts for me to take a closer look at this type of investing and see if it truly was magical.
After conducting additional research, I have shifted towards utilizing a dividend growth investing (DGI) strategy as my primary investment approach. While I maintain portfolios consisting of high-quality dividend growers from both the United States and Canada, I have opted to concentrate on Canadian (CDN) dividend growth companies in this blog. This is due to several reasons, including a smaller pool of DGI companies to track, a lack of coverage for the DGI strategy by Canadian investment media, and a tendency for those who do cover DGI to narrowly focus on only a handful of sectors (Energy and Financials).
While ‘The List’ is not a portfolio in itself, it serves as an excellent initial reference for individuals seeking to diversify their investments and attain higher returns in the Canadian stock market. Through our blog, we provide weekly updates on ‘The List’ and offer valuable perspectives and real-life examples of the dividend growth investing strategy in practice. This helps readers gain a deeper understanding of how to implement and benefit from this investment approach.
DGI Thoughts
“Charlie and I are not stock-pickers; we are business pickers.”
– Warren Buffett, Berkshire Hathaway Inc. Annual Report (2022)
I always enjoy reading the Berkshire Hathaway Inc. Annual Report. Great insight from one of the greatest investors of our era. As it turns out, there are a few tidbits of wisdom for dividend growth investors in this year’s report. More on Berkshire Hathaway Inc. and its Annual Report in the ‘Recent News’ portion of this week’s review.
Like Buffett, we are business- pickers, and we like quality businesses. One of the best ways we have found to ‘pick’ a quality dividend growth business is to look at its historical and estimated ‘Growth Yield’ or ‘Yield on Cost’. Here is a chart for you to see at a glance what it takes to get to a 7% return (on dividends alone) within ten years.

Source: magicpants.ca
The table illustrates the possible outcomes of combining initial yields (shown across the top) and annual growth rates (displayed on the left side) to attain the target. Whenever two values meet, the table indicates the number of years needed to achieve a 7% income return from dividends alone. The shaded cells represent those combinations that take 10 years or less to hit the target.
To illustrate, a 3% initial yield that grows at a rate of 9% per year, as well as a 4% initial yield that increases at 6% annually, both result in a 7% ‘Growth Yield’ within a decade, making them both viable combinations.
The 7×10 table focuses solely on income and disregards the influence of price hikes. It also doesn’t account for the compounding effect of reinvesting dividends, which would have reduced the shown timelines. The table only displays the rise in ‘Growth Yield’ due to the growth in the dividend.
As a part of our selection process, we use ‘Growth Yield’ as a quality indicator. Although not mandatory for all businesses in your portfolio to fulfill the 7×10 criterion, our past experience has demonstrated that a considerable number of businesses that meet this metric are likely to achieve market-beating returns.
For more info on ‘Growth Yield’, see one of our top posts: Using Growth Yield (YOC) To Build Powerful DGI Portfolios
Recent News
Berkshire Hathaway Annual Report (2022) https://www.berkshirehathaway.com/2022ar/2022ar.pdf
In reading this year’s annual report, I noticed a few comments from Buffett that were worth pointing out to dividend growth investors.
In the ‘Secret Sauce’ section of the report, Buffett mentions two of his long-term holdings, Coca-Cola and American Express, and laments on how much their dividends and capital have grown in thirty years compared to a comparable fixed income investment of a 30-year bond with a fixed rate of return.
“The cash dividend we received from Coke in 1994 was $75 million. By 2022, the dividend had increased to $704 million.Growth occurred every year, just as certain as birthdays. All Charlie and I were required to do was cash Coke’s quarterly dividend checks. We expect that those checks are highly likely to grow.
American Express is much the same story. Berkshire’s purchases of Amex were essentially completed in 1995 and, coincidentally, also cost $1.3 billion. Annual dividends received from this investment have grown from $41 million to $302 million. Those checks, too, seem highly likely to increase.
These dividend gains, though pleasing, are far from spectacular. But they bring with them important gains in stock prices.
Assume, for a moment, I had made a similarly-sized investment mistake in the 1990s, one that flat-lined and simply retained its $1.3 billion value in 2022. (An example would be a high-grade 30-year bond.) That disappointing investment would now represent an insignificant 0.3% of Berkshire’s net worth and would be delivering to us an unchanged $80 million or so of annual income.”
Buffett agrees with how dependable dividend growth can be from a quality company and that a rising dividend income stream will eventually lead to rising stock prices.
In the report, we also gained some understanding of Buffett’s investment timeline, in which he expressed, “At Berkshire, there will be no finish line.”
Frequently, we become fixated on our retirement plans and the specific time when we will retire, causing us to make unfavourable investment choices. Patrick Keogh explores this issue in his book, Make Your Family Rich. Keogh views dividend growth investing as a method of succession planning for a company (the Keogh Family Office), and he regards it as more of a process than a destination. Thinking of what we do as dividend growth investors in the same way a company plans for succession allows us to lengthen our investing timeline and let our process play out.
Selecting high-quality companies, recognizing that increasing dividends results in increasing stock prices, and having a long-term perspective that extends indefinitely – these are the shared principles of both dividend growth investors and one of the most exceptional investors of our era.
What if interest rates stay high for a few years? (Globe & Mail)
“What would you do if inflation and interest rates remained high, not just for the rest of this year, but for a few years to come?”
The author provides analysis and logic as to why we still have a long way to go before interest rates begin to decline. Preparing for this probable outcome would be prudent.
The List (2023)
Last updated by BM on March 03, 2023
The Magic Pants List contains 27 Canadian dividend growth stocks. ‘The List’ contains Canadian companies that have raised their dividend yearly for at least the last ten years and have a market cap of over a billion dollars. Provided below is each stock’s symbol, name, current yield, current price, price return year-to-date, current dividend, dividend growth year-to-date and current dividend growth streak. Companies on ‘The List’ are added or subtracted once a year, on January 1. After that, ‘The List’ is set for the next twelve months. Prices and dividends are updated weekly.
| SYMBOL | COMPANY | YLD | PRICE | YTD % | DIV | YTD % | STREAK |
|---|---|---|---|---|---|---|---|
| AQN-N | Algonquin Power & Utilities | 6.5% | $7.82 | 16.2% | $0.51 | -29.0% | 12 |
| ATD-T | Alimentation Couche-Tard Inc. | 0.9% | $65.30 | 8.6% | $0.56 | 19.1% | 13 |
| BCE-T | Bell Canada | 6.3% | $60.50 | 0.4% | $3.82 | 5.0% | 14 |
| BIP-N | Brookfield Infrastructure Partners | 4.4% | $32.95 | 5.2% | $1.44 | 6.3% | 15 |
| CCL-B-T | CCL Industries | 1.6% | $65.37 | 12.6% | $1.06 | 10.4% | 21 |
| CNR-T | Canadian National Railway | 1.9% | $162.17 | -0.4% | $3.16 | 7.8% | 27 |
| CTC-A-T | Canadian Tire | 4.0% | $170.80 | 16.5% | $6.90 | 17.9% | 12 |
| CU-T | Canadian Utilities Limited | 5.1% | $35.13 | -4.9% | $1.79 | 1.0% | 51 |
| DOL-T | Dollarama Inc. | 0.3% | $76.95 | -3.6% | $0.22 | 2.3% | 12 |
| EMA-T | Emera | 5.1% | $53.82 | 2.3% | $2.76 | 3.0% | 16 |
| ENB-T | Enbridge Inc. | 6.7% | $52.83 | -0.9% | $3.55 | 3.2% | 27 |
| ENGH-T | Enghouse Systems Limited | 1.7% | $43.40 | 21.5% | $0.74 | 3.5% | 16 |
| FNV-N | Franco Nevada | 1.0% | $136.78 | -1.0% | $1.36 | 6.3% | 15 |
| FTS-T | Fortis | 4.1% | $54.50 | -1.5% | $2.26 | 4.1% | 49 |
| IFC-T | Intact Financial | 2.3% | $195.54 | -0.1% | $4.40 | 10.0% | 18 |
| L-T | Loblaws | 1.4% | $116.80 | -2.9% | $1.62 | 5.2% | 11 |
| MGA-N | Magna | 3.2% | $57.09 | -0.7% | $1.84 | 2.2% | 13 |
| MRU-T | Metro | 1.7% | $70.24 | -6.9% | $1.21 | 10.0% | 28 |
| RY-T | Royal Bank of Canada | 3.9% | $136.75 | 6.8% | $5.28 | 6.5% | 12 |
| SJ-T | Stella-Jones Inc. | 1.6% | $50.77 | 2.4% | $0.80 | 0.0% | 18 |
| STN-T | Stantec Inc. | 1.0% | $79.82 | 22.2% | $0.77 | 8.5% | 11 |
| TD-T | TD Bank | 4.3% | $89.05 | 1.6% | $3.84 | 7.9% | 12 |
| TFII-N | TFI International | 1.1% | $125.59 | 25.4% | $1.40 | 29.6% | 12 |
| TIH-T | Toromont Industries | 1.5% | $113.21 | 15.9% | $1.68 | 10.5% | 33 |
| TRP-T | TC Energy Corp. | 6.6% | $56.18 | 5.4% | $3.69 | 3.4% | 22 |
| T-T | Telus | 5.1% | $27.31 | 3.8% | $1.40 | 5.4% | 19 |
| WCN-N | Waste Connections | 0.8% | $134.14 | 1.8% | $1.02 | 7.9% | 13 |
| Averages | 3.1% | 5.4% | 6.2% | 19 |
Six Canadian stocks on ‘The List’ declare earnings and dividends in US dollars and are inter-listed on a US exchange in US dollars. The simplest way to display dividend and price metrics for these stocks is to show their US exchange symbols along with their US dividends and price. The stocks I am referring to have a -N at the end of their symbols. You can still buy their Canadian counterparts (-T), but your dividends will be converted into CDN dollars and will fluctuate based on the exchange rate.
Note: When the currency of the dividend and share price match, the calculation is straightforward. But it’s not so simple when the dividend is declared in one currency and the share price is quoted in another. Dividing the former by the latter would produce a meaningless result because it’s a case of apples and oranges. To calculate the yield properly, you would need to express the dividend and share price in the same currency.
Performance of ‘The List’
Feel free to click on this link, ‘The List’ for a sortable version from our website.
Last week, ‘The List’ was up slightly with a YTD price return of +5.4% (capital), while its dividend growth remained the same at +6.2% YTD, highlighting growth in income over the past year.
The best performers last week on ‘The List’ were Franco Nevada (FNV-N), up +9.19%; Stella-Jones Inc. (SJ-T), up +6.77%; and Magna (MGA-N), up +6.12%.
Canadian Utilities Limited (CU-T) was the worst performer last week, down -3.25%.
Dividend Increases
“The growth of dividend paying ability is of significance in the determination of a stock’s quality, or general safety…”
– Arnold Bernhard (the founder of Value Line)
“As a dividend increase is a positive sign of a company’s financial strength, the safest purchase, after research, is a stock with a recent dividend increase.”
– Tom Connolly (the founder of dividendgrowth.ca)
Last week, there were no dividend increases from companies on ‘The List’.
Earnings Releases
Benjamin Graham once remarked that earnings are the principal factor driving stock prices.
Each quarter we will provide readers with weekly earnings updates of stocks on ‘The List’ during the calendar earnings season. Q4 2022 is just about over and we are now seeing the beginning of the next earnings season with a couple of banks reporting this week.
The updated earnings calendar can be found here.
Earnings growth and dividend growth tend to go hand in hand, so this information can tell us a lot about the future dividend growth of our quality companies. Monitoring our dividend growers periodically is part of the process, and reading the quarterly earnings releases is a good place to start.
Two companies on ‘The List’ is due to report earnings this week.
Stella-Jones Inc. (SJ-T) will release its fourth-quarter 2022 results on Wednesday, March 8, 2023, before markets open.
Enghouse Systems Limited (ENGH-T) will release its first-quarter 2023 results on Thursday, March 9, 2023, after markets close.
Last week, three companies on ‘The List’, reported their earnings.
Royal Bank of Canada (RY-T) released its first-quarter 2023 results on Wednesday, March 1, 2023, before markets opened.
“In a complex and uncertain world, RBC is relentlessly focused on bringing leadership, stability and advice to our clients and communities. As our first quarter results demonstrate, we are prudently managing risk while delivering strong revenue growth driven by our diversified business model. Looking ahead, RBC’s premium businesses, robust balance sheet and strategic advantages will allow us to continue transforming our bank for the future and creating value for our clients, communities and shareholders.”
– President and Chief Executive Officer, Dave McKay
Highlights:
Q1 2023 vs. Q1 2022
- Net income of $3,214 million was down $881 million or 22% from a year ago.
- Diluted EPS of $2.29 was down $0.55 or 19% and ROE of 12.6% was down from 17.3% last year.
- Our CET1 ratio of 12.7% was down 80 bps from a year ago.
- Excluding the specified item for the impact of the CRD and other tax related adjustments as described below, net income of $4,264 million was up $169 million or 4% from a year ago.
- Excluding the specified item, diluted EPS of $3.05 was up $0.21 or 7% and ROE of 16.8% was down from 17.3% last year.
- Our earnings were down from last year, primarily driven by the specified item, which is reported in Corporate Support.
- Excluding the impact of the specified item, net income increased from last year driven by higher earnings in Personal & Commercial Banking, Capital Markets and Wealth Management, partially offset by lower results in Insurance.
Q1 2023 vs. Q4 2022
- Net income of $3,214 million was down $668 million or 17% from last quarter.
- Diluted EPS of $2.29 was down $0.45 or 16% and ROE of 12.6% down from 15.6% in the prior quarter.
- Our CET1 ratio of 12.7% was up 10 bps from last quarter.
- Excluding the specified item, net income of $4,264 million was up $382 million or 10% from last quarter.
- Excluding the specified item, diluted EPS of $3.05 was up $0.31 or 11% and ROE of 16.8% was up from 15.6% last quarter.
- Our earnings were down from last quarter, primarily driven by the specified item, which is reported in Corporate Support.
- Excluding the impact of the specified item, net income increased from last quarter driven by higher earnings in Capital Markets and Wealth Management, partially offset by lower results in Insurance and Personal & Commercial Banking.
Outlook:
Unemployment remains very low across most advanced economies with labour shortages limiting further increases in production and pushing wages higher. However, we expect unemployment rates will rise as higher interest rates and elevated inflation add to growth headwinds. Global inflation pressures have eased with the price of key commodities and shipping costs declining from peak levels in calendar 2022 and the breadth of inflation pressures across goods and services has shown signs of narrowing. Most advanced economy central banks are likely at or close to the end of interest rate increases. However, the lagged impact of aggressive increases in interest rates in calendar 2022 will continue to increase household and business borrowing costs in calendar 2023. The U.S., Canadian, and U.K. economies are expected to undergo moderate recessions in calendar 2023. GDP in the Euro area is expected to grow but at a slow pace in calendar 2023 with higher interest rates adding to inflation and disruptions from the war in Ukraine.
Source: (RY-T) Q1-2023 Earnings Release
TD Bank (TD-T) released its first-quarter 2023 results on Thursday, March 2, 2023, before markets opened.
“TD had a strong start to 2023 with Canadian and U.S. retail businesses delivering robust revenue growth and record earnings, demonstrating the benefits of our diversified business mix,” said Bharat Masrani, Group President and Chief Executive Officer, TD Bank Group. “We continued to invest to strengthen our businesses and deliver the legendary customer experiences our customers and clients have come to expect from TD.” “Yesterday, we announced the close of the Cowen Inc. acquisition, an important step forward in the expansion of our global dealer. TD Securities now has 6,500 colleagues in 40 cities around the world and is able to serve clients with an even broader product and services offering,” added Masrani.
– Bharat Masrani, Group President and Chief Executive Officer
Highlights:
Q1 2023 vs. Q1 2022
- Reported diluted earnings per share were $0.82, compared with $2.02.
- Adjusted diluted earnings per share were $2.23, compared with $2.08.
- Reported net income was $1,582 million, compared with $3,733 million.
- Adjusted net income was $4,155 million, compared with $3,833 million.
Acquisition of Cowen Inc.
On March 1, 2023, the Bank completed the acquisition of Cowen Inc. (“Cowen”). The results of the acquired business will be consolidated by the Bank from the closing date and primarily reported in the Wholesale Banking segment.
Outlook:
Pending Acquisition of First Horizon Corporation
On February 9, 2023, the parties announced they had mutually agreed to extend the outside date to May 27, 2023, in accordance with the terms of the merger agreement. The closing of the transaction is subject to customary closing conditions, including approvals from U.S. and Canadian regulatory authorities, which now are not expected to be obtained prior to May 27, 2023. Regulatory approvals are not within the Bank’s control. If the merger does not close by May 27, 2023, then an amendment to the merger agreement would be required to further extend the outside date. TD and First Horizon are discussing a potential further extension.
Source: (TD-T) Q1-2023 Earnings Release
Canadian Utilities Limited (CU-T) released its fourth-quarter 2022 results on Thursday, March 2, 2023, before markets opened.
“First of all, 2022 saw us deliver on significant year-over-year earnings growth. Our Alberta distribution utilities unlocked significant efficiencies that will in turn create meaningful savings for customers going forward. It was also another successful year of operations for our LUMA Energy business, with numerous achievements in the support of the Company’s commitment of rebuilding and modernizing the electricity transmission and distribution system in Puerto Rico.
These successes ultimately cumulated into the extension of LUMA’s supplemental operating agreement, allowing critical work the team is doing for the people of Puerto Rico to continue. We’ve also made significant strides in the execution of our energy transition strategy with the completed acquisition of a major renewable generation portfolio and related development pipeline. While continuing to advance a number of our other ongoing energy transition investments, including our Alberta based solar initiatives and our ongoing hydrogen initiatives in the Alberta heartland.”
– Brian Shkrobot, Executive Vice President and Chief Financial Officer
Highlights:
- Adjusted earnings in 2022 of $655 million ($2.43 per share), which were $69 million ($0.26 per share) higher compared to $586 million ($2.17 per share) in 2021.
- Fourth quarter adjusted earnings in 2022 of $180 million ($0.66 per share) were $12 million ($0.05 per share) lower compared to $192 million ($0.71 per share) in the fourth quarter of 2021.
- Invested $452 million in capital expenditures in the fourth quarter of 2022, of which 85 per cent was invested in regulated utilities and 15 per cent mainly in Energy Infrastructure.
- Subsequent to year-end, on January 3, 2023, Canadian Utilities closed the previously announced acquisition of a portfolio of wind and solar assets and development projects located in Alberta and Ontario from Suncor Energy Inc. Concurrent with the close of this acquisition, Canadian Utilities entered into a new 15-year renewable energy purchase agreement with Microsoft Corporation. Under the terms of the agreement, Microsoft will purchase 150-MW per year of renewable energy generated by the Forty Mile Wind Phase 1 Project in Alberta, acquired as part of the acquisition from Suncor.
- In December 2022, The Yukon Electrical Company Limited, a subsidiary of Canadian Utilities, and Copper Niisüü Limited Partnership (CNLP), finalized a landmark Electricity Purchase Agreement to underpin the Saa Sè Energy Project in Beaver Creek and enhance energy autonomy for White River First Nation. Under the terms of the agreement, CNLP will build, own and operate the Beaver Creek solar facility. Upon completion, Canadian Utilities will purchase the solar electricity generated, connect it to the grid and redistribute it back to the community. The facility is expected to be fully operational by 2024.
- In December 2022, Canadian Utilities announced the commissioning of two hydrogen projects at the Clean Energy Innovation Hub in Australia. These include the blending of hydrogen into the Western Australian (WA) natural gas network and the first hydrogen fuelling station in partnership with Fortescue Future Industries. This will enable Fortescue, Canadian Utilities and third parties such as the WA Police to support their fleets of hydrogen fuel cell vehicles.
- Subsequent to year-end, on February 3, 2023, Canadian Utilities executed an extension to the current Power Purchase Agreement with Origin Energy Electricity Limited (Origin) for the Osborne electricity cogeneration facility in South Australia. The extension is for a period of three years, commencing on January 1, 2024, with an option for Origin to extend the term until December 31, 2027.
- On January 12, 2023, Canadian Utilities declared a first quarter dividend of 44.86 cents per share or $1.79 per Class A non-voting and Class B common share on an annualized basis, a 1 per cent increase over the 44.42 cents per share paid in each of the four previous quarters. Canadian Utilities has increased its dividend per share for 51 consecutive years, the longest track record of annual dividend increases of any publicly traded Canadian company.
Outlook:
“We expect to invest $3.3 billion in our regulated utilities over the next three years. While utility operations are the largest contributor to our earnings and will remain so for many years to come, we will also be actively investing in our energy transition growth initiatives in the coming years. Our ongoing hydrogen initiatives with Suncor, our continued pursuit of a potential energy storage investment in Australia, and are successful execution of the acquired 1.5 gigawatts of renewable generation pipeline will all necessitate significant capital investment and drive growth for our business.”
– Brian Shkrobot, Executive Vice President and Chief Financial Officer
Source: (CU-T) Q4-2022 Earnings Release

I’ll coach you on how to identify high-quality individual dividend growth stocks when they are sensibly priced, and hold them for the growing income.