MP Market Review – July 28, 2023
Last updated by BM on July 31, 2023
Summary
- This is a weekly installment of our MP Market Review series, which provides updates on the financial markets and Canadian dividend growth companies we monitor on ‘The List’.
- Last week, ‘The List’ was down with a YTD price return of +5.4% (capital). Dividend growth remained the same and is now at +8.4% YTD, highlighting growth in income over the past year.
- Last week, no dividend increases from companies on ‘The List’.
- Last week, five earnings reports from companies on ‘The List’.
- Nine companies on ‘The List’ are due to report earnings this week.
- If you’re interested in creating your own dividend growth income portfolio, consider subscribing to our premium service, which grants you access to the MP Wealth-Builder Model Portfolio (CDN) and exclusive subscriber-only content. Learn More
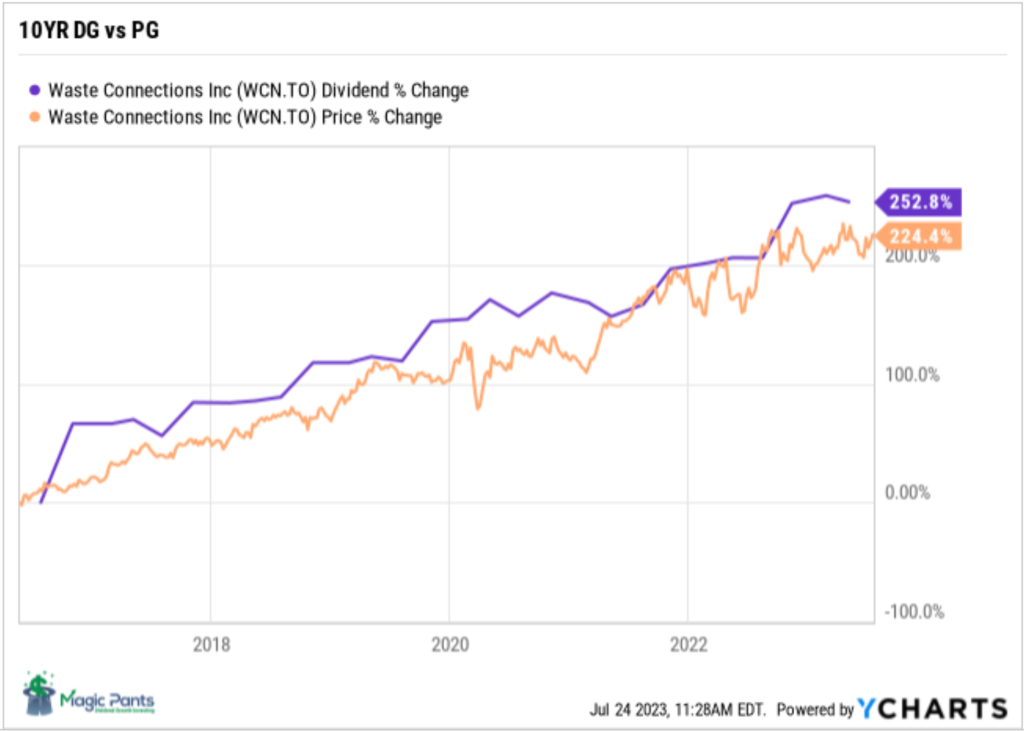
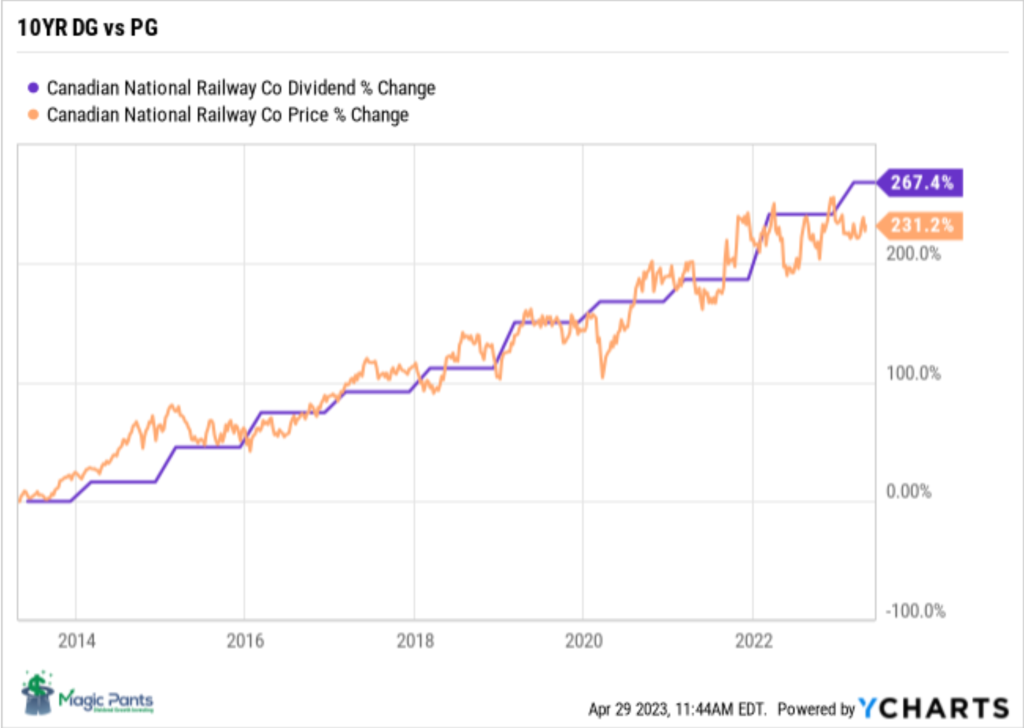
Identifying companies whose dividend growth aligns closely with price growth can considerably enhance the predictability of future returns. Dividend growth investors know that the dividend drives the price in a predictable way, not the other way around. Waste Connections (WCN-T) is another company on ‘The List’ that follows this dividend growth principle.
Introduction
“You have a pair of pants. In the left pocket, you have $100. You take $1 out of the left pocket and put it in the right pocket. You now have $101. There is no diminution of dollars in your left pocket. That is one magic pair of pants.”
This ‘magic pants’ analogy was from a Seeking Alpha article on dividend investing I read about a decade ago and was one of the catalysts for me to take a closer look at this type of investing and see if it truly was magical.
After conducting additional research, I have shifted towards utilizing a dividend growth investing (DGI) strategy as my primary investment approach. While I maintain portfolios consisting of high-quality dividend growers from both the United States and Canada, I have opted to concentrate on Canadian (CDN) dividend growth companies in this blog. This is due to several reasons, including a smaller pool of DGI companies to track, a lack of coverage for the DGI strategy by the North American investment media, and a tendency for those who do cover DGI to narrowly focus on only a handful of sectors (Energy and Financials).
While ‘The List’ is not a portfolio in itself, it serves as an excellent initial reference for individuals seeking to diversify their investments and attain higher returns in the Canadian stock market. Through our blog, we provide weekly updates on ‘The List’ and offer valuable perspectives and real-life examples of the dividend growth investing strategy in practice. This helps readers gain a deeper understanding of how to implement and benefit from this investment approach.
DGI Thoughts
“A stock providing an increasing cash flow becomes more valuable regardless of what the market is doing.”
-Tom Connolly, dividendgrowth.ca
Trying to predict the market moves in the short term never ends well. Having a process, however, tilts the odds in your favour. Eight of our eleven purchases for 2023, in the model portfolio, are up since we decided to pull the trigger, with two companies (TFII-N and MGA-N) up over 20%! On the flip side, we have been buying TC Energy (TRP-T) as it continues to wilt due to short term narratives.
We like these comments from TC Energy management in their recent earnings report.
“Reaffirming 2023 outlook and dividend declaration We reaffirm our 2023 comparable EBITDA growth outlook of five to seven per cent relative to 2022, while comparable earnings per common share is expected to be modestly higher than 2022, showcasing the resiliency and sustainability of our earnings and cash flows.”
“We expect to continue to grow the common share dividend at an annual rate of three to five per cent, enabling our shareholders to benefit from our growth and success in the coming years.”
A yield now north of 8% with growing cash flow is hard to pass on. We will however be prudent and keep our position size in line with our business plan and collect our income while we see how this one plays out.
If you have not yet joined as a paid subscriber of the blog to receive DGI Alerts on the activity and content related to our model portfolio, it’s not too late. Click Here.
Recent News
Sensing end of Fed hikes, some U.S. investors return to dividend stocks (Globe & Mail)
“We’re looking for companies that may not have the highest yield, but the capacity to grow yields down the line” due to their larger earnings base.”
Good advice from this author.
DBRS Says TC Energy’s Planned Spinoff of Liquids Business Has No Impact On Ratings, July 28, 2023 12:52
12:52 PM EDT, 07/28/2023 (MT Newswires) — DBRS said Friday that TC Energy’s (TRP-T) planned spinoff of its liquids pipelines business into a separately listed company does not have an impact on the company’s ratings.
“The spinoff has a modestly negative impact on TC Energy’s business risk profile because of the loss of diversification,” the rating agency said. “Nevertheless, DBRS Morningstar foresees the Company’s business risk profile post spinoff remaining strong, underpinned by regulated/contracted cash flows, strong supply and demand fundamentals at its natural gas pipelines and power businesses, and an asset base that is still very diversified despite the spinoff.”
Depending on who you listen to, the news of TC Energy’s spinoff plans next year are being viewed as neutral to slightly negative. With a positive earnings report that met analyst expectations for the most part, we are in the wait and see category right now.
To receive breaking news about companies on ‘The List’ follow us on Twitter @MagicPants_DGI.
The List (2023)
Last updated by BM on July 28, 2023
The Magic Pants List contains 27 Canadian dividend growth stocks. ‘The List’ contains Canadian companies that have raised their dividend yearly for at least the last ten years and have a market cap of over a billion dollars. Below is each stock’s symbol, name, current yield, current price, price return year-to-date, current dividend, dividend growth year-to-date and current dividend growth streak. Companies on ‘The List’ are added or subtracted once a year, on January 1. After that, ‘The List’ is set for the next twelve months. Prices and dividends are updated weekly.
| SYMBOL | COMPANY | YLD | PRICE | YTD % | DIV | YTD % | STREAK |
|---|---|---|---|---|---|---|---|
| AQN-N | Algonquin Power & Utilities | 6.2% | $8.17 | 21.4% | $0.51 | -29.0% | 12 |
| ATD-T | Alimentation Couche-Tard Inc. | 0.8% | $66.69 | 10.9% | $0.56 | 19.1% | 13 |
| BCE-T | Bell Canada | 6.7% | $57.04 | -5.3% | $3.82 | 5.0% | 14 |
| BIP-N | Brookfield Infrastructure Partners | 4.4% | $35.28 | 5.2% | $1.44 | 6.3% | 15 |
| CCL-B-T | CCL Industries | 1.7% | $63.61 | 9.6% | $1.06 | 10.4% | 21 |
| CNR-T | Canadian National Railway | 2.0% | $159.91 | -1.8% | $3.16 | 7.8% | 27 |
| CTC-A-T | Canadian Tire | 3.8% | $182.60 | 24.6% | $6.90 | 17.9% | 12 |
| CU-T | Canadian Utilities Limited | 5.5% | $32.90 | -10.9% | $1.79 | 1.0% | 51 |
| DOL-T | Dollarama Inc. | 0.3% | $87.15 | 9.1% | $0.27 | 23.8% | 12 |
| EMA-T | Emera | 5.1% | $54.30 | 3.2% | $2.76 | 3.0% | 16 |
| ENB-T | Enbridge Inc. | 7.4% | $48.19 | -9.6% | $3.55 | 3.2% | 27 |
| ENGH-T | Enghouse Systems Limited | 2.8% | $30.27 | -15.2% | $0.85 | 18.2% | 16 |
| FNV-N | Franco Nevada | 0.9% | $144.12 | 4.3% | $1.36 | 6.3% | 15 |
| FTS-T | Fortis | 4.0% | $56.06 | 1.3% | $2.26 | 4.1% | 49 |
| IFC-T | Intact Financial | 2.2% | $198.09 | 1.2% | $4.40 | 10.0% | 18 |
| L-T | Loblaws | 1.5% | $116.75 | -3.0% | $1.74 | 10.3% | 11 |
| MGA-N | Magna | 2.9% | $63.75 | 10.8% | $1.84 | 2.2% | 13 |
| MRU-T | Metro | 1.7% | $71.51 | -5.3% | $1.21 | 10.0% | 28 |
| RY-T | Royal Bank of Canada | 4.1% | $130.31 | 1.8% | $5.34 | 7.7% | 12 |
| SJ-T | Stella-Jones Inc. | 1.4% | $67.02 | 35.2% | $0.92 | 15.0% | 18 |
| STN-T | Stantec Inc. | 0.9% | $89.31 | 36.7% | $0.77 | 8.5% | 11 |
| TD-T | TD Bank | 4.5% | $86.08 | -1.8% | $3.84 | 7.9% | 12 |
| TFII-N | TFI International | 1.1% | $127.50 | 27.3% | $1.40 | 29.6% | 12 |
| TIH-T | Toromont Industries | 1.5% | $112.25 | 14.9% | $1.68 | 10.5% | 33 |
| TRP-T | TC Energy Corp. | 8.2% | $45.25 | -15.1% | $3.69 | 3.4% | 22 |
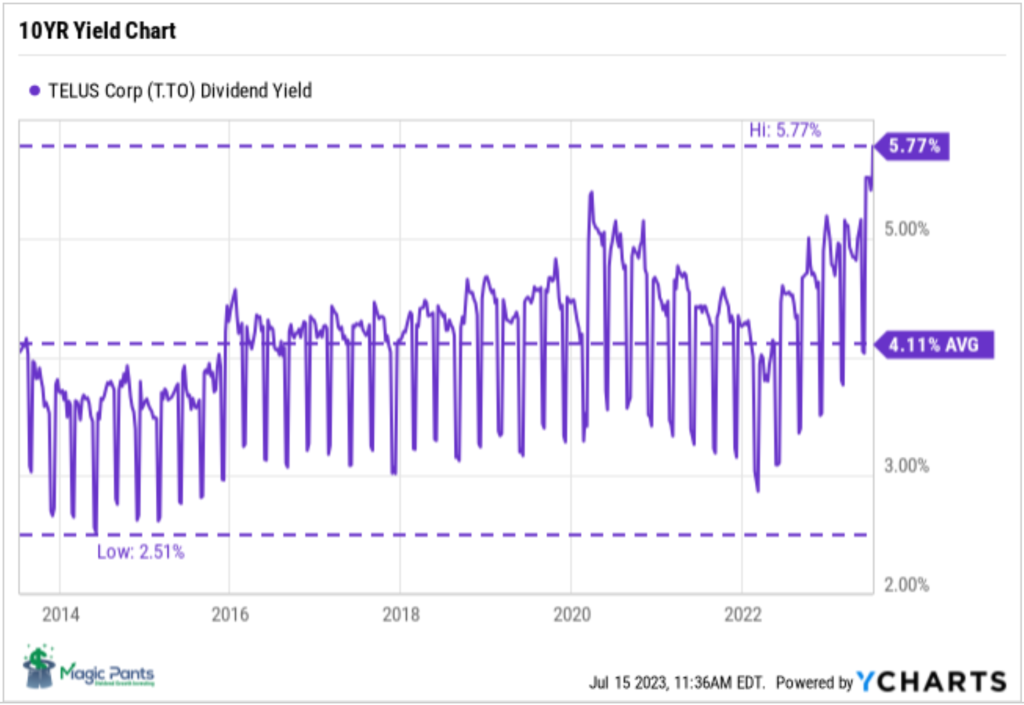
| T-T | Telus Corp. | 6.1% | $23.62 | -10.3% | $1.43 | 7.3% | 19 |
| WCN-N | Waste Connections | 0.7% | $141.44 | 7.4% | $1.02 | 7.4% | 13 |
| Averages | 3.3% | 5.4% | 8.4% | 19 |
Six Canadian stocks on ‘The List’ declare earnings and dividends in US dollars and are inter-listed on a US exchange in US dollars. The simplest way to display dividend and price metrics for these stocks is to show their US exchange symbols along with their US dividends and price. The stocks I am referring to have a -N at the end of their symbols. You can still buy their Canadian counterparts (-T), but your dividends will be converted into CDN dollars and will fluctuate based on the exchange rate.
Note: When the dividend and share price currency match, the calculation is straightforward. But it’s not so simple when the dividend is declared in one currency, and the share price is quoted in another. Dividing the former by the latter would produce a meaningless result because it’s a case of apples and oranges. To calculate the yield properly, you must express the dividend and share price in the same currency.
Performance of ‘The List’
Feel free to click on this link, ‘The List’ for a sortable version from our website.
Last week, ‘The List’ was down with a YTD price return of +5.4% (capital). Dividend growth remained the same and is now at +8.4% YTD, highlighting growth in income over the past year.
The best performers last week on ‘The List’ were TFI International (TFII-N), up +4.71%; Toromont Industries (TIH-T), up +2.80%; and Magna (MGA-N), up +2.28%.
TC Energy Corp. (TRP-T) was the worst performer last week, down -13.36%.
Dividend Increases
“The growth of dividend paying ability is of significance in the determination of a stock’s quality, or general safety…”
– Arnold Bernhard (the founder of Value Line)
“As a dividend increase is a positive sign of a company’s financial strength, the safest purchase, after research, is a stock with a recent dividend increase.”
– Tom Connolly (the founder of dividendgrowth.ca)
Last week, no dividend increases from companies on ‘The List’.
Earnings Releases
Benjamin Graham once remarked that earnings are the principal factor driving stock prices.
Each quarter we will provide readers with weekly earnings updates of stocks on ‘The List’ during the calendar earnings season.
The updated earnings calendar can be found here.
Earnings growth and dividend growth tend to go hand in hand, so this information can tell us a lot about the future dividend growth of our quality companies. Monitoring our dividend growers periodically is part of the process, and reading the quarterly earnings releases is a good place to start.
Nine earnings reports from companies on ‘The List’ this week
TFI International (TFII-N) will release its second-quarter fiscal 2023 results on Monday, July 31, 2023, after markets close.
Fortis (FTS-T) will release its second-quarter fiscal 2023 results on Wednesday, August 2, 2023, before markets open.
Waste Connections (WCN-N) will release its second-quarter fiscal 2023 results on Wednesday, August 2, 2023, after markets close.
Intact Financial (IFC-T) will release its second-quarter fiscal 2023 results on Wednesday, August 2, 2023, after markets close.
Brookfield Infrastructure Partners (BIP-N) will release its second-quarter fiscal 2023 results on Thursday, August 3, 2023, before markets open.
Bell Canada (BCE-T) will release its second-quarter fiscal 2023 results on Thursday, August 3, 2023, before markets open.
Telus Corp. (T-T) will release its second-quarter fiscal 2023 results on Friday, August 4, 2023, before markets open.
Enbridge Inc. (ENB-T) will release its second-quarter fiscal 2023 results on Friday, August 4, 2023, before markets open.
Magna (MGA-N) will release its second-quarter fiscal 2023 results on Friday, August 4, 2023, before markets open.
Last week, five companies on ‘The List’ reported earnings.
Canadian National Railway (CNR-T) released its second-quarter fiscal 2023 results on Tuesday, July 25, 2023, after markets closed.
“CN’s disciplined approach to scheduled railroading continues to deliver for our customers. As volumes evolve, we will continue to refine our plan to optimize efficiency and drive further improvements to customer service. Our goal to accelerate sustainable, profitable growth through 2026 and beyond remains on track.”
– Tracy Robinson, President and Chief Executive Officer
Highlights:
Q2 2023 compared to Q2 2022
- Revenues of C$4,057 million, a decrease of C$287 million, or 7%.
- Operating income of C$1,600 million, a decrease of C$169 million, or 10%.
- Operating ratio, defined as operating expenses as a percentage of revenues, of 60.6%, an increase of 1.3-points, or an increase of 1.6-points on an adjusted basis.
- Diluted EPS of C$1.76, a decrease of 8%, or a decrease of 9% compared to second quarter 2022 adjusted EPS.
- Free cash flow for the second quarter of 2023 was C$1,100 million, an increase of C$103 million, or 10%.
- Free cash flow for the first half of 2023 was C$1,693 million, an increase of C$125 million, or 8%.
Outlook:
In light of CN’s second quarter results and revised expectation of weaker than anticipated volumes in the second half of 2023, CN is updating its full-year outlook and now expects flat to slightly negative year-over-year growth in adjusted diluted EPS in 2023 (compared to the April 24, 2023 expectation of growth in the mid-single digits). CN reiterates its longer-term financial perspective and continues to target compounded annual diluted EPS growth in the range of 10%-15% over the 2024-2026 period driven by growing volumes more than the economy, pricing above rail inflation and incrementally improving efficiency, all of which assumes a supportive economy.
Source: (CNR-T) Q2-2023 Quarterly Review
Loblaws (L-T) released its second-quarter fiscal 2023 results on Wednesday, July 26, 2023, before markets opened.
“Our businesses remain focused on providing Canadians with the selection, freshness, care and value they need today. We will build on this strength and continue to take meaningful steps to fight back against inflation. Our discount offering, best-in-class control brand products and PC Optimum™ Program are resonating with customers who are looking for value without sacrificing quality.”
– Galen G. Weston, Chairman and President
Highlights:
- Revenue was $13,738 million, an increase of $891 million, or 6.9%.
- Retail segment sales were $13,471 million, an increase of $848 million, or 6.7%.
- Food Retail (Loblaw) same-stores sales increased by 6.1%.
- Drug Retail (Shoppers Drug Mart) same-store sales increased by 5.7%, with front store same-store sales growth of 5.0% and pharmacy same-store sales growth of 6.3%.
- E-commerce sales increased by 13.9%.
- Operating income was $927 million, an increase of $185 million, or 24.9%.
- Adjusted EBITDA was $1,640 million, an increase of $141 million, or 9.4%.
- Retail segment adjusted gross profit percentage was 31.1%, a decrease of 30 basis points.
- Net earnings available to common shareholders of the Company were $508 million, an increase of $121 million or 31.3%. Diluted net earnings per common share were $1.58, an increase of $0.42, or 36.2%. The increase included the lapping of a prior year charge of $111 million related to a PC Bank commodity tax matter.
- Adjusted net earnings available to common shareholders of the Company were $626 million, an increase of $60 million, or 10.6%.
- Adjusted diluted net earnings per common share were $1.94, an increase of $0.25 or 14.8%.
- Repurchased for cancellation 4.2 million common shares at a cost of $511 million and invested $410 million in capital expenditures, net of proceeds from property disposals. Free cash flow used in the Retail segment was $600 million.
Outlook:
Loblaw will continue to execute on retail excellence while advancing its growth initiatives in 2023. The Company’s businesses remain well placed to service the everyday needs of Canadians. However, the Company cannot predict the precise impacts of global economic uncertainties, including the inflationary environment, on its 2023 financial results.
For the full-year 2023, the Company continues to expect:
- its Retail business to grow earnings faster than sales;
- adjusted net earnings per common share growth in the low double digits;
- to increase investments in our store network and distribution centres by investing a net amount of $1.6 billion in capital expenditures, which reflects gross capital investments of approximately $2.1 billion offset by approximately $500 million of proceeds from real estate dispositions; and
- to return capital to shareholders by allocating a significant portion of free cash flow to share repurchases.
Source: (L-T) Q2-2023 News Release
Toromont Industries (TIH-T) released its second-quarter fiscal 2023 results on Wednesday, July 26, 2023, after markets closed.
“We are pleased with the operating and financial performance through the first half of the year. The Equipment Group executed well, delivering on several large customer orders, as well as growing rental and product support results. CIMCO revenue and bottom line improved in the quarter on project construction and higher product support activity. Across the organization, we continue to navigate through economic conditions and remain committed to our operating disciplines, driving our after-market strategies and delivering customer solutions.”
– Scott J. Medhurst, President and Chief Executive Officer
Highlights:
- Revenue increased $121.3 million or 12% in the second quarter compared to the similar period last year. Revenue was higher in both groups with the Equipment Group up 11% in the quarter on higher new equipment sales (+16%), partially offset by lower used equipment sales (-9%), while CIMCO revenue was up 19%, with good progress on package sales (+18%). Product support revenue was 13% higher on increased demand in both Groups, while rental revenue grew 7% on a larger fleet and higher activity levels.
- Revenue increased $321.0 million (17%) to $2.2 billion for the year-to-date period. Revenue increased in both groups, with the Equipment Group up 17%, while CIMCO was up 18% versus the first half of 2022, on similar trends as noted for the quarter.
- Operating income increased 15% in the quarter reflecting the higher revenue and lower relative expense level. Operating income as a percentage of sales increased to 15.2% from 14.8% in the prior year.
- Operating income increased 26% in the year-to-date period, and was 13.8% of revenue compared to 12.8% in the similar period last year, reflecting a lower relative expense ratio.
- Net earnings from continuing operations increased $22.3 million or 20% in the quarter versus a year ago to $133.3 million or $1.62 EPS (basic) and $1.61 EPS (fully diluted).
- For the year-to-date period, net earnings from continuing operations increased $58.2 million or 34% to $229.4 million, or $2.79 EPS (basic) and $2.76 EPS (fully diluted).
- Bookings for the second quarter increased 69% compared to last year and increased 10% on a year–to–date basis. Both the Equipment Group and CIMCO reported increased bookings on good demand for our products, however certain markets remain cautious given the uncertain economic conditions.
- Backlog was $1.3 billion as at June 30, 2023, compared to $1.4 billion as at June 30, 2022, reflecting progress on construction and delivery schedules as well as some improvement in equipment flow through the supply chain.
- On May 1, 2023, the Company completed the sale of AgWest Ltd., a wholly-owned subsidiary, in a share and asset transaction. Total proceeds were paid in cash of approximately $41.6 million and are subject to customary post-closing adjustments. AgWest was reported in the Equipment Group and effective with the second quarter, has been presented as discontinued operations.
Outlook:
We are closely monitoring regional, national and global economic factors, in particular, inflationary pressures from price and wage increases, interest rate changes, and general economic health of the industries we serve.
While improving, the global supply chain remains challenged in certain lines and components. We continue to actively manage supply chain constraints by taking appropriate mitigation steps.
We continue to monitor economic and inflationary developments, remaining focused on the health and safety of our employees and serving our customers. We are transitioning to a hybrid work model, where appropriate, and are enhancing and leveraging the use of technology to efficiently and effectively engage with customers, employees and other partners, while improving our operational efficiency.
The Equipment Group’s parts and service business provides stability supported by a large and diversified installed base of equipment. The long-term outlook for infrastructure projects and other construction activity is positive across most territories although tied somewhat to the general economic climate which is increasingly uncertain. Mining customers and our operations that support them continue to evaluate appropriate activity levels on a daily/weekly basis. Longer term, mine investment and expansion will remain dependent on global economic and financial conditions.
Investment continues in broadening product lines and service offerings, expanding and enhancing the branch network, optimizing rental fleets, and using technologies to create efficiency and effectiveness across the organization. Integration and alignment of operating processes and systems, best practices and culture, continues across our territory. Product support technologies, such as remote diagnostics, telematics and digital information models support and expand our strategic platform.
CIMCO’s installed base supports current and future operations and growth trends. CIMCO has a wide product offering using natural refrigerants including innovative CO2 solutions, which remains a differentiator in recreational markets. In industrial markets, CIMCO’s proven track record and strong geographical coverage provides growth opportunities. Current backlog is supportive of future activity. Inflationary costs and competitive market conditions continue to challenge package revenue growth opportunities. The diversity of the markets served, expanding product offering and services, strong financial position and disciplined operating culture position the Company well for continued positive results in the long term.
Source: (TIH-T) Q2-2023 Reporting Package
Canadian Utilities Limited (CU-T) released its second-quarter fiscal 2023 results on Thursday, July 27, 2023, before markets opened.
“Canadian Utilities achieved adjusted earnings of a $100 million or $0.37 per share in the second quarter of this year, compared to $136 million in the second quarter of last year. As expected, the impact of our Alberta distribution utilities rebasing following our second successful performance-based regulation cycle resulted in lower year-over-year earnings in the second quarter. On it’s own, this rebasing contributed to a year-over-year decline in earnings of approximately $25 million. While significant, this is certainly not unexpected in a rebasing year, especially with a phenomenal out performance we achieved last year, a final year of PBR2.”
– Brian Shkrobot, Executive Vice-President and Chief Financial Officer
Highlights:
Recent Developments:
- Announced the executive appointment of Wayne Stensby as Chief Operating Officer of ATCO Energy Systems, the newly branded gas and electrical utility services business, which also oversees our interests in LUMA Energy.
- Announced the executive appointment of Bob Myles as Chief Operating Officer of ATCO EnPower, the newly branded non-regulated energy business, including renewables, clean fuels, and energy storage.
- Invested $332 million in capital expenditures in the second quarter of 2023, of which 86 per cent was invested in ATCO Energy Systems and 14 per cent mainly in ATCO EnPower.
- The Barlow solar project achieved full commercial operations. Our other Calgary solar development project, Deerfoot, is expected to commence energization in the third quarter of 2023, with full commercial operations expected in the fourth quarter of 2023.
- Since acquiring the renewable energy portfolio in January 2023, the 232-MW of operating Forty Mile and Adelaide wind assets have contributed revenues of $46 million for the six months ended June 30, 2023. Uprating work continues for the Forty Mile wind assets with expected completion in the fourth quarter of 2023. This uprating is expected to increase Forty Mile Wind generation capacity from 202-MW to 225-MW.
- Despite significant wildfire activity within Alberta in the first half of 2023, Canadian Utilities’ businesses have been successful in limiting customer outages and avoiding any safety incidents related to these events. Wildfire activity in the province of Alberta has slowed significantly from its peak earlier in the second quarter and our teams continue to stay focused on restoration efforts. We do not expect to see any negative impact to earnings as a result of these events.
- Significant opportunities for growth continue to be expected in connection with the energy transition, including existing and new opportunities within both ATCO Energy Systems and ATCO EnPower. To support this potential growth, Canadian Utilities intends to explore various financing alternatives including the possibility of creating ATCO EnPower as a separate entity.
Outlook:
Looking ahead to the rest of year, we expect to see the earnings pressure associated with this rebasing peak in the third quarter, and in the fourth quarter we expect seasonality benefits and our annual spending profile to create potential opportunities for year-over-year growth. Overall, despite the earnings pressure from rebasing, we still believe that our full year performance for these businesses will be in line with the expectations that we’ve shared previously. More specifically, we continue to believe that we’ll be successful in achieving out-performance largely in line with our long-term historical performance. This will limit the single year earnings decline for this year to levels largely consistent with what we experienced back in 2018 following PBR1.
– Brian Shkrobot, Executive Vice-President and Chief Financial Officer
Source: (CU-T) Q2-2023 News Release
TC Energy (TRP-T) released its second-quarter fiscal 2023 results on Friday, July 28, 2023, before markets opened.
“Today’s announcement to separate our Natural Gas Pipelines and Power and Energy Solutions businesses from our Liquids Pipelines business will maximize the value of our assets. The separated industry-leading companies will have greater strategic focus to execute major projects, drive efficiencies and operational excellence, and enhanced flexibility to pursue disciplined growth. In addition, we have made significant progress on our 2023 strategic priorities. First, we continue to safely execute our secured capital program, including Coastal GasLink and Southeast Gateway which remain on planned cost and schedule. Second, we have significantly accelerated our deleveraging goal ahead of our year-end target with the sale of a 40 per cent equity interest in the Columbia Gulf and Columbia Gas systems for total cash proceeds of $5.2 billion. And third, we are safely and reliably operating our assets that provide essential services across North America, which is a testament to the dedication and hard work of our people.”
– Francois Poirier, President and Chief Executive Officer
Highlights:
- First quarter 2023 results were underpinned by strong utilization and demand for our assets and services
- NGTL System total deliveries averaged 14.5 Bcf/d, up compared to first quarter 2022
- Throughput across U.S. Natural Gas Pipelines averaging 28.5 Bcf/d with several assets performing at near record levels during peak demand
- S. Natural Gas Pipelines achieved a new all-time record for deliveries to LNG export facilities
- Alberta cogeneration power plant fleet reached 100 per cent peak price availability in February
- Bruce Power achieved 95 per cent availability
- First quarter 2023 financial results:
- Net income attributable to common shares of $1.3 billion or $1.29 per common share compared to $0.4 billion or $0.36 per common share in first quarter 2022. Comparable earnings1 of $1.2 billion or $1.21 per common share compared to $1.1 billion or $1.12 per common share in 2022
- Segmented earnings of $2.2 billion compared to segmented earnings of $1.2 billion in 2022 and comparable EBITDA of $2.8 billion compared to $2.4 billion in 2022
- Reaffirmed our 2023 financial outlook with comparable EBITDA expected to be five to seven per cent higher than 2022
- Declared a quarterly dividend of $0.93 per common share for the quarter ending June 30, 2023
- Dividend Reinvestment and Share Repurchase Plan (DRP) participation rate amongst common shareholders was approximately 38 per cent, resulting in $363 million reinvested in common equity from the dividends declared on February 13, 2023
- Continuing to advance our industry leading secured capital program, placing $1.4 billion of projects in service in first quarter 2023 and on track to place $6.0 billion in service during 2023
- Canadian Natural Gas Pipelines brought $1.1 billion of projects in service in first quarter 2023, enabling 700 MMcf/d of additional market access with an incremental 500 MMcf/d expected in second quarter 2023
- Placed Port Neches Link Pipeline System in service in March 2023 providing last mile connectivity to key demand mark
- Acquired 155 MW Fluvanna Wind Farm for US$99 million in cash, before post-closing adjustments in Scurry County, Texas. Entered into an agreement to acquire 148 MW Blue Cloud Wind Farm for US$125 million in cash, before post-closing adjustments in Bailey County, Texas. Closing of the Blue Cloud acquisition is pending regulatory approval
- Received FERC approval for ANR Section 4 Rate Case on April 11, 2023
- Bruce Power Unit 3 removed from service March 1, 2023 to begin its Major Component Replacement (MCR) outage with return to service expected in 2026.
Outlook:
Reaffirming 2023 outlook and dividend declaration We reaffirm our 2023 comparable EBITDA growth outlook of five to seven per cent relative to 2022, while comparable earnings per common share is expected to be modestly higher than 2022, showcasing the resiliency and sustainability of our earnings and cash flows. In addition, we expect capital spending in 2023 to continue to be $11.5 to $12.0 billion. Our 2023 outlook reflects our commitment to driving long-term growth and value for our shareholders. Based on the confidence of our business and growth outlook, TC Energy’s Board of Directors declared a quarterly dividend of $0.93 per common share for the quarter ending June 30, 2023, equivalent to $3.72 per common share on an annualized basis. We expect to continue to grow the common share dividend at an annual rate of three to five per cent, enabling our shareholders to benefit from our growth and success in the coming years.
Source: (TRP-T) Q2-2023 Quarterly Report