MP Market Review – August 25, 2023
Last updated by BM on August 28, 2023
Summary
- This is a weekly installment of our MP Market Review series, which provides updates on the financial markets and Canadian dividend growth companies we monitor on ‘The List’.
- Last week, ‘The List’ was up with a YTD price return of +1.9% (capital). Dividend growth remained the same and is now at +8.4% YTD, highlighting growth in income over the past year.
- Last week, no dividend increases from companies on ‘The List’.
- Last week, two earnings reports from companies on ‘The List’.
- No companies on ‘The List’ are due to report earnings this week.
- If you’re interested in creating your own dividend growth income portfolio, consider subscribing to our premium service, which grants you access to the MP Wealth-Builder Model Portfolio (CDN) and exclusive subscriber-only content. Learn More
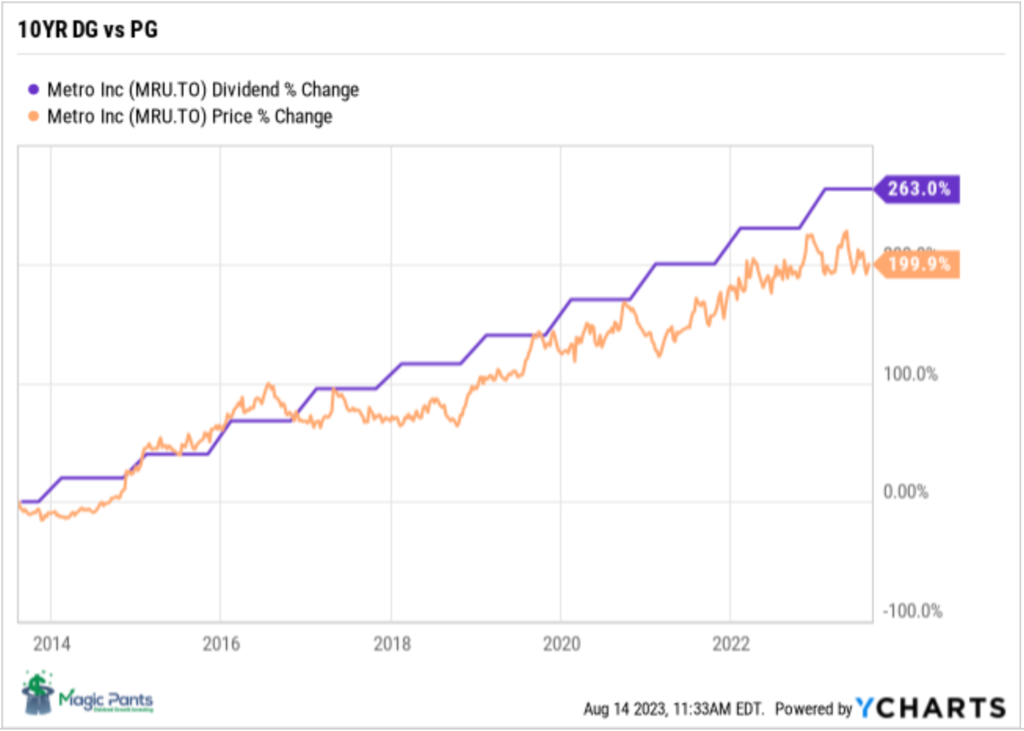
Identifying companies whose dividend growth aligns closely with price growth can considerably enhance the predictability of future returns. Dividend growth investors know that the dividend drives the price in a predictable way, not the other way around. Metro Inc. (MRU-T) is another company on ‘The List’ that follows this dividend growth principle.
Introduction
“You have a pair of pants. In the left pocket, you have $100. You take $1 out of the left pocket and put it in the right pocket. You now have $101. There is no diminution of dollars in your left pocket. That is one magic pair of pants.”
This ‘magic pants’ analogy was from a Seeking Alpha article on dividend investing I read about a decade ago and was one of the catalysts for me to take a closer look at this type of investing and see if it truly was magical.
After conducting additional research, I have shifted towards utilizing a dividend growth investing (DGI) strategy as my primary investment approach. While I maintain portfolios consisting of high-quality dividend growers from both the United States and Canada, I have opted to concentrate on Canadian (CDN) dividend growth companies in this blog. This is due to several reasons, including a smaller pool of DGI companies to track, a lack of coverage for the DGI strategy by the North American investment media, and a tendency for those who do cover DGI to narrowly focus on only a handful of sectors (Energy and Financials).
While ‘The List’ is not a portfolio in itself, it serves as an excellent initial reference for individuals seeking to diversify their investments and attain higher returns in the Canadian stock market. Through our blog, we provide weekly updates on ‘The List’ and offer valuable perspectives and real-life examples of the dividend growth investing strategy in practice. This helps readers gain a deeper understanding of how to implement and benefit from this investment approach.
DGI Thoughts
“Experience is the worst teacher. It gives the test before giving the lesson.”
– Brendan Moynihan, What I Learned Losing A Million Dollars
The quote is from a book I am reading now. The book highlights an investor who was doing quite well until he wasn’t. It turns out that being lucky versus being good (having a process) can cost you a lot of money.
A short story I read a while back highlights this concept quite well.
Being Lucky vs Being Good– Vishal Khandelwal
Let’s say you sponsor a contest to determine the “world’s best coin flippers.” About 100,000 people from across the world come together to participate in this contest. Everyone flips a coin at the same time.
After each coin flip, those who flip “tails” must leave, until the only people left have flipped 10 consecutive heads. Basic statistics suggest that we could expect about 98 coin flippers to remain at the end of the contest.
The odds of flipping heads 10 times in a row are 1/2^10 = 1/1024. So, for 100,000 participants, there will be 100,000/1,024 = 98 people who would have flipped 10 consecutive heads.
Then, these 98 “skilled” coin flippers would get thousands of likes on Facebook, and followers on Twitter. Those with the best smile and social media skills will write bestselling books about coin flipping, sharing their secrets of how to become a world-class coin flipper.
Sadly, most of us judge the quality of our decisions and actions by one single factor, and that is our one-off good performance that comes easily at the very beginning of our endeavour.
Investing is not any different. As investors, we often struggle with judging whether a decision was good or not, even in hindsight, because like the winning coin flippers we often only look at the outcome and not the process. The truth, however, is that a good process is the only thing that could help you bring the odds of success in your favour. It’s only with a good process that you stand a chance to do well in investing over the long run.
If you have not yet joined as a paid subscriber of the blog to receive DGI Alerts on the activity and content related to our model portfolio, it’s not too late. Click Here.
Recent News
The Canadian economy is mired in weak fundamentals and investors are taking note (Globe & Mail)
“From a big-picture standpoint, the Canadian economy is mired in weak fundamentals.”
The article points to several reasons why we may anticipate further challenges, with rising immigration levels and a falling GDP being the most concerning.
“Productivity in Canada has declined by 1.4 percent year-over-year and has contracted sequentially for four consecutive quarters, as well as in 10 of the past 11 quarters.”
Our recent Q2 earnings reporting season appears to support this perspective, as over 50% of companies on ‘The List’ failed to outperform the same quarter of the previous year. Reviewing the recent Q3 earnings results from the Canadian Banks on ‘The List’ emphasizes this even more.
We will remain vigilant and enhance our growing income during periods of volatility by acquiring our quality dividend growth stocks at ‘sensible prices’.
Two high-yielding stocks with million-dollar purchases (Globe & Mail)
“I tend to put great weight on insider transaction activity when I see multiple insiders trading a company’s shares or units.”
The author uses insider transaction activity as an indicator of a ‘sensible price’.
The two stocks he is referring to are on ‘The List’ we follow (EMA-T and T-T).
The List (2023)
Last updated by BM on August 25, 2023
The Magic Pants List contains 27 Canadian dividend growth stocks. ‘The List’ contains Canadian companies that have raised their dividend yearly for at least the last ten years and have a market cap of over a billion dollars. Below is each stock’s symbol, name, current yield, current price, price return year-to-date, current dividend, dividend growth year-to-date and current dividend growth streak. Companies on ‘The List’ are added or subtracted once a year, on January 1. After that, ‘The List’ is set for the next twelve months. Prices and dividends are updated weekly.
| SYMBOL | COMPANY | YLD | PRICE | YTD % | DIV | YTD % | STREAK |
|---|---|---|---|---|---|---|---|
| AQN-N | Algonquin Power & Utilities | 6.9% | $7.39 | 9.8% | $0.51 | -29.0% | 12 |
| ATD-T | Alimentation Couche-Tard Inc. | 0.8% | $71.29 | 18.5% | $0.56 | 19.1% | 13 |
| BCE-T | Bell Canada | 6.8% | $56.32 | -6.5% | $3.82 | 5.0% | 14 |
| BIP-N | Brookfield Infrastructure Partners | 4.4% | $31.86 | 5.2% | $1.44 | 6.3% | 15 |
| CCL-B-T | CCL Industries | 1.8% | $60.05 | 3.4% | $1.06 | 10.4% | 21 |
| CNR-T | Canadian National Railway | 2.1% | $152.98 | -6.1% | $3.16 | 7.8% | 27 |
| CTC-A-T | Canadian Tire | 4.5% | $152.63 | 4.1% | $6.90 | 17.9% | 12 |
| CU-T | Canadian Utilities Limited | 5.6% | $32.19 | -12.9% | $1.79 | 1.0% | 51 |
| DOL-T | Dollarama Inc. | 0.3% | $85.81 | 7.5% | $0.27 | 23.8% | 12 |
| EMA-T | Emera | 5.4% | $50.74 | -3.6% | $2.76 | 3.0% | 16 |
| ENB-T | Enbridge Inc. | 7.6% | $46.83 | -12.2% | $3.55 | 3.2% | 27 |
| ENGH-T | Enghouse Systems Limited | 2.9% | $29.47 | -17.5% | $0.85 | 18.2% | 16 |
| FNV-N | Franco Nevada | 1.0% | $138.47 | 0.2% | $1.36 | 6.3% | 15 |
| FTS-T | Fortis | 4.2% | $53.43 | -3.5% | $2.26 | 4.1% | 49 |
| IFC-T | Intact Financial | 2.3% | $194.68 | -0.6% | $4.40 | 10.0% | 18 |
| L-T | Loblaws | 1.5% | $116.55 | -3.1% | $1.74 | 10.3% | 11 |
| MGA-N | Magna | 3.3% | $56.54 | -1.7% | $1.84 | 2.2% | 13 |
| MRU-T | Metro | 1.7% | $69.90 | -7.4% | $1.21 | 10.0% | 28 |
| RY-T | Royal Bank of Canada | 4.4% | $121.02 | -5.5% | $5.34 | 7.7% | 12 |
| SJ-T | Stella-Jones Inc. | 1.4% | $64.69 | 30.5% | $0.92 | 15.0% | 18 |
| STN-T | Stantec Inc. | 0.8% | $90.22 | 38.1% | $0.77 | 8.5% | 11 |
| TD-T | TD Bank | 4.8% | $80.37 | -8.3% | $3.84 | 7.9% | 12 |
| TFII-N | TFI International | 1.1% | $127.33 | 27.2% | $1.40 | 29.6% | 12 |
| TIH-T | Toromont Industries | 1.5% | $110.36 | 12.9% | $1.68 | 10.5% | 33 |
| TRP-T | TC Energy Corp. | 7.7% | $48.07 | -9.8% | $3.69 | 3.4% | 22 |
| T-T | Telus Corp. | 6.1% | $23.35 | -11.3% | $1.43 | 7.4% | 19 |
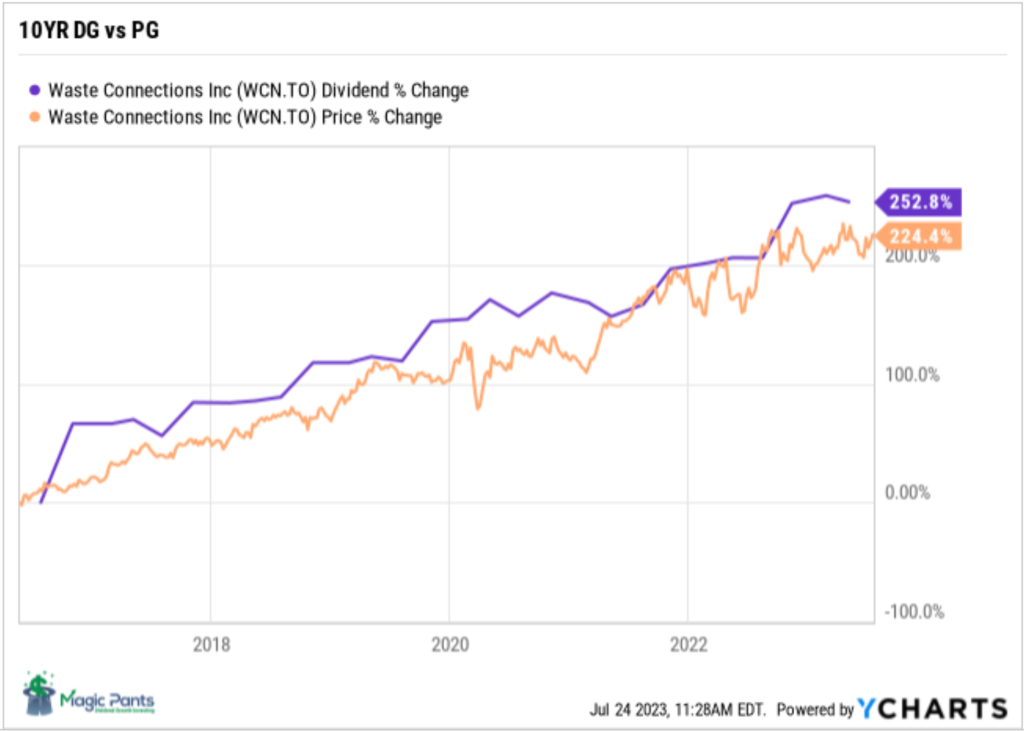
| WCN-N | Waste Connections | 0.7% | $137.86 | 4.7% | $1.02 | 7.4% | 13 |
| Averages | 3.4% | 1.9% | 8.4% | 19 |
Six Canadian stocks on ‘The List’ declare earnings and dividends in US dollars and are inter-listed on a US exchange in US dollars. The simplest way to display dividend and price metrics for these stocks is to show their US exchange symbols along with their US dividends and price. The stocks I am referring to have a -N at the end of their symbols. You can still buy their Canadian counterparts (-T), but your dividends will be converted into CDN dollars and will fluctuate based on the exchange rate.
Note: When the dividend and share price currency match, the calculation is straightforward. But it’s not so simple when the dividend is declared in one currency, and the share price is quoted in another. Dividing the former by the latter would produce a meaningless result because it’s a case of apples and oranges. To calculate the yield properly, you must express the dividend and share price in the same currency.
Performance of ‘The List’
Feel free to click on this link, ‘The List’ for a sortable version from our website.
Last week, ‘The List’ was up with a YTD price return of +1.9% (capital). Dividend growth remained the same and is now at +8.4% YTD, highlighting growth in income over the past year.
The best performers last week on ‘The List’ were Enghouse Systems Limited (ENGH-T), up +5.17%; Algonquin Power & Utilities (AQN-N), up +2.64%; and Alimentation Couche-Tard Inc. (ATD-T), up +2.58%.
TD Bank (TD-T) was the worst performer last week, down -4.24%.
Dividend Increases
“The growth of dividend paying ability is of significance in the determination of a stock’s quality, or general safety…”
– Arnold Bernhard (the founder of Value Line)
“As a dividend increase is a positive sign of a company’s financial strength, the safest purchase, after research, is a stock with a recent dividend increase.”
– Tom Connolly (the founder of dividendgrowth.ca)
Last week, no dividend increases from companies on ‘The List’.
Earnings Releases
Benjamin Graham once remarked that earnings are the principal factor driving stock prices.
Each quarter we will provide readers with weekly earnings updates of stocks on ‘The List’ during the calendar earnings season.
The updated earnings calendar can be found here.
Earnings growth and dividend growth tend to go hand in hand, so this information can tell us a lot about the future dividend growth of our quality companies. Monitoring our dividend growers periodically is part of the process, and reading the quarterly earnings releases is a good place to start.
No earnings reports from companies on ‘The List’ this week
Last week, two companies on ‘The List’ reported earnings.
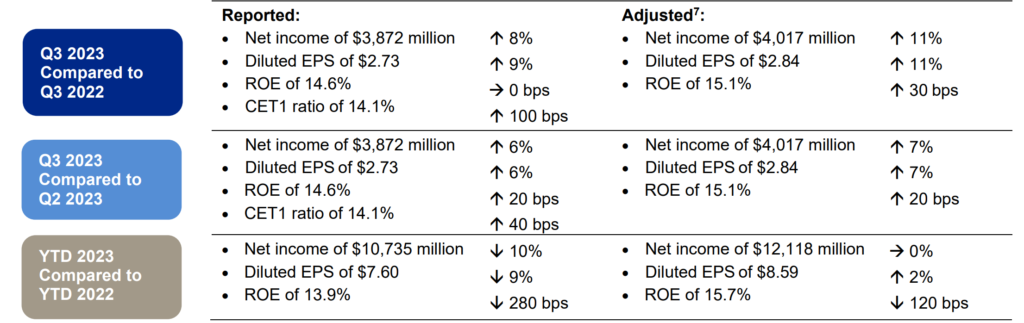
Royal Bank of Canada (RY-T) released its third-quarter fiscal 2023 results on Thursday, August 24, 2023, before markets opened.
“Despite a complex operating environment, our Q3 results exemplify RBC’s ability to consistently deliver solid revenue and volume growth underpinned by prudent risk management. We remain focused on executing on our cost reduction strategy while leveraging our strong balance sheet and diversified business model to support our growth and bring long-term value to our clients, communities and shareholders.”
– Dave McKay, President and Chief Executive Officer of Royal Bank of Canada
Highlights:
Outlook:
The near-term macroeconomic backdrop has been more resilient than expected with unemployment rates remaining low across most advanced economies despite increases in interest rates over the last calendar year. Inflation has slowed with energy prices falling below calendar year-ago levels and global supply chain pressures have substantially eased. However, inflation is unlikely to reduce to central bank target rates without some slowing in consumer spending and higher unemployment. Central banks have responded with additional interest rate increases. More recently, there have been early signs that economic growth is slowing. Consumer delinquency rates, as published by the Bank of Canada, have been edging higher and the unemployment rate has begun to rise in Canada. We continue to expect mild recessions in the U.S. and Canada beginning in the second half of calendar 2023.
Source: (RY-T) Q3-2023 Earnings Results
TD Bank (TD-T) released its third-quarter fiscal 2023 results on Thursday, August 24, 2023, before markets opened.
“TD delivered strong revenue growth in the quarter and demonstrated the value of its diversified business mix in a challenging economic environment. Investments across our business further strengthened the Bank’s ability to deliver legendary experiences to more than 27 million customers.”
– Bharat Masrani, Group President and Chief Executive Officer
Highlights:
- Reported diluted earnings per share were $1.57, compared with $1.75.
- Adjusted diluted earnings per share were $1.99, compared with $2.09.
- Reported net income was $2,963 million, compared with $3,214 million.
- Adjusted net income was $3,731 million, compared with $3,813 million.
Outlook:
The global economy remains on track to slow in calendar 2023, but to a lesser extent than anticipated in the previous quarter. As a result, inflation rates across the G-7 have stayed elevated, and central banks have raised interest rates further. The lagged impact of cumulative interest rate hikes is expected to be the primary influence dampening economic growth and returning inflation closer to the target ranges of the various regions by the end of 2024. The impact of bank failures in the U.S. earlier this year has had a more modest impact than initially anticipated.
The U.S. economy expanded by 2.4% annualized in the second calendar quarter of 2023. Underlying domestic demand grew at a healthy 2.3% pace, as business investment accelerated after a soft performance in the first calendar quarter. Consumer spending slowed, while real income growth improved alongside lower inflation. Housing activity continued to weigh on economic growth, as a modest improvement in new home construction was not enough to outweigh weakness in the resale market.
As of July, the U.S. job market was still tight with the unemployment rate at 3.5% in July, close to its multi-decade low. However, there are signs that demand for workers is cooling, as evidenced by both slower trend growth in payrolls and gradually declining job openings. Helped by lower gasoline prices, inflation metrics have been moderating in recent months. Underlying services prices, which have been a source of persistent price pressure, have also started to cool. Nonetheless, inflation remains well above the U.S. Federal Reserve’s 2% target and the central bank remains highly attentive to upside inflation risks.
TD Economics expects the federal funds rate will remain at its current range of 5.25-5.50% through the end of calendar 2023. However, the economic environment remains fluid. The central bank could embark on additional interest rate hikes if a further cooling in the labour market and inflation do not materialize in line with its expectations. Given the steep rise in interest rates over the past year, the trend towards tighter U.S. credit conditions and the likelihood of rolling periods of financial stress related to risk factors, the probability of a recession stateside remains elevated.
The Canadian economy recorded a solid 3.1% annualized rate of expansion in the first calendar quarter of 2023, reflecting a rebound from a soft showing registered in the fourth calendar quarter of 2022. Despite the financial impact of rising interest costs on highly indebted households, consumer spending was strong, supported by population growth, strong job market conditions, excess savings and increased government supports. The housing sector remained a drag on economic growth in the first calendar quarter but has since shown signs of stabilization.
Canadian inflation has moderated, although progress on core inflation metrics has been slow. The trend rate of job growth has slowed below that of the labour force, pushing the unemployment rate higher. TD Economics expects the unemployment rate to continue to move higher in the months ahead. That is expected to contribute to a downturn in consumer spending through the first half of 2024. Given the uncertainty surrounding the impact of substantial interest rate hikes on highly indebted Canadian households, the risk of recession also remains elevated in Canada.
The Bank of Canada raised the overnight interest rate in July to 5.00%, and expressed concern about the persistence of underlying inflation. The incoming economic data will determine whether more interest rate hikes will be required in Canada to bring inflation down to the 2% target. The Canadian dollar is expected to hover around the 75 U.S. cent mark in calendar 2023.
Source: (TD-T) Q3-2023 Earnings Results