“You have a pair of pants. In the left pocket, you have $100. You take $1 out of the left pocket and put in the right pocket. You now have $101. There is no diminution of dollars in your left pocket. That is one magic pair of pants.”

‘The List’ – Portfolio Review (February 2022)

Posted by BM on February 28, 2022 

Each month we walk through our valuation process using a stock on ‘The List’ that meets our minimum screen of 6.5% EPS Yield. This month it is Magna International (MG-T).

Valuation is the second step in our three-step process. Buying when our quality stocks are sensibly priced will help ensure our future investment returns meet our expectations. We rely heavily on the fundamental analyzer software tool (FASTgraphs) to help us understand the fundamentals of the stocks we invest in and then read the company’s website for investor presentations and recent earnings reports to learn more.

Intro:

Magna is more than one of the world’s largest suppliers in the automotive space. They are a mobility technology company with a global, entrepreneurial-minded team of over 158,000 employees and an organizational structure designed to innovate like a startup.

With 60+ years of expertise, and a systems approach to design, engineering and manufacturing that touches nearly every aspect of the vehicle, they are positioned to support advancing mobility in a transforming industry. Thier global network includes 343 manufacturing operations and 91 product development, engineering and sales centres spanning 28 countries. Roughly half of Magna’s revenue comes from North America while Europe accounts for approximately 44% 

Historical Graph:

Source: FASTgraphs

Comments:

Magna International has a slightly wider valuation corridor than some of our other dividend growers. As you can see from the Blue Line on the graph (Normal P/E) and the Black Line (Price), there has been quite a swing in valuation recently. A company that traded below a 10 P/E for most of the last decade has now traded at more than a 22 P/E (almost twice its average) as recently as June of 2021.

The fundamentals show a company whose earnings have grown steadily over the last ten years at an annualized rate of ~14.36%. One other thing of note is that with Magna’s transformation into an EV company, Analysts are predicting an uptick in earnings growth out until the end of 2024 at a much higher growth rate (~28%).

Performance Graph:

Magna International Performance Chart
Source: FASTgraphs

Comments:

Magna International has an annualized dividend growth rate of 15.86% over the last ten years. The company also has an annualized Total Return of 20.29% over that time period. MG-T recently announced a dividend increase of ~5.0% for 2022 which is about half of last year’s increase. Magna has been a terrific investment over the last decade both from a capital and income growth perspective.

Estimated Earnings:

Magna International Forecasting Calculators
Source: FASTgraphs

Comments:

Using the “Normal Multiple’ estimating tool from FASTgraphs, we see a blended P/E average over the last five years of 10.64. Based on Analysts’ forecasts two years out, you can expect an annualized return based on today’s price of 14.67% should MG-T trade at its five-year average blended P/E.

Blended P/E is based upon a weighted average of the most recent actual value and the closest forecast value.

Of importance is that Analysts have been revising their estimates downwards recently. Both the six and three months ago projections for 2022 and 2023 have been dropping. It means that Analysts are more bearish on Magna in the short term.

Analyst Scorecard:

Magna International Analyst Scorecard
Source: FASTgraphs

Comments:

Analyst estimates over the years are fairly accurate based on one and two-year earnings projections. Analysts’ projections have hit or beat ~70% of the time on one-year estimates and ~76% on two-year estimates.

Recent Earnings Report-Q4 2021:

“Although 2021 presented its share of challenges, we delivered above-market sales growth and generated solid free cash flow, as we worked closely with our customers and suppliers to minimize the impacts on vehicle production. Despite significant input cost headwinds, we expect improved operating results in 2022 as the industry recovers and production schedules normalize. In addition, we remain confident in our ability to capitalize on the opportunities in front of us, especially in the areas of electrification, autonomy and new mobility.”

– Swamy Kotagiri, Magna’s Chief Executive Officer

Highlights

Fourth Quarter 2021 Highlights

  • Sales of $9.1 billion decreased 14%, compared to a 17% decrease in global light vehicle production
  • Diluted earnings per share and adjusted diluted earnings per share of $1.54 and $1.30, respectively, compared to $2.45 and $2.83 last year
  • Returned $378 million to shareholders through share repurchases and dividends
  • Raised quarterly cash dividend by 5% to $0.45 per share

Full Year 2021 Highlights

  • Sales of $36.2 billion increased 11%, compared to global vehicle production which increased 4%
  • Diluted earnings per share and adjusted diluted earnings per share of $5.00 and $5.13, respectively, compared to $2.52 and $3.95 last year
  • Returned over $1 billion to shareholders through share repurchases and dividends

Summary:

Input cost increases due to inflation and the semi-conductor crisis have and will continue to affect Magna’s fundamentals in the short run. A belief in the ability of central banks to manage inflation through interest rate hikes and an improvement in the chip shortage situation in the coming year, will be required to see Magna’s fundamentals improve in 2022. Looking further ahead, the company is well positioned to take advantage of growth opportunities as the auto industry undergoes significant transformation.

When we have purchased Magna shares in the past (MP Wealth-Builder CDN Portfolio), it was always when the P/E was below 8. Although those days may be behind us now, we would like to see a further pullback in the share price or at the very least a clear indication that some of the operational headwinds they experienced in 2021 are now behind them. Like most investors right now, we are waiting for a better entry point.

MP Market Review – February 25, 2022

Last updated by BM on February 28, 2022

“Most of the returns in stocks are concentrated in sharp bursts beginning in periods of great pessimism or fear, as we saw most recently in the 2020 pandemic decline. We believe time, not timing, is key to building wealth in the stock market.” – Bill Miller

After several years of market exuberance, we are finally seeing a correction in 2022. Outside of the ‘story stocks’, which never really had any solid fundamentals to begin with, many companies are simply coming back down to earth from their excessive valuations. JPMorgan stated last week that even with the correction so far in 2022, the markets still have another 11% to decline before they return to their historical fair value. Throw in the threat of rising interest rates and the geopolitical concerns with the Russian invasion of Ukraine and you have a market that has still not found its footing.

One of the reasons we were attracted to dividend growth investing initially was because we were tired of obsessing over every geopolitical event or what central bankers will do next. We were looking for a proven strategy that doesn’t care what happens with the economy over the long-term.

Right now, we think it is prudent to be patient when it comes to entering or adding to many of our positions until the markets do what they always do, revert to the mean. We will be ready when they do.

Performance of ‘The List’

‘The List’ was flat this week with a negative 0.6% YTD price return (capital) but another uptick in dividend growth with two new dividend announcements for an average increase of 8.2% in income so far in fiscal 2022.

The best performers last week on ‘The List’ were Alimentation Couche-Tard Inc. (ATD-T) up 3.1%; Enbridge Inc. (ENB-T) up 2.9%; Loblaws (L-T) up 2.8%.

CCL Industries (CCL-B-T) was the worst performer this week, down -5.7%.

Two companies on ‘The List’ announced a dividend increase and four companies announced their Q4 and Full Year 2021 earnings reports. In addition, Royal Bank reported on their Q1 2022 earnings.

Recent News

If you were like most people, you were glued to the television when Russia invaded Ukraine this past week. Equally disconcerting for investors was the significant volatility in the markets as a result. Although market corrections are unpleasant, they typically don’t last long, and they provide great opportunities to investors who don’t panic. Having a time-tested process, as we do, tells us not to panic and wait for our good dividend growers to reach a ‘sensible price’ or even better, go on sale.

I’ll go over all our earnings reports in a moment. I’ll also preview three more earnings reports for next week.

Here are a few of the companies on ‘The List’ due to report earnings this week:

TD Bank (TD-T) is scheduled to report earnings before the market opens Thursday, Mar. 03

Enghouse Systems Limited (ENGH-T) is scheduled to report earnings after hours Thursday, Mar. 03

Algonquin Power & Utilities (AQN-T) is scheduled to report earnings after hours Thursday, Mar. 03

Dividend Increases

There were two companies on ‘The List’ that announced a dividend increase this past week.

Stantec Inc. (STN-T) on Wednesday said it increased its 2022 quarterly dividend from $0.165 to $.18 per share, payable April 18, 2022, to shareholders of record on Mar. 31, 2022.

This represents a dividend increase of 9.1%, for this global leader in design and engineering.

CCL Industries (CCL-B-T) on Thursday said it increased its 2022 quarterly dividend from $0.21 to $.24 per share, payable March 31, 2022, to shareholders of record on Mar. 17, 2022.

This represents a dividend increase of 14.3%, for this world leader in specialty label, security, and packaging solutions.

Earnings Releases

We had five earnings reports from companies on ‘The List’ this past week. Let’s start with Canadian Utilities.

Canadian Utilities Limited (CU-T)

“Overall, Canadian Utilities had a great 2021 that saw us advance key growth initiatives while delivering strong year-over-year earnings growth for our shareholders. The groundwork that we’ve laid to establish ourselves as leaders in the energy transition space positions us well heading into 2022, and I am excited to continue pushing the business and these key initiatives forward.”

The company published these highlights:

 Q4 2021 Financial Results

  • Invested $334 million in capital projects in the fourth quarter of 2021, of which 75 per cent was invested in regulated utilities and 25 per cent mainly in Energy Infrastructure.
  • Announced the acquisition of the Alberta Hub natural gas storage facility near Edson, Alberta. The Alberta Hub underground natural gas storage facility has a capacity of approximately 49 petajoules and is connected to the NOVA Gas Transmission (NGTL) system.
  • On January 18, 2022, Canadian Utilities’ parent company, ATCO, announced a comprehensive set of 2030 environmental, social and governance targets, and a commitment to achieve net zero greenhouse gas (GHG) emissions by 2050.
  • On January 13, 2022, Canadian Utilities declared a first quarter dividend of 44.42 cents per share or $1.78 per Class A non-voting and Class B common share on an annualized basis, a 1 per cent increase over the 43.98 cents paid in each of the four previous quarters. Canadian Utilities has increased its dividend per share for 50 consecutive years, the longest track record of annual dividend increases of any publicly traded Canadian company.

Annual 2021 Financial Results (Comments from Brian Shkrobot, EVP and CFO)

  • 2021 was another great year for Canadian Utilities Limited. We achieved adjusted earnings growth of $586 million or $2.17 per share for 2021. This is $51 million and $0.21 per share higher than 2020. While our businesses overall performed very well in 2021, this growth in year-over-year earnings was primarily driven by the performance of our LUMA Energy business and continued strong performance from ATCO Gas Australia throughout the full 2021 year.
  • As we’ve messaged in our last few conference calls, we’ve been awaiting the final approvals from both the AUC and the Canadian Energy Regulator on our acquisition of the Pioneer Pipeline and the subsequent transfer of a 30-kilometre segment to Nova Gas Transmission Limited (NGTL). I am happy to report that as of January 2022 we have now received all outstanding approvals related to this transaction
  • Switching to our Alberta distribution utilities, we continue to gain additional clarity on the 2023 cost of service rebasing year that will follow the second performance-based regulation term that concludes in 2022. While there’s still additional work to be done and filings to be processed by the regulator, early decisions support the expectation of a fair and prospective regulatory framework for our distribution utilities in 2023. Notably, the AUC has agreed to a hybrid approach to the forecasting of 2023 costs which will see applied for costs compared to an average of 2018 to 2020 actual costs. We expect to have these decisions on these application for both our Alberta distribution utilities in the third quarter of 2022.
  • In 2021, we invested $1.3 billion in our business with $1.1 billion of this being invested in our core utilities. This ongoing utility investment ensures a continued generation of stable earnings and reliable cash flows from our utility businesses and drives rate base growth. When compared to 2020 capital investment, this represents an increase of $221 million. The largest share of this increase is associated with our Pioneer Pipeline acquisition.
  • Collectively, projects initiated in 2021 represent a significant step forward for our energy transition strategy. As our solar and renewable natural gas developments are completed in late 2022, we will start to see the earnings and cash flows benefited by the bite-sized and rapidly executable nature of these initiatives.

If you like a safe 5% yield, then companies don’t get much better than CU-T. Their most recent dividend increase put them in an elite class of dividend growers (50-year streak). They are the only Canadian company to achieve such a milestone. The problem with CU-T is that there is very little growth to their dividend so companies with an average starting yield (2.5-3.5%) and high single digit growth, easily catch up within a decade. Be careful when you chase high yielding stocks thinking they will provide you with a growing income in retirement. Of the twenty-seven companies on ‘The List’ only six have a lower yield now, after a decade, than CU-T and all of them had much higher total returns.

Stantec (STN-T)

“In addition to achieving record earnings this year, several important strategic milestones attained in 2021 position us for accelerated value creation in 2022 and beyond,” said Gord Johnston, President and CEO. “The acquisition of Cardno, along with the five other acquisitions we made in 2021, expand our presence in key business lines such as environmental services and the energy transition, and key geographies like the United States and Australia that are poised for strong growth. Looking forward, we see a strong multi-year cycle ahead for the industry which will support expansion of our record 2021 Adjusted EBITDA margin and earnings.”

The company published these highlights:

 Q4 2021 Financial Results

  • Net revenue, on a constant currency basis, increased 8.7% or $75.0 million, driven by acquisition growth of 6.7% and organic growth of 2.0%; including the effects of foreign exchange, net revenue increased $54.5 million. Without the impact of TMEP, organic growth would have been 4.2%, reflecting strong growth achieved in Canada and Global, and organic growth across most business lines with the exception of Infrastructure which stayed consistent with the prior period.
  • Project margin increased 11.3%, or $51.6 million, and increased as a percentage of net revenue from 52.8% to 55.3%, primarily from higher net revenue, a shift in project mix, and strong project execution.
  • Adjusted EBITDA from continuing operations increased 2.6% or $3.6 million to $142.1 million, representing 15.5% of net revenue compared with $138.5 million or 16.1% of net revenue in the prior period. The increase in project margin was partly offset by higher administrative and marketing expenses, most notably a $13.4 million increase in share-based compensation expense (146 basis points as a percentage of net revenue) reflecting the revaluation of incentive plans due to an increase in Stantec’s share price. As well, 2020 included the recovery of certain claim costs.
  • Net income from continuing operations increased 11.4%, or $1.7 million, to $16.6 million, net income from continuing operations as a percentage of net revenue increased from 1.7% to 1.8%, and diluted EPS increased by 15.4%, or $0.02, to $0.15. Strong project margin, lower non-cash net lease asset and related property and equipment impairments and adjustments for onerous contract costs from the continued execution of the 2023 Real Estate Strategy, and non-cash fair value gains on equity investments contributed to a higher net income, partly offset by lower utilization in the US and higher amortization of intangible assets and acquisition and integration costs related to recent acquisitions.
  • Adjusted net income decreased 4.8%, or $3.2 million, to $63.8 million, representing 7.0% of net revenue, and adjusted diluted EPS decreased 5.0%, or $0.03, to $0.57. Q4 2020 adjusted net income benefited from the favorable recovery of claim costs and resolution of certain tax matters.

Full-Year 2021 Financial Highlights

  • Full-year net revenue was $3.6 billion, a 2.6% increase on a constant currency basis compared with the prior year, driven by acquisition growth of 3.9%, partly offset by a slight organic retraction. Excluding the impact of the descoped Trans Mountain Expansion Project (“TMEP”), organic growth was 0.3% driven by strong performances in Canada and Global and offset by a slower US recovery. Fluctuations in foreign currencies resulted in negative foreign exchange impacts of 3.9%.
  • The Canadian dollar strengthened considerably relative to the US dollar during the year, with the average exchange rate shifting to $1.25 in 2021 from $1.34 in 2020. This reduced 2021 net revenues by $130.7 million. Stantec further estimates that the impact to adjusted EBITDA, adjusted net income, and adjusted diluted EPS was approximately $16.6 million, $6.5 million, and $0.06 per share, respectively.
  • Project margin increased $32.8 million or 1.7% to $2.0 billion and increased as a percentage of net revenue from 52.4% to 54.0%, as a result of strong project execution in all geographies and businesses and shifts in project mix.
  • Adjusted EBITDA from continuing operations was $573.8 million, approximating amounts generated in 2020 and increasing as a percentage of net revenue by 10 basis points to a record 15.8% from 15.7%. The increase in project margin was partly offset by higher administrative and marketing expenses, most notably a $30.3 million increase in share-based compensation expense (83 basis points as a percentage of net revenue) reflecting the revaluation of incentive plans due to an increase in Stantec’s share price.
  • The 2023 Real Estate Strategy contributed more than $0.18 per share in cost savings to net income ($0.15 per share savings to adjusted net income). On a pre-IFRS 16 basis, the cumulative impact from this initiative is estimated to have increased 2021 adjusted EBITDA margin by more than 100 basis points. As further progress was made on the Real Estate Strategy in 2021, additional leased spaces were identified to vacate and sub-let, and expectations for sub-let opportunities were adjusted to reflect current market conditions and outlook. This led to a $24.8 million non-cash net impairment of lease assets and related property and equipment and $12.5 million in onerous contract costs being recorded. Stantec is on track to achieve a 30% reduction in its real estate footprint relative to its 2019 baseline and expects to deliver a further $0.20 to $0.25 contribution to earnings per share by the end of 2023.
  • Net income from continuing operations increased 26.1%, or $41.6 million, to $200.7 million; net income margin from continuing operations increased 1.2% from 4.3% to 5.5%, and diluted EPS increased 26.8%, or $0.38, to $1.80. Factors contributing to higher net income include project margin growth, lower interest and depreciation, unrealized fair value gains from equity investments, the combined effects of the 2023 Real Estate Strategy, and a lower effective tax rate partially offset by increased acquisition and integration costs.
  • Adjusted net income from continuing operations increased 8.4%, or $21.0 million, to $269.9 million, representing 7.4% of net revenue, an improvement of 60 basis points, and adjusted diluted EPS increased 9.0%, or $0.20, to $2.42.
  • Contract backlog stands at a record $5.1 billion—a 17.3% increase from December 31, 2020—representing approximately 13 months of work (11 months of work in 2020). Year over year, backlog grew 11.9% through acquisitions and 6.7% organically, with organic growth in all geographies. Of particular note, US backlog achieved 10.2% organic growth, with US Environmental Services recording over 50% organic growth. Further, Environmental Services backlog across all Stantec stands at over $1 billion, a new high-water mark for this business operating unit.
  • Net debt to adjusted EBITDA was 1.8x at December 31, 2021 —within the guideline range of 1.0x to 2.0x. The ratio increased as a result of additions to net debt from acquisitions made in the fourth quarter.
  • Operating cash flows from continuing operations decreased 34.1% from $602.6 million to $397.0 million; this was mainly due to decreased cash receipts from clients, negative foreign exchange impacts, and increased payments paid to suppliers.
  • Days sales outstanding (“DSO”) was 75 days at December 31, 2021 and 2020, well below the expectation of 80 days.
  • In 2021, 939,482 common shares were repurchased for an aggregated price of $50.7 million under the normal course issuer bid which was renewed on November 9, 2021, to allow for the repurchase of up to an additional 5,559,312 common shares.
  • On February 23, 2022, Stantec’s Board of Directors declared a dividend of $0.18 per share, payable on April 18, 2022, to shareholders of record on March 31, 2022, representing an 9.1% increase on an annual basis.

Outlook

Targets for 2022 are based on the assumption of a continued gradual global recovery but may not be valid should any of our key geographies experience a severe worsening of the pandemic.

MP Market Review February 25 2022

Net revenue is expected to increase 18% to 22% in 2022, and organic net revenue growth is expected to be in the mid to high single digits, weighted to the second half of the year. Organic growth in the US is expected to be in the high single digits, driven by growing momentum as evidenced by Stantec’s record-high US backlog and project opportunities arising from the $1.2 trillion infrastructure stimulus bill. After a year of robust organic growth in Canada in 2021, high levels of activity are expected to be maintained, driving 2022 organic growth in the low single digits. Organic growth in Global is expected to achieve high single to low double-digit growth propelled by strong economic growth, continued demand, and stimulus in infrastructure sectors.

Project margin as a percent of net revenues is expected to be relatively consistent in 2022 compared to 2021.  Adjusted EBITDA margin is anticipated to be in the range of 15.3% to 16.3%, reflecting investments in internal resources to support growth and the commercialization of new innovations and technologies, and increased discretionary spending (albeit not to pre-pandemic levels). Adjusted EBITDA margin in Q1 2022 will likely be at or below the low end of this range because of the additional effects of regular seasonal factors in the northern hemisphere and the protracted ramp-up of US activities and major projects awarded in Q4 2021. The higher end of the range is expected to be reached by the second half of 2022 driven by high organic net revenue growth and increased utilization in the US operations.

Adjusted net income is expected to continue to benefit from the 2023 Real Estate Strategy, which remains on track to achieve a 30% reduction in real-estate footprint compared with a 2019 baseline and a cumulative $0.35 to $0.40 per share by the end of 2023. With $0.15 recognized in 2021, the remaining $0.20 to $0.25 per share is expected to be generated approximately evenly between 2022 and 2023. For 2022, this, in conjunction with continued benefits from tax planning strategies, is expected to drive an adjusted net income margin of 7.5% or greater as a percent of net revenue. As a result, adjusted diluted EPS is expected to grow 22% to 26% in comparison to 2021.


Stantec is a new addition to ‘The List’ in 2022 as they just recently met our criteria of ten consecutive years of dividend growth. Stantec had a great year in 2021 and it looks like 2022 is shaping up to be another one. Stantec’s fundamentals are in line with what we look for in our quality dividend growers. Their dividend growth and price growth are above average, and they tend to align over time. Purchasing STN-T at a sensible price however has been the challenge recently. The YTD pull back in the price of STN-T seems more to do with last years over valuation than a reflection of the operations of the business going forward.

Loblaws (L-T)

The company published these highlights:

 Q4 2021 Financial Results

  • Revenue was $12,757 million. This represented an increase of $349 million, or 2.8% when compared to the fourth quarter of 2020.
  • Retail segment sales were $12,486 million. This represented an increase of $321 million, or 2.6% when compared to the fourth quarter of 2020.
    • Food Retail (Loblaw) same-stores sales increased by 1.1%.
    • Drug Retail (Shoppers Drug Mart) same-store sales increased by 7.9%, with pharmacy same-store sales growth of 10.2% and front store same-store sales growth of 6.1%.
  • The two year sales Compound Average Growth Rate (“CAGR”) was 4.8% and 5.5% for Food Retail and Drug Retail, respectively.
  • The Company’s e-commerce sales decreased by 8.4% (2020 – increased 158%) due to the lapping of high e-commerce sales in the fourth quarter of 2020.
  • COVID-19 related costs were approximately $8 million (2020 – approximately $42 million).
  • Retail segment adjusted gross profit percentage was 30.9%. This represented an increase of 150 basis points compared to the fourth quarter of 2020.
  • Operating income was $705 million. This represented an increase of $70 million, or 11.0% when compared to the fourth quarter of 2020.
  • Adjusted EBITDA was $1,324 million. This represented an increase of $78 million, or 6.3% when compared to the fourth quarter of 2020.
  • Net earnings available to common shareholders of the Company were $744 million. This represented an increase of $434 million, or 140.0% when compared to the fourth quarter of 2020. Diluted net earnings per common share were $2.20. This represented an increase of $1.32, or 150.0% when compared to the fourth quarter of 2020.
    • Net loss attributable to non-controlling interests was $28 million in the fourth quarter of 2021 and represents the share of earnings that relates to the Company’s Food Retail franchisees. Franchisee earnings are impacted by the timing of when profit sharing with franchisees is agreed and finalized under the terms of the agreements. On a full year basis, net earnings attributable to non-controlling interests of $101 million increased by $26 million when compared to 2020, reflecting an improvement in franchisee earnings.
    • During the quarter, the Company recorded a recovery of $301 million related to the Supreme Court of Canada’s decision on the Glenhuron Bank Limited (“Glenhuron”) tax matter, of which $173 million is recorded as interest income and $128 million is recorded as income tax recovery. In addition, net interest of $16 million, before tax, was recorded in respect of interest income earned on expected cash tax refunds. This recovery is expected to be received in 2022 and will increase the Company’s cash and cash equivalents balance.
  • Adjusted net earnings available to common shareholders of the Company were $515 million. This represented an increase of $119 million, or 30.1% when compared to the fourth quarter of 2020.
  • Adjusted diluted net earnings per common share were $1.52. This represented an increase of $0.40, or 35.7% when compared to the fourth quarter of 2020. The two year adjusted diluted net earnings per common share CAGR was 30.0%.
    • The two year adjusted diluted net earnings per common share CAGR was positively impacted by lower fixed asset impairment in 2021 when compared to 2019. The impact on the CAGR was 7.3%.
  • The Company repurchased, for cancellation, 2.0 million common shares at a cost of $200 million and 15.6 million common shares at a cost of $1,200 million on a year-to-date basis.
  • The Company invested $381 million in capital expenditures and generated $460 million of Retail Segment free cash flow.

2021 SELECT ANNUAL HIGHLIGHTS

On a comparable 52-week basis, the Company:

  • Delivered Food Retail same-store sales growth of 0.3% and Drug Retail same-store sales growth of 5.0%.
  • Delivered adjusted net earnings available to common shareholders of the Company of $1,911 million. When compared to 2020, this represented an increase of 30.5%.
  • Delivered adjusted diluted net earnings per common share of $5.59. When compared to 2020, this represented an increase of 36.7%.

In 2021, the Company:

  • Invested approximately $1,103 million in capital expenditures, net of proceeds from property disposals.
  • Returned capital to shareholders by allocating a significant portion of the Company’s Retail segment free cash flow of approximately $2,004 million to share repurchases. In 2021, the Company repurchased, for cancellation, 15.6 million common shares at a cost of $1,200 million.
  • The Company’s e-commerce sales were $3.1 billion and grew by 13.9% when compared to the prior year.

Outlook

Loblaws will continue to execute on retail excellence in its core grocery, pharmacy and apparel businesses while advancing its growth initiatives in 2022. In the third year of the pandemic, the Company’s businesses remain well placed to service the everyday needs of Canadians. However, the Company cannot predict the precise impacts of COVID-19 and the current industry volatility on its 2022 financial results. Loblaw anticipates that in the first half of 2022 sales will benefit from the continued impact of the pandemic and elevated industry-wide inflation. As economies reopen and the Company starts to lap elevated 2021 inflationary prices and COVID-related pharmacy services, year on year revenue growth will be more challenged.

The Company expects:

  • its Retail business to grow earnings faster than sales;
  • Earnings per Common Share growth in the low double digits, with higher growth in the first half of the year;
  • to invest approximately $1.4 billion in capital expenditures, net of proceeds from property disposals, reflecting incremental store and distribution network investments; and
  • to return capital to shareholders by allocating a significant portion of free cash flow to share repurchases.

Loblaws did well during the pandemic and is projecting double-digit growth in the first half of 2022. L-T was one of the first dividend growth stocks we bought back in 2012 in our Magic Pants Wealth-Builder (CDN) Portfolio but it went through a period of low dividend growth, so we ended up selling it for better ideas. Low yield and low growth companies do not meet our standard even if they grow their dividend. Returning capital to shareholders, by growing dividends at a higher than average rate and buying back shares has this quality dividend grower back on our radar.

CCL Industries (CCL-B-T)

Geoffrey T. Martin, President and Chief Executive Officer, commented, “2021 marked our second consecutive year of delivering record results in the midst of a global pandemic as strong growth in sales and adjusted basic earnings per share generated solid free cash flow. This speaks to the resiliency and diversity of our end markets plus the focus and dedication of our amazing people. These results come as the Company faces supply chain disruptions and inflationary issues the likes of which we have rarely seen in our long history.”

The company published these highlights:

 Q4 2021 Financial Results

  • Per Class B share: $0.81 adjusted basic earnings down 3.6%; $0.80 basic earnings down 1.2%; currency translation negative $0.04
  • Sales increased 10.2% on 12.8% organic growth, 1.8% acquisition growth partially offset by 4.4% negative currency translation
  • 0% operating margin down 180 bps on inflation challenges

Full Year 2021

  • Per Class B share: $3.37 adjusted basic earnings, up 9.4%; $3.33 basic earnings up 12.5%; currency translation negative $0.15
  • Sales increased 9.4% on 11.8% organic growth, 2% acquisition growth partially offset by 4.4% negative currency translation
  • Operating income increased 8.2%, with a 15.5% operating margin down 20 bps
  • Consolidated leverage ratio improved to 1.06 for 2021; annual dividend increased 14.3% effective March 17, 2022

Outlook

  • H122 will be a pass-through period of numerous inflation drivers, some supply availability issues, comps should ease as year unfolds
  • Avery should continue to improve, augmented by acquisitions
  • Checkpoint needs to execute price increases to recover inflation in MAS business, expect strength in ALS to continue on RFID growth
  • CCL Design chip shortage issues to continue, especially in Automotive, acquisitions a significant offset
  • CCL HPC, Food & Beverage and Healthcare & Specialty units all dealing with inflation
  • Banknote demand difficult to predict at CCL Secure
  • Resin markets declining in the U.S, Innovia must navigate energy & freight inflation plus the Eco Float start up in Europe

CCL Industries seems to have been impacted by the effects of inflation with their earnings up a bit but not at the rate as in prior years. The recent dividend increase of 14.3% is not something to ignore as it shows a lot of confidence by management in the operations outlook of the business (the safest dividend is the one just hiked). Share price weakness in 2022 has brought this 20-year dividend grower closer to the ‘sensible price’ range we look for.

Royal Bank (RY-T)

“RBC’s firstquarter performance reflects the significant momentum we continue to build while facing change and uncertainty in the current operating environment. This is a testament to our scale, diversified business model, and strategic investments in technology, talent and innovation to create differentiated value for our clients and shareholders. While the Omicron variant has created headwinds to the global economic recovery over the past quarter, RBC employees remained unwavering in their commitment to supporting our clients and communities. I’m proud of how they continue to make a difference in the lives of those we serve. Looking forward, we remain focused on our Purpose-led approach to delivering the advice, products and services our clients need in a changing world, while also accelerating our commitments to enable a sustainable and inclusive future.” Dave McKay, RBC President and CEO

The company published these highlights:

 Q1 2022 Financial Results

Q1 2022 Financial Results

Royal Bank was one the first of the big five banks to report their Q1 2022 earnings and they were good. RY-T continues to roll along as does their share price in 2022. Although RY-T has seen about a 40% increase in their share price during the pandemic, it still isn’t that far outside of its historical valuation corridor. With a starting yield of 3.5% and average dividend growth over the last decade in the 7.5% range. Buying this quality company at a ‘sensible price’ should yield you 11% plus returns (D + G +/- change in P/E).


Below is a snapshot of ‘The List’ from last Friday’s close. For a sortable version of ‘The List’ please click on The List menu item.

‘The List’ is not meant to be a template for investors to copy exactly. Rather, its purpose is to provide investment ideas and a real-time illustration of dividend growth investing in action. It is not a ‘Buy List’ nor does it reflect the composition or returns of our Magic Pants Wealth-Builder CDN Portfolio. It is only a starting point for our analysis and discussion.

The List (2022)
Last updated by BM on February 25, 2022

*Note: The following graph is wide, you can scroll to the right on your device to see more of the data.

SYMBOL COMPANY YLD PRICE YTD % DIV YTD % STREAK
AQN-N Algonquin Power & Utilities 4.8% $14.26 -0.6% $0.68 2.3% 11
ATD-T Alimentation Couche-Tard Inc. 0.9% $51.21 -1.7% $0.44 18.1% 12
BCE-T Bell Canada 5.5% $67.15 1.9% $3.68 5.1% 13
BIP-N Brookfield Infrastructure Partners 3.7% $58.95 -3.5% $2.16 5.9% 14
CCL-B-T CCL Industries 1.6% $59.28 -12.6% $0.96 14.3% 20
CNR-T Canadian National Railway 1.9% $158.24 2.2% $2.93 19.1% 26
CTC-A-T Canadian Tire 2.8% $185.27 1.1% $5.20 10.6% 11
CU-T Canadian Utilities Limited 5.0% $35.24 -3.7% $1.78 1.0% 50
DOL-T Dollarama Inc. 0.3% $65.28 2.9% $0.20 1.7% 11
EMA-T Emera 4.5% $59.26 -5.3% $2.65 2.9% 15
ENB-T Enbridge Inc. 6.4% $54.08 9.2% $3.44 3.0% 26
ENGH-T Enghouse Systems Limited 1.5% $41.37 -9.8% $0.64 4.1% 15
FNV-N Franco Nevada 0.9% $147.13 8.1% $1.28 10.3% 14
FTS-T Fortis 3.7% $58.15 -3.9% $2.14 4.4% 48
IFC-T Intact Financial 2.2% $182.45 11.4% $4.00 17.6% 17
L-T Loblaws 1.4% $100.95 -1.7% $1.46 6.6% 10
MGA-N Magna 2.4% $76.14 -6.7% $1.80 4.7% 12
MRU-T Metro 1.6% $67.26 0.3% $1.10 10.0% 27
RY-T Royal Bank of Canada 3.4% $140.37 2.6% $4.80 11.1% 11
SJ-T Stella-Jones Inc. 1.8% $39.88 -2.0% $0.72 0.0% 17
STN-T Stantec Inc. 1.1% $63.82 -9.1% $0.71 6.8% 10
TD-T TD Bank 3.4% $104.68 5.4% $3.56 12.7% 11
TFII-T TFI International 1.0% $131.32 -6.3% $1.36 17.4% 11
TIH-T Toromont Industries 1.4% $106.82 -6.0% $1.52 15.2% 32
TRP-T TC Energy Corp. 5.4% $66.68 11.6% $3.57 4.4% 21
T-T Telus 4.0% $32.34 8.7% $1.31 4.4% 18
WCN-N Waste Connections 0.7% $124.01 -7.5% $0.92 8.9% 12
Averages 2.7% -0.6% 8.2% 18

MP Wealth-Builder (CDN) Portfolio; The First Ten Years

Posted by BM on February 25, 2022

“Corporations which pay rising dividends are wealth creating machines.” Tom Connolly

A big shout out to one of my mentors, Tom Connolly from Kingston, ON. Thank you, Tom, for introducing me to dividend growth investing (DGI).

Two- and one-half Olympics ago we started the Magic Pants Wealth-Builder (CDN) Portfolio. Most of our research on dividend growth investing was backward looking (historical returns) but the evidence was so overwhelming we decided to take the plunge. Our first DGI stocks were a grocer, utility, pipeline, royalty company and telco. As the saying goes….” the rest is history.”

Here were the total returns generated (dividends included) and the corresponding benchmarks for comparison:

Magic Pants Wealth-Builder CDN Portfolio
Historical Performance
As of December 31, 2021
MP Wealth-Builder CDN TSX Dividend Aristocrat CDN Index TSX Composite Index
Year Total Return Total Return Total Return
2012 29.13% 9.33% 7.19%
2013 15.75% 14.41% 12.99%
2014 25.08% 13.87% 10.55%
2015 -6.63% 10.75% 8.32%
2016 20.21% 21.95% 21.08%
2017 11.15% 5.89% 9.09%
2018 -4.19% 8.28% 8.89%
2019 20.59% 26.29% 22.88%
2020 7.54% -2.28% 5.60%
2021 28.10% 25.91% 25.09%
10YR Compounded Gain: 146.73% 96.34% 97.26%
Annualized Returns
1YR 28.10% 25.91% 25.09%
3YR 18.86% 15.80% 17.52%
5YR 13.27% 8.56% 10.04%
10YR 12.95% 8.86% 9.14%
Source: Magic Pants Dividend Growth Investing Inc. & S&P Global
Magic Pants Wealth-Builder CDN Sector Breakdown
Dividend Aristocrat CDN Index Sector Breakdown

Source: Magic Pants Dividend Growth Investing Inc. & S&P Global

A ~13% compounded annual growth rate is over 40% better than the indexes. Compared against the top ETFs and dividend funds in Canada will render similar outperformance.

The reason for our outperformance is clear; ETFs and Funds charge management fees; are less concentrated, contain lower quality companies; have higher turnover due to short-term thinking; are less diversified (40-50% in only two sectors); and do not generate the same amount of income our growing dividend portfolio provides. It is no wonder they were unable to keep pace.

To highlight our outperformance, we looked at 100K invested in all three portfolios starting in 2012 and here is what we found:

Magic Pants Portfolio Value
Source: Magic Pants Dividend Growth Investing Inc. & S&P Global

The question then becomes, how did we do it?

“We buy quality individual dividend growth stocks when they are sensibly priced and hold for the growing income.”

I know it sounds simple, but it works. It has worked for decades for others and is the reason we started dividend growth investing in the first place.

Lessons Learned:

Although we are proud of our performance, we did learn a lot over the last ten years. Yes, we made some mistakes but thankfully we stuck to our process. We are a lot wiser and less emotional when it comes to our process now. We are excited about what the future holds.

Lesson #1

Only buy ‘quality’ companies. Early on we purchased a few companies that had respectable dividend growth records but were not sufficiently capitalized and when there was turbulence in the market, they suffered more than our high-quality companies did and were slow to recover. In the end we exited our positions at a loss and chalked one up to experience.

Lesson #2

Do not buy cyclical companies. Cyclicals can do very well when they are in favor but can turn quickly when the cycle trends the other way. Case in point are the pure ‘Energy’ companies in Canada. You need to incorporate ‘market timing’ into your process and hold on for the ride if you want to add cyclicals to your dividend growth portfolio. For most investors the emotional rollercoaster is too much.

Lesson #3

Rarely sell your good dividend growers. Early on we sold some companies too early when they appeared overvalued. They continued to go higher, and we were unable to participate. If you must sell due to perceived overvaluation, sell some, and take your position size down but don’t exit totally. That way if they continue higher, you still have some skin in the game.

Lesson #4

Have a position sizing strategy. First separate your quality companies into ‘Core’ and ‘non-Core’ categories. In Canada, ‘Core’ companies are the ones that are essential to the economy (Telcos, Utilities, Banks, Railroads, Pipelines). Determine based on your own comfort level what percentage of your investable capital you are going to allocate to each individual company in each category.

Lesson #5

Supercharge your returns by having the confidence in a market sell-off to purchase the quality companies on your list. We had a few opportunities over the last ten years to either initiate or add to our core positions at a steep discount. We ended up being too conservative when the opportunities presented themselves and our returns were not as good as they could have been. Have a chat with yourself prior to a sell-off on what your strategy would be and try and eliminate the emotion for when the time comes. Trust the process.

In summary, it was a good decade for many types of investing methodologies, and we realize that most returns were higher than historical norms. With that said, we still outperformed the market by a wide margin with DGI.

Do you have a repeatable investing process? We prefer dividend growth investing because it less active than other forms, does well in both bull and bear market cycles and no matter what, we always have our growing income to fall back on. If you are still unsure, give it a try with a percentage of your portfolio and track your performance against other strategies you believe in. If you are like us, you will like what you see.

For those of you who need a little more help, you can always subscribe to the blog and build your portfolio alongside ours.

MP Market Review – February 18, 2022

Posted by BM on February 21, 2022

“If you have premium high-compound growth non-cyclicals, it is not really necessary to get out if the stock price goes high. If far to high, obviously you can trim a bit and pay some tax, but be sure your gains have been real, not inflation mirages. Personally, I normally just hold and take a few down drafts, counting on the next bull market to take me up again.” Page 104, The Investment Zoo, Stephen Jarislowsky

MP Market Review February 18 2022 grocery
Source: Globe & Mail

“Not exactly consoling as we gaze at Wednesday morning’s report from Statistics Canada that inflation jumped to 5.1 per cent in January. That’s a 30-year high, and higher than economists had expected.” Globe & Mail.

I read three articles in the Globe & Mail this week related to rising inflation and what to do about it. They recommend holding dividend growth stocks and gold as a hedge. We aren’t that worried about inflation as our dividend growers are quality companies and our income is growing at a faster rate than inflation. ‘The List’ is already up 7.4% (dividend growth) in 2022 and not all companies have increased their dividends yet.

To sum it all up, we are looking for two things, companies that are effective as an inflation hedge in the presence of inflation, but also their performance as an asset in the absence of it. 

Performance of ‘The List’

‘The List’ was down a bit this week with a negative 0.6% YTD price return (capital) and an average of 7.4% in dividend growth (income) added so far for fiscal 2022.

The best performers last week on ‘The List’ were Canadian Tire Corp. (CTC-A-T) up 5.6%; Franco Nevada (FNV-N) up 4.0%; Canadian National Railway (CNR-T) up 2.5%.

Alimentation Couche-Tard Inc. (ATD-T) was the worst performer this week, down -7.4%.

One company on ‘The List’ announced a dividend increase and four companies announced their Q4 and Full Year 2021 earnings reports.

Recent News

Despite this week’s ugly inflation report from Statistics Canada, It’s not all bad news. The earnings reports from companies on ‘The List’ continue to be quite good with most surpassing Analyst expectations. This week, Waste Connections and Canadian Tire beat earnings. Canadian Tire saw the most improvement in 2021 with EPS growth up over 45% and Waste Management gave optimistic double-digit earnings guidance for this year. Emera and TC Energy missed earnings by a penny, with TC Energy raising their dividend to .90 cents per share.

I’ll go over all of our earnings reports in a moment. I’ll also preview four more earnings reports for next week.

Here are a few of the companies on ‘The List’ due to report earnings this week:

Canadian Utilities Limited (CU-T) is scheduled to report earnings after hours Wednesday Feb. 23

Stantec (STN-T) is scheduled to report earnings after hours Wednesday Feb. 23

Loblaws (L-T) is scheduled to report earnings before the market opens Thursday Feb. 24

CCL Industries (CCL-B-T) is scheduled to report earnings after hours Thursday Feb. 24

Dividend Increases

There was one company on ‘The List’ that announced a dividend increase this past week.

TC Energy (IFC-T) on Tuesday said it increased its 2022 quarterly dividend from $0.87 to $.90 per share, payable April 29, 2022 to shareholders of record on Mar. 31, 2022.

This represents a dividend increase of 3.45%, marking the 22nd consecutive year of dividend growth for this ‘utility like’ pipeline company.

Earnings Releases

We had four earnings reports from companies on ‘The List’ this past week. Let’s start with Emera.

Emera (EMA-T)

“We are pleased with the performance of our business in 2021, as we delivered solid financial results and achieved important regulatory outcomes, while continuing to deliver the critical energy needs of our customers during the ongoing COVID-19 pandemic…”

The company published these highlights:

 Q4 2021 Financial Results

  • Q4 2021 reported net income was $324 million, or $1.24 per common share, compared with net income of $273 million, or $1.09 per common share, in Q4 2020.
  • Q4 2021 adjusted net income was $168 million, or $0.64 per common share, compared with $188 million, or $0.75 per common share, in Q4 2020.

Annual 2021 Financial Results

  • 2021 reported net income was $510 million or $1.98 per common share, compared with a net income of $938 million or $3.78 per common share in 2020. 2021 reported net income included a $213 million after-tax MTM loss primarily at Emera Energy.
  • 2021 adjusted net income was $723 million or $2.81 per common share, compared with $665 million or $2.68 per common share in 2020.
  • Growth in annual adjusted net income was driven by higher earnings contribution from EES, PGS and Nova Scotia Power (“NSPI”), lower corporate costs, realized gains on foreign exchange hedges and the 2020 revaluation of deferred taxes due to a reduction in the Nova Scotia corporate income tax rate. The increase was partially offset by the impact of a stronger CAD, the TGH award received in Q4 2020, the 2020 recognition of a corporate income tax recovery at Barbados Light and Power Company (“BLPC”), and lower earnings due to the sale of Emera Maine in Q1 2020.
  • Strengthening of the CAD decreased net income by $10 million ($0.04 per share) and decreased adjusted net income1 by $1 million in Q4 2021 compared to Q4 2020. The strengthening of the CAD decreased net income by $17 million ($0.07 per share) and adjusted net income by $28 million ($0.11 per share) for the year ended December 31, 2021, compared to the same period in 2020.
  • Decreased quarterly adjusted net income was largely due to the TECO Guatemala Holdings (“TGH”) award received in Q4 2020. Excluding the impact of the award, growth in quarterly net income was driven by higher earnings primarily at Peoples Gas System (“PGS”) lower corporate costs, partially offset by lower contributions from Tampa Electric.

Outlook

Emera’s capital investment plan is $8.4 billion over the 2022-to-2024 period (including a $240 million equity investment in the LIL in 2022), with an additional $1 billion of potential capital investments over the same period. This results in a forecasted rate base growth of approximately 7 per cent to 8 per cent through 2024. The capital investment plan continues to include significant investments across the portfolio in renewable and cleaner generation, reliability and integrity investments, infrastructure modernization and customer-focused technologies.

Emera’s capital investment plan is being funded primarily through internally generated cash flows and debt raised at the operating company level. Equity requirements in support of our capital investment plan are expected to be funded through the dividend reinvestment plan, the issuance of preferred equity and the issuance of common equity through our at-the-market program. Maintaining investment-grade credit ratings is a priority of management.

Emera has provided annual dividend growth guidance of four to five per cent through to 2024.

“We are pleased with the performance of our business in 2021, as we delivered solid financial results and achieved important regulatory outcomes, while continuing to deliver the critical energy needs of our customers during the ongoing COVID-19 pandemic,” said Scott Balfour, President and CEO of Emera Inc. “This progress highlights the strength of our business and strategy that continues to drive value and growth through investments in cleaner energy, infrastructure renewal and service reliability, all at a balanced pace to ensure affordability for our customers.”

With a current yield of 4.55% and dividend growth projected to be in the 4-5% range, EMA-T has generated solid growing income for 15 years now. Purchasing this popular income stock at a sensible price requires patience.

TC Energy (TRP-T) is one of the top performers on ‘The List’ in 2022.

“Our $100 billion diversified portfolio of high-quality, long-life energy infrastructure assets continued to perform extremely well in 2021 as evidenced by our strong financial results…”

The company published these highlights in their Q4 earnings report:

Fourth quarter 2021 financial results

  • Net income attributable to common shares of $1.1 billion or $1.14 per common share ◦ Segmented earnings of $1.9 billion
  • Net cash provided by operations of $1.8 billion
  • Comparable earnings of $1.0 billion or $1.06 per common share
  • Comparable EBITDA of $2.4 billion
  • Comparable funds generated from operations of $2.1 billion

For the year ended December 31, 2021

  • Net income attributable to common shares of $1.8 billion or $1.87 per common share
  • Segmented earnings of $4.1 billion
  • Net cash provided by operations of $6.9 billion
  • Comparable earnings of $4.2 billion or $4.27 per common share
  • Comparable EBITDA of $9.4 billion
  • Comparable funds generated from operations of $7.4 billion

Corporate

Common share dividend: Our Board of Directors declared a quarterly dividend of $0.90 per common share for the quarter ending March 31, 2022. The quarterly amount is equivalent to $3.60 per common share on an annualized basis, an increase of 3.45 per cent.

Recent management changes: Bevin Wirzba’s role has expanded to Executive Vice-President, Strategy and Corporate Development and Group Executive, Canadian Natural Gas and Liquids Pipelines following the news that Tracy Robinson, former Executive Vice-President and President, Canadian Natural Gas Pipelines and President, Coastal GasLink has decided to pursue a significant leadership role with another organization. Bevin will be supported by Greg Grant, President, Canadian Natural Gas Pipelines and Richard Prior, President, Liquids Pipelines.

RBC Capital Markets thinks that the recent uptick in share price is due to money rotating into TRP-T and out of Utilities due to interest rate fears. TRP-T noted that with 95% of its business being contracted and/or regulated, only about 20% of its operating costs are exposed to near-term inflation. As a result, inflation should not be a material risk to earnings, according to RBC.

We agree, this pipeline company’s fundamentals look more like a company in the utility sector than an energy one. Nice dividend increase announcement as well; Twenty-two years and counting!

Waste Connections (WCN-N)

“… with a step-up in capital expenditures and over $1 billion in acquisition outlays in 2021, positions us for continued double digit growth in 2022, while preserving the balance sheet strength and flexibility to capitalize on another potential above average year of acquisition activity.”

Fourth Quarter Highlights

  • Strong price-led organic growth and acquisition activity, along with continuing underlying margin expansion, drives Q4 results above expectations and provides higher entry point into 2022
  • Revenue of $1.624 billion, net income(a) of $166.3 million, and adjusted EBITDA(b) of $495.4 million, or 30.5% of revenue
  • Net income and adjusted net income(b) of $0.64 and $0.83 per share, respectively

Full Year 2021 Highlights

  • Revenue of $6.151 billion, up 13.0%
  • Net income of $618.0 million, or $2.36 per share, and adjusted net income(b) of $846.6 million, or $3.23 per share, up 22.3%
  • Adjusted EBITDA(b) of $1.919 billion, up 15.5%, and adjusted EBITDA margin of 31.2%, up 70 basis points
  • Net cash provided by operating activities of $1.698 billion, up 20.6%
  • Adjusted free cash flow(b) of $1.010 billion, up 19.9% on capital expenditures of $744.3 million, up 24.7%
  • Completes acquisitions with approximately $400 million of total annualized revenue in 2021

Expectations for 2022

  • Strong pricing and acquisition growth to drive double digit percentage increases in revenue and adjusted free cash flow, along with continuing underlying margin expansion
  • Revenue of approximately $6.875 billion, up 11.8%, excluding additional acquisitions
  • Net income of approximately $846 million and adjusted EBITDA of approximately $2.145 billion, or about 31.2% of revenue
  • Net cash provided by operating activities of approximately $2.000 billion
  • Adjusted free cash flow of approximately $1.150 billion, up 13.9%, on capital expenditures up 14.2% to approximately $850 million, including $100 million for new landfill gas and resource recovery facilities
  • Increasing return of capital to shareholders, including opportunistic share repurchases

“2021’s results are a reflection of how a culture of commitment and accountability to all stakeholders enabled us to excel in a challenging operating environment, overcome inflationary pressures and supply chain issues, execute our growth strategy, expand margins, support employee health and welfare, and position the Company well for 2022 and beyond.  The year ended on a high note, as strong solid waste organic growth and acquisition activity, along with continuing underlying margin expansion, drove Q4 financial results once again above expectations.  We are also extremely pleased with our results for the full year, as adjusted EBITDA margin expanded 70 basis points. Moreover, we delivered 20% growth in adjusted free cash flow to $1.010 billion, in spite of capital expenditures up 25%, as we continued to reinvest in and grow our business,” said Worthing F. Jackman, President and Chief Executive Officer.

“Acquisition activity accelerated in the fourth quarter, resulting in approximately $400 million in acquired annualized revenues in 2021 and setting up acquisition contribution approaching 6% in 2022, including transactions completed year to date. Along with solid waste pricing growth of about 6.5%, this already positions us for double-digit percentage growth in revenue, adjusted EBITDA(b) and adjusted free cash flow in 2022.  Additional acquisitions expected to be completed during the year, improvement in commodity-driven revenues and E&P waste activity, or moderation of inflationary trends would provide incremental benefit.”

Mr. Jackman continued, “The strength and consistency of our results reflect the durability of our market model and the benefits of an intentional culture focused on employees and value creation.  Proactive pricing, along with a step-up in capital expenditures and over $1 billion in acquisition outlays in 2021, positions us for continued double digit growth in 2022, while preserving the balance sheet strength and flexibility to capitalize on another potential above average year of acquisition activity, invest in sustainability-focused growth projects and increase return of capital to shareholders.”

WCN-N was one of the top performers on ‘The List’ in 2021 but its stock has come under pressure in 2022 if for no other reason than overvaluation. With an ‘analyst beating’ earnings report and positive management guidance for 2022, there is a lot to like about WCN-N.

A further market downturn could finally present an opportunity to build a position in this quality waste management dividend grower, at a sensible price.

Canadian Tire Corp. (CTC-A-T)

“Our exceptional results in the fourth quarter capped off an outstanding year for CTC-A-T in which we delivered record EPS and remarkable sales growth for the second consecutive year.”

Fourth Quarter Highlights

  • Q4 2021 marked the second consecutive year of outstanding comparable sales growth, with consolidated comparable sales, excluding Petroleum, up 11.3%, driven by strong performances across all banners
  • Canadian Tire Retail (CTR) comparable sales grew 9.8% vs 2020, with SportChek and Mark’s up 15.9% and 15.0%, respectively
  • Consolidated revenue, excluding Petroleum, was up 2.8%, despite strong comparatives and an extra week in the fourth quarter last year
  • Owned Brands represented 40% of sales across the banners, with Canvas and Noma leading the impressive growth
  • eCommerce sales reached approximately $500 million, with eCommerce penetration rate for retail banners at 9.5%, nearly double pre-pandemic levels
  • EPS performance reflected strong retail segment performance
    • Diluted EPS of $8.34 was up 4.6% compared to Q4 2020; normalized diluted EPS2 of $8.42 was up slightly on the fourth quarter of 2020
    • Retail segment Income before income taxes (IBT) increased $60.2 million, driven by exceptional sales performance and improved gross margins
    • A $52.6 million decrease in Financial Services IBT was mainly driven by increased receivables allowance and credit card acquisition costs
  • More than 770,000 members joined the Triangle program in the fourth quarter, up 23%
    • A more digitally-and mobile-engaged age segment (30-49 years old) represented 41% of new members
    • Acquisition of new credit card members was up 36% vs Q4 2020
    • Triangle members shopping cross-banner was at 41%, up more than 92bps

Full Year Highlights

2021 marked a second consecutive year of significant growth in sales (including exceptional growth in eCommerce) and revenue, which drove remarkable growth in earnings

  • Consolidated comparable sales, excluding Petroleum were up 8.2% over prior year and up 18.3% vs 2019
  • eCommerce sales were up 29.9% vs 2020 to more than $2 billion in sales
  • Retail sales, excluding Petroleum, were up 6.7% vs 2020 and 18.5% vs 2019
  • Retail revenue, excluding Petroleum, was up 8.8% vs 2020 and 17.9% vs 2019

Full-year diluted EPS reached a record level, up 49.3% to $18.38; normalized diluted EPS was $18.91, up 45.5%

  • Outstanding returns on invested capital translated into an increase in Retail ROIC, from 10.8% at the end of 2020 to 13.6% at the end of 2021
  • Retail segment IBT was up 59.2%, driven by exceptional sales performance and improved gross margins
  • Higher gross margin for the year, primarily attributable to lower net impairment losses, was the main driver of a 32.1% increase in Financial Services IBT

The Triangle program attracted 2.4 million new members and ended the year with 11 million Triangle members, including 2.2 million active credit cardholders

“Our exceptional results in the fourth quarter capped off an outstanding year for CTC-A-T in which we delivered record EPS and remarkable sales growth for the second consecutive year. Our fourth quarter comparable sales increase of 11% in 2021 reflects the continued strength and relevance of our unique multi-category assortment and the success of our strengthened omni-channel capabilities. We welcomed 2.4 million new Triangle Rewards members in 2021, many of whom joined through SportChek and Mark’s and subsequently shopped at Canadian Tire for the first time. Our growth in membership, including more than 380,000 new Triangle credit card holders acquired by Canadian Tire Bank, demonstrates the value of our assets and our ability to meet our customers’ needs, however they choose to shop us,” said Greg Hicks, President and CEO, Canadian Tire Corporation.

A good earnings report from CTC-A-T. We like the fact that they found growth in new revenue streams during the pandemic.

“eCommerce sales reached approximately $500 million, with eCommerce penetration rate for retail banners at 9.5%, nearly double pre-pandemic levels.”

Below is a snapshot of ‘The List’ from last Friday’s close. For a sortable version of ‘The List’ please click on The List menu item.

‘The List’ is not meant to be a template for investors to copy exactly. Rather, its purpose is to provide investment ideas and a real-time illustration of dividend growth investing in action. It is not a ‘Buy List’, only a starting point for our analysis and discussion.

The List (2022)
Last updated by BM on February 18, 2022

*Note: The following graph is wide, you can scroll to the right on your device to see more of the data.

SYMBOL COMPANY YLD PRICE YTD % DIV YTD % STREAK
AQN-N Algonquin Power & Utilities 4.9% $13.92 -3.0% $0.68 2.3% 11
ATD-T Alimentation Couche-Tard Inc. 0.9% $49.66 -4.7% $0.44 18.1% 12
BCE-T Bell Canada 5.5% $66.72 1.2% $3.68 5.1% 13
BIP-N Brookfield Infrastructure Partners 3.6% $59.76 -2.2% $2.16 5.9% 14
CCL-B-T CCL Industries 1.3% $62.89 -7.2% $0.84 0.0% 20
CNR-T Canadian National Railway 1.8% $159.13 2.7% $2.93 19.1% 26
CTC-A-T Canadian Tire 2.7% $192.39 5.0% $5.20 10.6% 11
CU-T Canadian Utilities Limited 5.0% $34.98 -4.5% $1.76 0.0% 50
DOL-T Dollarama Inc. 0.3% $64.29 1.4% $0.20 1.7% 11
EMA-T Emera 4.5% $58.80 -6.1% $2.65 2.9% 15
ENB-T Enbridge Inc. 6.5% $52.55 6.1% $3.44 3.0% 26
ENGH-T Enghouse Systems Limited 1.6% $40.62 -11.4% $0.64 4.1% 15
FNV-N Franco Nevada 0.9% $147.77 8.6% $1.28 10.3% 14
FTS-T Fortis 3.7% $57.76 -4.5% $2.14 4.4% 48
IFC-T Intact Financial 2.2% $183.61 12.1% $4.00 17.6% 17
L-T Loblaws 1.5% $98.17 -4.4% $1.46 6.6% 10
MGA-N Magna 2.3% $77.42 -5.1% $1.80 4.7% 12
MRU-T Metro 1.6% $66.93 -0.2% $1.10 10.0% 27
RY-T Royal Bank of Canada 3.4% $141.05 3.1% $4.80 11.1% 11
SJ-T Stella-Jones Inc. 1.8% $40.55 -0.3% $0.72 0.0% 17
STN-T Stantec Inc. 1.0% $65.55 -6.6% $0.66 0.0% 10
TD-T TD Bank 3.4% $106.23 6.9% $3.56 12.7% 11
TFII-T TFI International 1.0% $130.44 -7.0% $1.36 17.4% 11
TIH-T Toromont Industries 1.4% $107.93 -5.1% $1.52 15.2% 32
TRP-T TC Energy Corp. 5.3% $66.81 11.9% $3.57 4.4% 21
T-T Telus 4.1% $32.13 8.0% $1.31 4.4% 18
WCN-N Waste Connections 0.8% $121.00 -9.7% $0.92 8.9% 12
Averages 2.7% -0.6% 7.4% 18

MP Market Review – February 11, 2022

Posted by BM on February 14, 2022

“We can beat a bear. 1. Hold through a bear with quality companies: patient retention. 2. Realize that our portfolio of well selected income companies will keep growing (its cash flow) as prices fall. 3. Don’t fret when the price bends a bit. Eventually, with fine firms, CAGR on dividends and price will approach each other. 4. Gradually, we become less dependent on price as a metric, in any case. 5. We knew the bear was coming and winnowed our chaff (weak companies and investment errors).”

-Tom Connolly

The earnings reports for stocks on ‘The List’ this past week were mixed. IFC-T, TFII-T, TIH-T and MGA-N came in well above estimates while T-T, FTS-T and ENB-T were close but slightly missed. IFC-T, TIH-T, ENB-T and MGA-N all raised their dividends.

I’ll go over all our earnings reports in a moment. But first, let’s look at this week’s inflation report coming out of the USA. For January, headline inflation increased by 0.65%.. Over the past year, inflation is up by 7.53%. We are slightly lower in Canada but not by much. That’s the highest year-over-year rate in the United States since February 1982 (that’s 40 years)!

To put this rate of inflation into context, that means that if you have a $1 million portfolio, inflation eats up $75,300 every year.

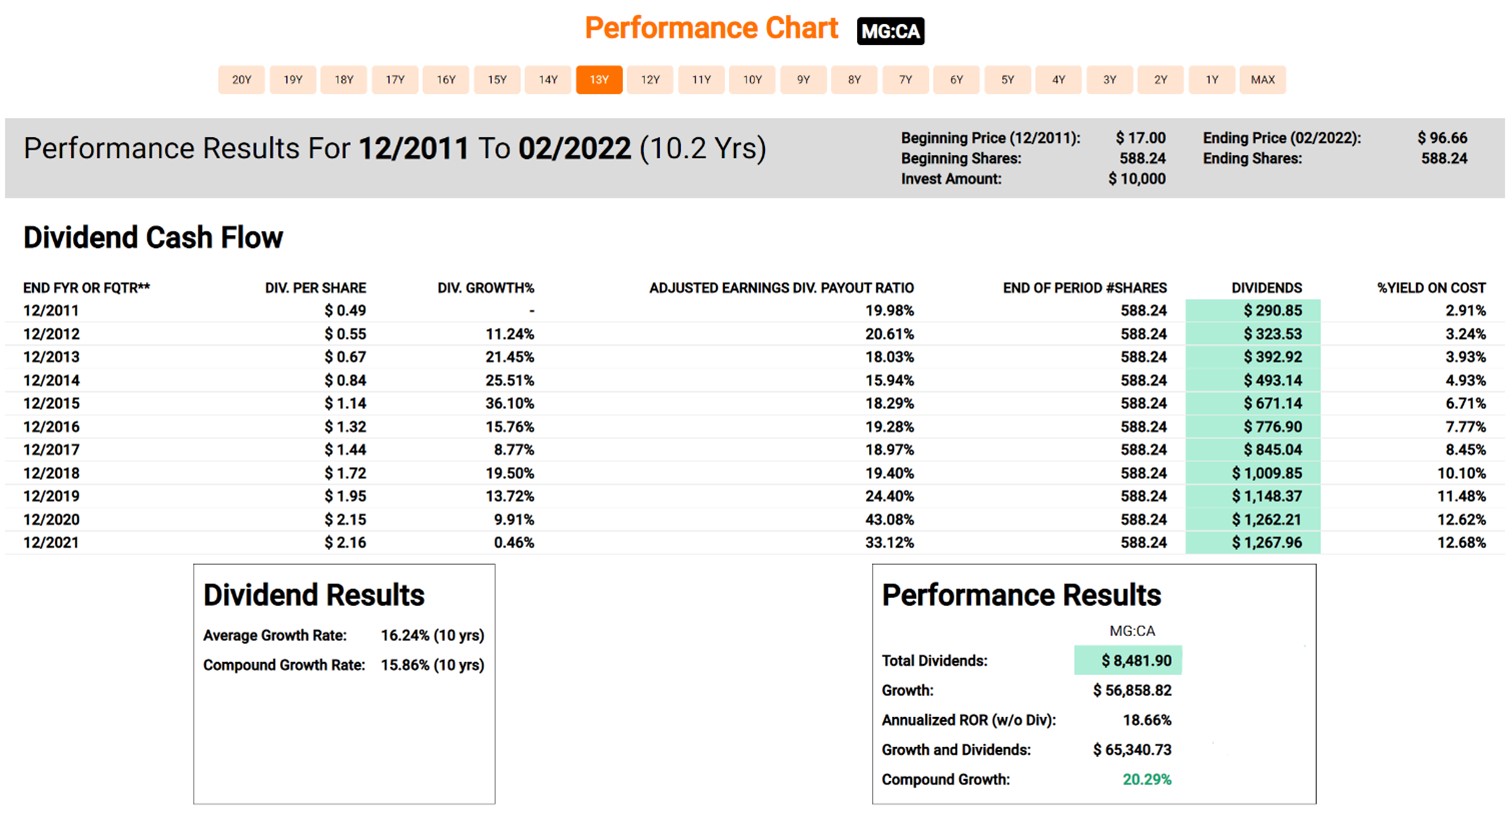
As dividend growth investors we have built-in inflation protection on our income. The dividend growth from stocks on ‘The List’ is already up 7.3% in 2022 and still growing.

Performance of ‘The List’

The best performers last week on ‘The List’ were TFI International (TFI-T) up 8.7%; Toromont Industries (TIH-T) up 6.5%; Franco Nevada (FNV-N) up 6.0%.

Magna International (MGA-N) was the worst performer this week, down -4.9%.

‘The List’ was down a bit this week with a positive 0.6% YTD price return (capital) and an average of 7.3% in dividend growth (income) added so far for fiscal 2022.

Dividend Increases

There were four companies on ‘The List’ that announced dividend increases this past week and one honorable mention from last year’s list.

Intact Financial (IFC-T) on Tuesday said it increased its 2022 quarterly dividend from $0.91 to $1.00 per share, payable March 31, 2022, to shareholders of record on Mar. 15, 2022.

This represents a dividend increase of 10%, marking the 17th straight year of dividend growth for this growing property and casualty insurance company. This was the second 10% increase in the last three months for IFC-T. IFC-T is another example of a financial company making up for the government-imposed restrictions on raising dividends in 2021.

Toromont Industries (TIH-T) on Wednesday said it increased its 2022 quarterly dividend from $0.35 to $0.39 per share, payable April 4, 2022, to shareholders of record on Mar. 9, 2022.

This represents a dividend increase of 11.4%, marking the 33rd straight year of dividend growth for this Canadian industrial company.

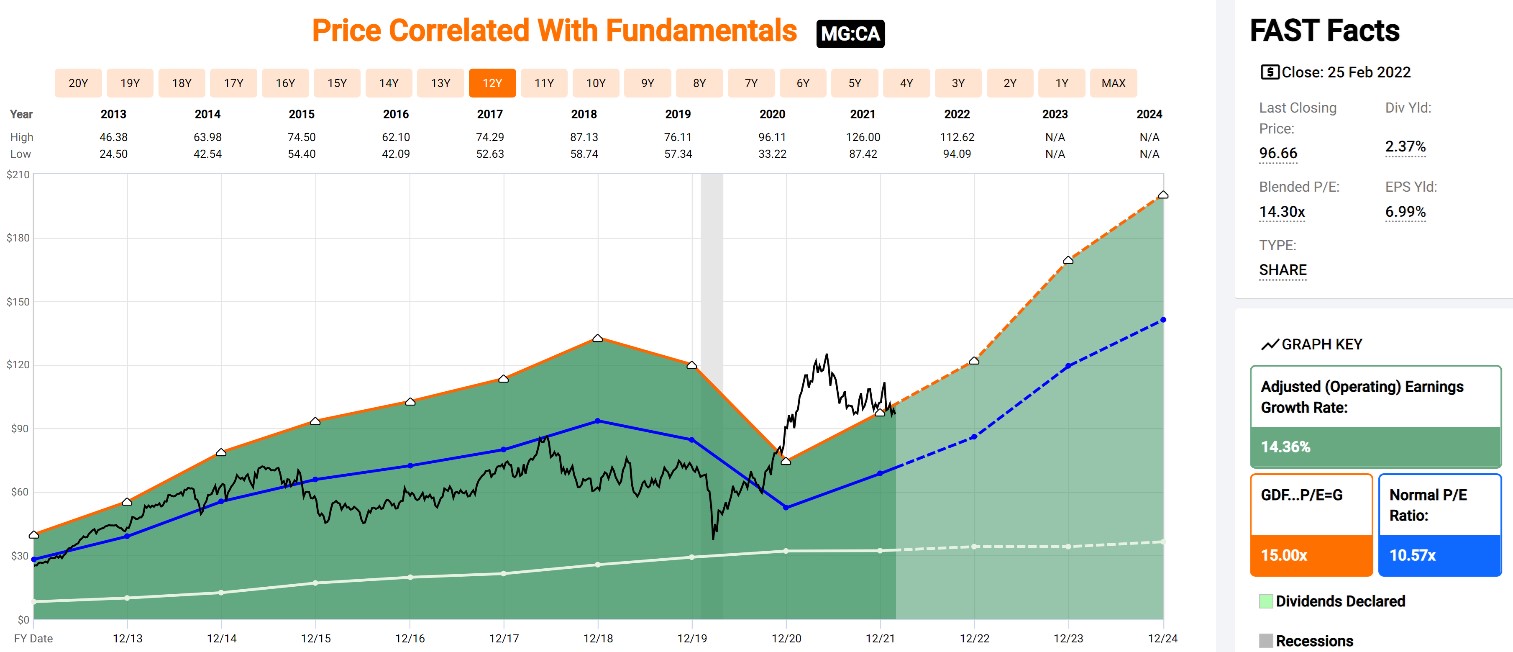
Magna International (MGA-N) on Friday said it increased its 2022 quarterly dividend from $0.43 to $0.45 per share, payable March 11, 2022, to shareholders of record on Feb. 24, 2022.

This represents a dividend increase of 4.7%, marking the 13th straight year of dividend growth for this Canadian auto parts company.

Enbridge (ENB-N) on Friday said it increased its 2022 quarterly dividend from $0.835 to $0.86 per share, payable March 1, 2022, to shareholders of record on Feb. 14, 2022.

This represents a dividend increase of 3%, marking the 27th straight year of dividend growth for this Canadian midstream energy company.

Equitable Group Inc. (EQB-T) on Friday said it increased its 2022 quarterly dividend from $0.185 to $0.28 per share, payable March 31, 2022, to shareholders of record on Mar. 14, 2022.

EQB-T was a good dividend grower from last year’s list but was removed because it did not raise its dividend in 2021 due to government-imposed restrictions. The company has more than made up for last year’s shortfall with this increase on top of a stellar Q4 earnings report. This represents a dividend increase of 51.4%, for this Canadian bank.

Earnings Releases

We had seven earnings reports from companies on ‘The List’ this past week. Let’s start with Intact Financial.

Intact Financial (IFC-T)

The company published these highlights:

  • Net operating income per share of $3.78 in Q4-2021 and $12.41 for the full year increased 19% and 25%, respectively, driven by robust underwriting and distribution income, and meaningful accretion from RSA
  • EPS growth of 51% in the quarter and 72% in 2021 reflected strong operating results and investment gains
  • Operating DPW1 grew 75% in the quarter and 45% in 2021, mainly due to RSA, with healthy organic growth in commercial lines
  • Operating combined ratio of 87.8% in Q4-2021 as strong underlying performance outweighed elevated catastrophe losses
  • OROE of 17.8% and ROE of 17.0%, with BVPS growth of 40% to $82.34
  • Quarterly dividend increased by 10% to $1.00 per common share and initiating share buyback program

Charles Brindamour, Chief Executive Officer, said that IFC-T had a milestone year in 2021 and we would have to agree. The stock was up 5% last week and over 25% in the last year.

TFI International (TFII-T) was one of the top performers on ‘The List’ in 2021 but its stock price had been under a lot of pressure starting out in 2022.

The company published these highlights in their Q4 earnings report:

  • Fourth quarter diluted EPS of $1.52 up from $0.91 in Q4 2020, while adjusted diluted EPS1 of $1.57 increased from $0.98
  • Fourth quarter operating income of $215.0 million increased from $117.1 million in Q4 2020
  • Fourth quarter net cash from operating activities of $190.3 million increased from $164.9 million in Q4 2020
  • Full-year diluted EPS of $6.97 up from $3.03 in 2020, while adjusted diluted EPS1 of $5.23 increased from $3.30

Alain Bédard, Chairman, President and Chief Executive Officer called the acquisition of UPS Ground Freight transformational and said that they enter 2022 stronger than ever,

The market must have liked what they read as TFII-T was back on top of ‘The List’ again with an 8.7% jump in it’s share price last week.

Toromont Industries Ltd. (TIH-T)

The company published these Q4 and full year 2021 highlights:

  • Revenues in the fourth quarter were $956.0 million, down 4% from the similar period last year. Equipment Group revenues were down 3% on changes in timing of deliveries, inclusive of delays as a result of supply chain disruptions. Revenues at CIMCO were 7% lower on timing of construction projects within the Canadian industrial segment and reduced recreational activity due to pandemic restrictions.
  • Revenues increased 12% to $3.9 billion for the year compared to 2020, on improved activity in end markets, reflective of the partial recovery from pandemic restrictions and shutdowns. Deliveries from healthy opening order backlogs(1) and on strong demand in the year generally, drove equipment and packages revenues 18% higher, while product support and rental revenues increased 5% and 8% respectively.
  • Operating income increased 17% in the fourth quarter reflecting higher gross margins on strong demand, improved rental fleet utilization, favourable sales mix, cost containment and operational efficiency.
  • Operating income increased 28% in 2021, reflecting the higher revenues and higher overall gross margins. Revenue growth exceeded growth in expenses, reflecting continued efforts to focus on cost management and improved efficiencies. Operating income margin increased 150 basis points (“bps”) to 12.2%, compared to 10.7% in 2020.
  • Net earnings for the fourth quarter were $105.6 million up 19% and basic EPS (earnings per share) was $1.28, also up 19% from the fourth quarter of 2020.
  • For the year, net earnings were $332.7 million, up 31% from 2020, with basic EPS up 30% to $4.03, reflective of the higher activity levels and positive operating leverage.

Included in the earnings report was this statement by management:

“Considering the Company’s strong financial position and long-term outlook, the Board of Directors today increased the quarterly dividend by 11.4% to 39 cents per share. Toromont has paid dividends every year since 1968 and this is the 33rd consecutive year of dividend increases.”

I always pay attention when I am reading earnings reports to hear what management is saying about their dividend policy. It seems management at TIH-T is confident that their impressive dividend growth streak will continue. A recent dividend increase is one of the strongest signals that management can send about their confidence in the business going forward.

Telus (T-T)

The company published these highlights:

  • Industry-leading fourth quarter total Mobile and Fixed customer growth of 272,000, our best fourth quarter on record and an increase of 19,000 over last year, driven by robust customer demand for our superior bundled offerings and leading customer loyalty results.
  • Total mobile net additions of 193,000, including 112,000 Mobile Phone net additions, an increase of 25,000 over the prior year, and 81,000 Connected Devices.
  • Robust wireline net additions of 79,000, our best fourth quarter wireline customer growth on record, including 40,000 Internet customer additions, powered by leading broadband customer experiences over our superior PureFibre network.
  • Consolidated Revenue, Net Income, and Adjusted EBITDA grew 20 per cent, 145 per cent, and 7.6 per cent, respectively, excluding the recognized gain on sale of financial solutions business, Revenue and Net Income up 10 per cent and 16 per cent, respectively.
  • Strong annual performance in line with guidance, driven by consistent operational execution, leading product offerings, and client service excellence, bolstered by continued strong operating momentum in TELUS International, TELUS Health and TELUS Agriculture.
  • Full year consolidated Operating Revenue, Net Income, and Adjusted EBITDA up 9.8 percent, 35 per cent, and 6.4 per cent, respectively, alongside record 960,000 net customer additions
  • Targeting 2022 Operating Revenue and Adjusted EBITDA to both increase by 8 to 10 per cent, and Free Cash Flow of $1.0 billion to $1.2 billion

Later in the earnings report I noticed this statement:

“..since 2004, we have returned $21 billion to shareholders, including $15.7 billion in dividends and $5.2 billion in share repurchases, representing over $15 per share. We look forward to updating our dividend growth program for the next three-year period commencing in 2023 at our upcoming AGM in May.”

We will learn in May what dividend growth will look like for the next three years. Knowing that dividends are part of the companies DNA gives us comfort as an investor.

Fortis Inc. (FTS-T)

The company published these highlights in their earnings report:

  • Reported annual net earnings of $1,231 million, or $2.61 per common share in 2021
  • Adjusted annual net earnings of $1,219 million, or $2.59 per common share
  • Deployed capital expenditures of $3.6 billion in 2021 with $600 million invested in cleaner energy infrastructure
  • Achieved 20% reduction in Scope 1 emissions through 2021, supporting 75% emissions reduction target by 2035

Fortis expects long-term growth in rate base will support earnings and dividend growth. Fortis is targeting average annual dividend growth of approximately 6% through 2025.

With a 3.5% yield and 6% dividend growth we can expect to earn an annual return close to 10% on this quality dividend grower over time. Provided we buy it at a sensible price.

Enbridge Inc. (ENB-T

The company published these highlights:

  • Full year GAAP earnings of $5.8 billion or $2.87 per common share, compared with GAAP earnings of $3.0 billion or $1.48 per common share in 2020
  • Adjusted earnings* of $5.6 billion or $2.74 per common share*, compared with $4.9 billion or $2.42 per common share* in 2020
  • Adjusted earnings before interest, income taxes and depreciation and amortization (EBITDA)* of $14.0 billion, compared with $13.3 billion in 2020
  • Cash provided by operating activities of $9.3 billion, compared with $9.8 billion in 2020
  • Distributable cash flow (DCF)* of $10.0 billion or $4.96 per common share*, compared with $9.4 billion or $4.67 per common share* in 2020
  • Reaffirmed 2022 full year guidance range for EBITDA of $15.0 billion to $15.6 billion and DCF per share of $5.20 to $5.50
  • Increased the 2022 quarterly dividend by 3% to $0.86 ($3.44 annually) per share reflecting the 27th consecutive annual increase
  • Placed approximately $10 billion of capital projects into service in 2021, which is expected to generate significant EBITDA growth in 2022
  • Advanced the current $10 billion secured growth program, which supports the Company’s 5 to 7% DCF per share growth through 2024
  • Successfully closed the previously announced US$3.0 billion acquisition of Moda Midstream Operating LLC including the Ingleside Energy Center
  • Announced US$0.4 billion Texas Eastern Phase II Modernization program to upgrade and electrify aging compressors increasing safety and reliability and lowering emissions
  • Announced US$0.1 billion Appalachia to Market Phase II system expansion, expanding natural gas supply into the U.S. Northeast to meet growing local demand
  • Executed pipeline transportation precedent agreement with Texas LNG Brownsville LLC for a US$0.4 billion expansion of the Valley Crossing Pipeline to supply its LNG export terminal
  • Entered into a Memorandum of Understanding with Lehigh Cement and announced Letters of Intent with local Indigenous Nations to develop the Open Access Wabamun Carbon Hub
  • Advanced ESG priorities by executing on emissions reduction pathways and increasing the diversity of Enbridge’s leadership and Board of Directors
  • Announced additional measures to further align the business with our net-zero emissions goals
  • Completed the previously announced $1.1 billion sale of Enbridge’s interest in Noverco Inc. (Noverco), providing for additional financial flexibility
  • Announced the approval by the Toronto Stock Exchange (TSX) of Enbridge’s normal course issuer bid (NCIB) of up to $1.5 billion
  • Issued $750 million of 60-year hybrid debt in the Canadian debt markets with proceeds to be used to redeem the $750 million Enbridge Inc. Preferred Shares – Series 17

ENB-T’s share price seems to be benefitting from higher energy prices in 2022. Dividend growth has slowed considerably so we continue to monitor this company closely.

Magna International (MGA-N)

Fourth Quarter 2021 Highlights:

  • Sales of $9.1 billion decreased 14%, compared to a 17% decrease in global light vehicle production
  • Diluted earnings per share and Adjusted diluted earnings per share of $1.54 and $1.30, respectively, compared to $2.45 and $2.83 last year
  • Returned $378 million to shareholders through share repurchases and dividends
  • Raised quarterly cash dividend by 5% to $0.45 per share

Full Year 2021 Highlights:

  • Sales of $36.2 billion increased 11%, compared to global vehicle production which increased 4%
  • Diluted earnings per share and Adjusted diluted earnings per share of $5.00 and $5.13, respectively, compared to $2.52 and $3.95 last year
  • Returned over $1 billion to shareholders through share repurchases and dividends

Although Magna beat estimates, year over year comparables were down for many categories. There isn’t a lot in this report to like about MGA-N in the short-term outside of the dividend increase. Things will probably get a little worse before they get better. Keep an eye out for a good buying opportunity in this quality dividend grower in 2022.

Recent News

Here are a few of the companies on ‘The List’ due to report earnings this week:

Emera Inc. (EMA-T) is scheduled to report earnings Monday Feb. 14

TC Energy (TRP-T) is scheduled to report earnings Tuesday Feb. 15

Waste Connections (WCN-T) is scheduled to report earnings after hours Wednesday Feb. 16

Canadian Tire (CTC-T) is scheduled to report earnings Thursday Feb. 17

Below is a snapshot of ‘The List’ from last Friday’s close. For a sortable version of ‘The List’ please click on The List menu item.

‘The List’ is not meant to be a template for investors to copy exactly. Rather, its purpose is to provide investment ideas and a real-time illustration of dividend growth investing in action. It is not a ‘Buy List’, only a starting point for our analysis and discussion.

The List (2022)
Last updated by BM on February 14, 2022

*Note: The following graph is wide, you can scroll to the right on your device to see more of the data.

SYMBOL COMPANY YLD PRICE YTD % DIV YTD % STREAK
AQN-N Algonquin Power & Utilities 4.9% $13.98 -2.6% $0.68 2.3% 11
ATD-T Alimentation Couche-Tard Inc. 0.8% $53.65 3.0% $0.44 18.1% 12
BCE-T Bell Canada 5.5% $66.66 1.1% $3.68 5.1% 13
BIP-N Brookfield Infrastructure Partners 3.5% $61.35 0.4% $2.16 5.9% 14
CCL-B-T CCL Industries 1.3% $64.00 -5.6% $0.84 0.0% 20
CNR-T Canadian National Railway 1.9% $155.21 0.2% $2.93 19.1% 26
CTC-A-T Canadian Tire 2.9% $182.13 -0.6% $5.20 10.6% 11
CU-T Canadian Utilities Limited 5.0% $35.24 -3.7% $1.76 0.0% 50
DOL-T Dollarama Inc. 0.3% $64.60 1.9% $0.20 1.7% 11
EMA-T Emera 4.5% $58.81 -6.0% $2.65 2.9% 15
ENB-T Enbridge Inc. 6.2% $55.56 12.2% $3.44 3.0% 26
ENGH-T Enghouse Systems Limited 1.5% $41.52 -9.5% $0.64 4.1% 15
FNV-N Franco Nevada 0.9% $142.03 4.4% $1.28 10.3% 14
FTS-T Fortis 3.6% $59.03 -2.4% $2.14 4.4% 48
IFC-T Intact Financial 2.2% $183.70 12.2% $4.00 17.6% 17
L-T Loblaws 1.4% $101.51 -1.2% $1.46 6.6% 10
MGA-N Magna 2.4% $75.71 -7.2% $1.80 4.7% 12
MRU-T Metro 1.6% $67.80 1.1% $1.10 10.0% 27
RY-T Royal Bank of Canada 3.3% $146.25 6.9% $4.80 11.1% 11
SJ-T Stella-Jones Inc. 1.7% $41.37 1.7% $0.72 0.0% 17
STN-T Stantec Inc. 1.0% $67.84 -3.3% $0.66 0.0% 10
TD-T TD Bank 3.3% $107.81 8.5% $3.56 12.7% 11
TFII-T TFI International 1.0% $136.46 -2.7% $1.36 17.4% 11
TIH-T Toromont Industries 1.3% $114.42 0.6% $1.52 15.2% 32
TRP-T TC Energy Corp. 5.2% $66.89 12.0% $3.48 1.8% 21
T-T Telus 4.1% $31.57 6.1% $1.31 4.4% 18
WCN-N Waste Connections 0.8% $120.64 -10.0% $0.92 8.9% 12
Averages 2.7% 0.6% 7.3% 18

MP Market Review – February 4, 2022

Posted by BM on February 7, 2022

“A dividend is a dictate of management. A capital gain is a whim of the market.”

We have already seen some of our top performing dividend growers of 2021 on ‘The List’ give back some of their capital gains from last year. This is normal, as the ‘excitement factor’ (P/E expansion) begins to retract as prices fall.

Always remember Jack Bogle’s expected return formula:

Future Market Returns = Dividend Yield + Earnings Growth +/- Change in P/E Ratio

Right now, we are seeing a negative change in P/E. Thankfully, dividend growth investors have dividend yield and earnings growth to fall back on during bear markets and we only purchase when the price is sensible, so we already have a built-in margin of safety. We use bear markets to buy more of our quality dividend growers on sale.

Performance of ‘The List’

The best performers last week on ‘The List’ were Alimentation Couche-Tard Inc. (ATD-T) up 7.3%; TD Bank (TD-T) up 5.4%; TFI International (TFII-T) up 4.5%.

Enghouse Systems Limited (ENGH-T) was the worst performer this week, down -1.9%.

‘The List’ was up this week 1.9% with a 0.0% YTD price return (capital) and an average of 6.4% in dividend increases (income) reported so far for fiscal 2022.

Dividend Increases

There were two companies on ‘The List’ that announced dividend increases this past week.

Brookfield Infrastructure Partners (BIP-N) on Wednesday said it increased its 2022 quarterly dividend from $0.51 to $0.54 per share, payable March 31, 2022, to shareholders of record on Feb. 28, 2022.

This represents a dividend increase of 5.9%, marking the 15th straight year of dividend growth for this global infrastructure company that owns and operates quality, long-life assets.

Bell Canada (BCE-T) on Tuesday said it increased its 2022 quarterly dividend from $0.875 to $0.92 per share, payable April 15, 2022, to shareholders of record on Mar. 15, 2022.

This represents a dividend increase of 5.1%, marking the 14th straight year of dividend growth for this quality Canadian telco.

Earnings Releases

There were two earnings releases announced from companies on ‘The List’ this past week.

Brookfield Infrastructure Partners Q4 FFO, Earnings Miss, Revenue Rise, Increases Dividend

07:44 AM EST, 02/02/2022 (MT Newswires) — Brookfield Infrastructure Partners (BIP) (BIP.TO) reported Q4 funds from operations of $0.97 per unit, up from $0.86 a year earlier.

Analysts polled by Capital IQ forecast $0.93.

Revenue for the December quarter was $3.25 billion, up from $2.53 billion a year earlier. A single analyst surveyed by Capital IQ forecast $1.94 billion.

“2021 was a remarkable year for Brookfield Infrastructure, highlighted by our strong organic growth, capital recycling accomplishments, and the deployment of significant capital into new investments and other growth initiatives,” said Sam Pollock, Chief Executive Officer of Brookfield Infrastructure. “We begin this year with a strong liquidity position and half of our 2022 deployment target already secured.”

BCE Reports Q4 Adjusted EPS Beat of $0.76, Announces 5.1% Dividend Hike, Guidance

MONTRÉAL, February 3, 2022 – BCE Inc. (TSX, NYSE: BCE) today reported results for the fourth quarter (Q4) and full-year 2021, provided financial guidance for 2022 and announced a 5.1%, or $0.18 per share, increase in the BCE annual common share dividend to $3.68.

“At Bell, we have been singularly focused on our purpose to advance how Canadians connect with each other and the world, and our strong execution and operational discipline to deliver on this purpose is paying off. Bell’s solid performance in Q4 and throughout 2021 reflect the steady demand for fast, reliable and innovative services to keep residents and businesses connected, informed and productive with net new mobile phone and mobile connected device, retail Internet and IPTV subscriber additions of 225,533 in Q4, and our best annual retail residential net subscriber performance in 10 years,” said Mirko Bibic, President and CEO of BCE Inc. and Bell Canada.

“A key part of our strategy has been to champion the customer experience. I’m proud of the gains we made this past year, leading the industry in reducing customer complaints, and enhancing our digital tools and self-serve apps so that our customers have a choice in how they interact with us. It’s clear that our historic network capital expenditure acceleration program to connect more Canadians faster and continue delivering on our purpose is the right path forward as Canada builds back from the impacts of COVID-19. We surpassed our 2021 network expansion targets reaching 1 million households with Wireless Home Internet one year ahead of schedule. We expanded our direct fibre footprint to communities across the country, and our 5G network now covers over 70% of the Canadian population.

As we look ahead to 2022, we plan to reach up to 900,000 more homes and businesses with direct fibre connections and expand the reach of our 5G network to meet our growing customer needs. And in every interaction, we will continue to build on the gains we made in making it easier for our customers to do business with us and keep them at the centre of everything we do.”

Guidance:

The table below provides our 2022 financial guidance targets. These ranges are based on our current outlook for 2022 taking into account the impact of COVID-19 on our 2021 consolidated financial results.

2021 Results 2022 Guidance
Revenue Growth 2.5% 1% - 5%
Adjusted EBITDA growth 3.0% 2% - 5%
Capital intensity 20.6% 21%
Adjusted EPS growth 5.6% 2% - 7%
Free cash flow growth (10.5%) 2% - 10%
Annualized common dividend per share $3.50 $3.68

For the full-year 2022, we expect growth in adjusted EBITDA, a reduction in contributions to post-employment benefit plans and payments under other post-employment benefit plans, and lower cash income taxes, will drive higher free cash flow.

Recent News

A busy week coming up for companies on ‘The List’. Earnings reports give us a look ‘under the hood’ of our quality dividend growers and provide us with lots of tidbits of information to help in our purchase decisions. Paying attention to the fine print helps us understand the business better and how they will continue to grow earnings post COVID. Of the companies due to report this week, many have already announced dividend increases for 2022 or will be doing so in Q3 (historically). Any increase would be a welcome surprise.

Here are a few of the companies on ‘The List’ due to report earnings this week:

TFI International (TFII-T) is scheduled to report earnings after hours Monday Feb. 07

Intact Financial Corporation (IFC-T) is scheduled to report earnings Wednesday Feb. 09

Toromont Industries Ltd. (TIH-T) is scheduled to report earnings after hours Wednesday Feb. 09

Telus (T-T) is scheduled to report earnings Thursday Feb. 10

Fortis Inc. (FTS-T) is scheduled to report earnings Friday Feb. 11

Enbridge Inc. (ENB-T) is scheduled to report earnings Friday Feb. 11

Below is a snapshot of ‘The List’ from last Friday’s close. For a sortable version of ‘The List’ please click on The List menu item.

‘The List’ is not meant to be a template for investors to copy exactly. Rather, its purpose is to provide investment ideas and a real-time illustration of dividend growth investing in action. It is not a ‘Buy List’, only a starting point for our analysis and discussion.

The List (2022)
Last updated by BM on February 7, 2022

*Note: The following graph is wide, you can scroll to the right on your device to see more of the data.

SYMBOL COMPANY YLD PRICE YTD % DIV YTD % STREAK
AQN-N Algonquin Power & Utilities 4.9% $14.04 -2.2% $0.68 2.3% 11
ATD-T Alimentation Couche-Tard Inc. 0.8% $53.38 2.5% $0.44 18.1% 12
BCE-T Bell Canada 5.4% $67.93 3.1% $3.68 5.1% 13
BIP-N Brookfield Infrastructure Partners 3.6% $60.17 -1.5% $2.16 5.9% 14
CCL-B-T CCL Industries 1.3% $64.50 -4.9% $0.84 0.0% 20
CNR-T Canadian National Railway 1.9% $156.04 0.7% $2.93 19.1% 26
CTC-A-T Canadian Tire 2.8% $185.30 1.2% $5.20 10.6% 11
CU-T Canadian Utilities Limited 4.9% $35.86 -2.0% $1.76 0.0% 50
DOL-T Dollarama Inc. 0.3% $66.90 5.5% $0.20 1.7% 11
EMA-T Emera 4.4% $59.78 -4.5% $2.65 2.9% 15
ENB-T Enbridge Inc. 6.3% $54.72 10.5% $3.44 3.0% 26
ENGH-T Enghouse Systems Limited 1.5% $42.20 -8.0% $0.64 4.1% 15
FNV-N Franco Nevada 1.0% $133.97 -1.6% $1.28 10.3% 14
FTS-T Fortis 3.6% $59.75 -1.2% $2.14 4.4% 48
IFC-T Intact Financial 2.1% $175.13 7.0% $3.64 7.1% 17
L-T Loblaws 1.4% $101.30 -1.4% $1.46 6.6% 10
MGA-N Magna 2.2% $79.58 -2.5% $1.72 0.0% 12
MRU-T Metro 1.6% $68.03 1.5% $1.10 10.0% 27
RY-T Royal Bank of Canada 3.3% $146.87 7.3% $4.80 11.1% 11
SJ-T Stella-Jones Inc. 1.8% $40.71 0.1% $0.72 0.0% 17
STN-T Stantec Inc. 1.0% $67.13 -4.4% $0.66 0.0% 10
TD-T TD Bank 3.4% $105.62 6.3% $3.56 12.7% 11
TFII-T TFI International 1.1% $125.49 -10.5% $1.36 17.4% 11
TIH-T Toromont Industries 1.3% $107.43 -5.5% $1.40 6.1% 32
TRP-T TC Energy Corp. 5.4% $64.53 8.0% $3.48 1.8% 21
T-T Telus 4.2% $30.82 3.6% $1.31 4.4% 18
WCN-N Waste Connections 0.7% $123.02 -8.2% $0.92 8.9% 12
Averages 2.7% 0.0% 6.4% 18

We buy quality individual dividend growth stocks when they are sensibly priced and hold for the growing income.