“You have a pair of pants. In the left pocket, you have $100. You take $1 out of the left pocket and put in the right pocket. You now have $101. There is no diminution of dollars in your left pocket. That is one magic pair of pants.”

Wealth-Builder Model Portfolio (CDN) – Quarterly Review – As of October 31, 2023

Last updated by BM on November 30, 2023

“I measure our progress primarily on the basis of the income we are collecting and the growth of that income through dividend increases.”

– Josh Peters, Former Editor of Morningstar DividendInvestor Newsletter and Author of ‘The Ultimate Dividend Playbook’.

Summary


  • During the last fiscal quarter, the Magic Pants Wealth-Builder Model Portfolio (CDN) made only one purchase to an existing position. The portfolio remains invested in thirteen dividend growth companies across seven sectors of the Canadian economy.
  • With an initial capital investment of $59,944, the portfolio’s annualized income has grown to $2,381 at the end of this quarter. A 10.6% increase over the previous quarter.
  • The main goal of the portfolio is to generate growing dividends from quality Canadian companies with a track record of dividend growth.
  • The secondary goal is to build a portfolio that generates above-average total returns over the long term (5-10 years).

Background


“You have a pair of pants. In the left pocket, you have a $100. You take $1 out of the left pocket and put in the right pocket. You now have a $101. There is no diminution of dollars in your left pocket. That is one magic pair of pants.”

This ‘magic pants’ analogy was from an article on dividend investing I read about a decade ago on Seeking Alpha and was one of the catalysts for me to take a closer look at this type of investing and see if it truly was magical.

The Magic Pants Wealth-Builder Model Portfolio (CDN) is our attempt to prove that dividend growth investing is one of the simplest and safest ways to build wealth. We believe that by following our process, an everyday investor can learn to build powerful dividend growth portfolios and eventually find that elusive pair of magic pants.

Goals and Objectives


Dividend growth investing is a long-term investment strategy that involves selecting quality stocks with a history of consistently increasing dividends and holding them for the long term. The goal of this strategy is to generate a steadily increasing stream of income through the reinvestment of dividends, as well as potentially realizing capital gains as the stock price appreciates over time. This can be an appealing strategy for investors looking for a reliable source of income, as well as for those seeking to grow their wealth over time.

The Magic Pants Wealth-Builder Model Portfolio (CDN) is a public, real-money, real-time portfolio demonstrating the principles and practices of dividend growth investing. The portfolio was launched on May 1, 2022, and has been managed in real-time since. Its primary goal is to generate a steadily increasing stream of dividends paid by quality Canadian companies. All the decisions to buy, hold, and sell securities are real decisions about handling money. The portfolio is intended to serve as a blueprint for constructing a dividend growth portfolio, and as a living example of how dividend growth investing works. It can be useful for illustrating goal setting, planning, stock selection, portfolio management, and other aspects of investing for those with similar goals.

With an initial capital injection of $100,000, dividend reinvestment and annual contributions of $12,000, the 10-year target is to achieve ~ $11,400 annual income by the tenth-anniversary date. The MP Wealth-Builder Model Portfolio (CDN) – Business Plan can be found here.

Quarterly Portfolio Review


One of our practices is to give the Magic Pants Wealth-Builder Model Portfolio (CDN) a checkup four times yearly, at the end of July, October, January and April. The basic questions are: How is the portfolio doing? Is it tracking towards its goal? How is each position doing? Should changes be made to keep the enterprise on track? We follow a formal process for portfolio reviews plus additional discussion.

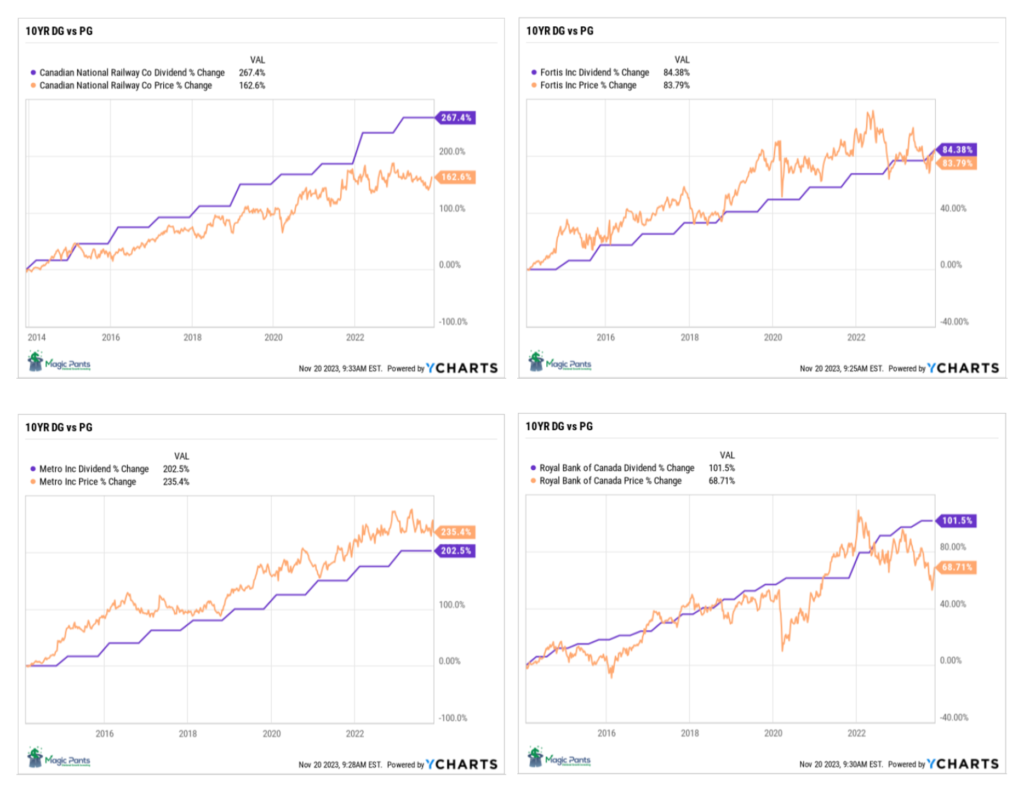
To provide accountability, transparency and trust in our process, we ‘timestamp’ all our trades. We also like viewing our trades in this manner because it is easy to quickly see how we are doing and the effects a growing dividend has on price.

Every DGI Alert we’ve issued since we started our portfolio has been timestamped. We don’t hide our history. When we’re wrong, it’s right there for all to see – every win, loss, and tie.

Transactions This Quarter


“Your money is like a bar of soap – the more you handle it, the less you’ll have.”

There was one purchase this quarter.

We will provide DGI alerts (timestamped) each time we buy/sell stock in our portfolio and then write an article on why.

Articles detailing the investment thesis behind our purchases can be found in the ‘Subscriber Only’ category section of our site on the right side of our home page. Here are the links:

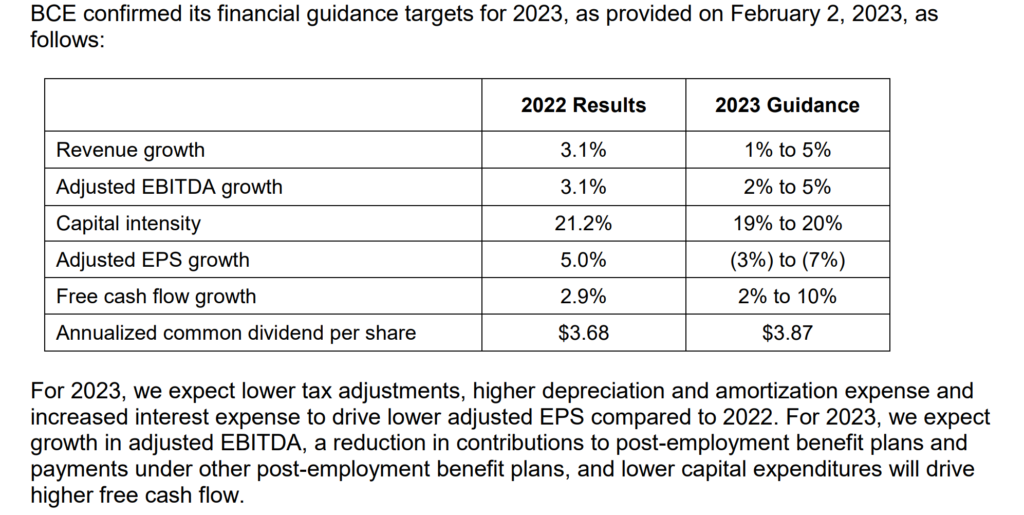
We Just Bought More Bell Canada (BCE-T) for our MP Wealth-Builder Model Portfolio (CDN)

Dividend Increases Announced This Quarter


Three companies in the portfolio announced dividend increases this quarter:

Waste Connections (WCN-N) .255 to .285 up 11.8% payable on November 28, 2023

Fortis Inc. (FTS-T) .565 to .59 up 4.42% payable on December 01, 2023

TFI International (TFII-N) .35 to .40 up 14.28% payable on January 13, 2024

Income Paid This Quarter


“The market may move irrationally while dividends remain much more stable, reliable and predictable.”

We earned $554.52 in dividend income last quarter, up 11.5% from the previous quarter. This amount gets deposited directly into our brokerage account, where we can reinvest it in quality individual dividend growth companies that are sensibly priced.

Note: When the currency of the dividend and share price match, the calculation is straightforward. But it’s not so simple when the dividend is declared in one currency, and the share price is quoted in another. Dividing the former by the latter would produce a meaningless result because it’s a case of apples and oranges. To calculate the yield properly, you must express the dividend and share price in the same currency. Franco Nevada is one such company. We bought it in CDN dollars, and it pays a USD dividend. The dividend amount above has been converted to CDN dollars.

Returns

Return Calculation:

We reviewed several different calculations to come up with a fair representation of total return. The ‘gold standard’ in the investment industry is time-weighted results which we calculate monthly. We use the ‘Modified Dietz Return’ formula to calculate our portfolio returns.

The ‘Modified Dietz Return’ calculates the monthly rate of return of an investment portfolio which includes the cashflows in and out of the portfolio. The method accounts for the timing of when the cash flows come in and out of the portfolio to properly weigh the impact of these cash flows on the portfolio’s return.

At present we do not incorporate the returns of our uninvested cash positions as part of our portfolio returns only contributions and withdrawals to the portfolio and of course our dividends.

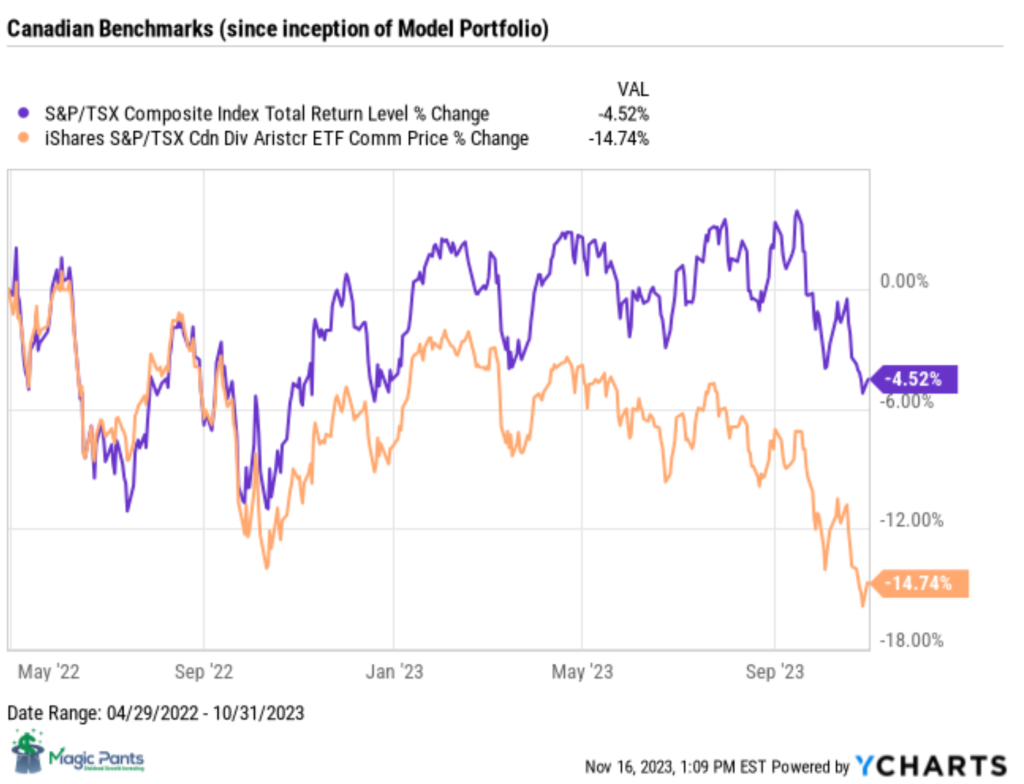
Here are the benchmarks we track our capital returns against.

Our Portfolio


To date, we have invested $59,944 of our initial capital as per our business plan. That leaves us with remaining uninvested capital for this fiscal year of $22,056 ($82,000-$59,944) plus dividends collected.

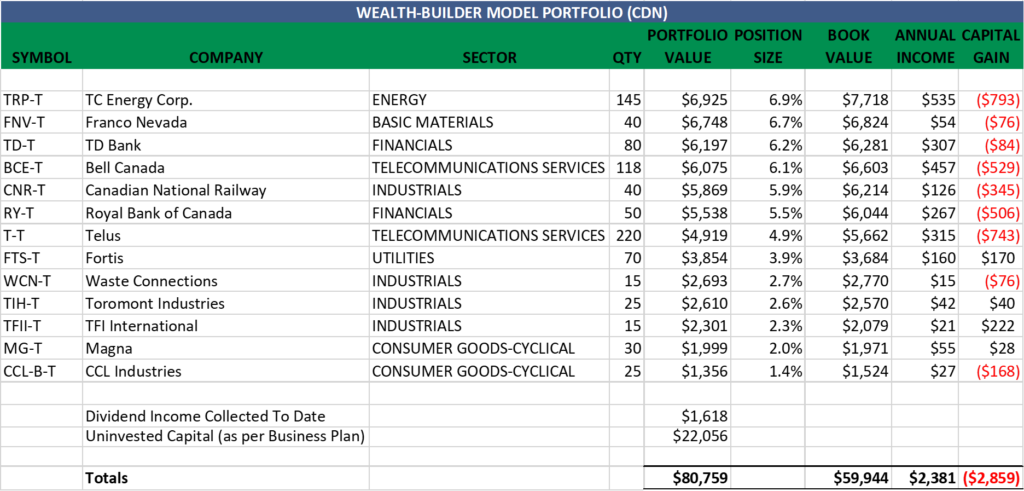
Since inception, our income has grown to an annualized amount of +$2,381 and our capital has an unrealized capital loss of -$2,859 as of October 31, 2023.

Wrap Up


When facing a tough quarter with negative short-term capital returns, it’s easy to lose sight of our goals. Luckily, our objectives are well-documented, and our proven process has stood the test of time for decades.

Goals:

  1. Our primary aim is to generate increasing dividends from top-notch Canadian companies known for their consistent dividend growth.
  2. Our secondary goal is to construct a portfolio that delivers higher-than-average total returns over the long term (5-10 years).

Regarding our first goal, we’re surpassing expectations. Our dividend income has risen by 11.5% compared to the previous quarter and 10.6% on an annualized basis.

Downward trending markets allowed us to invest at a higher starting yield than projected in our business plan. With six months to go until the end of our second fiscal year we have already reached 84% of our target income with only 72% of our capital invested as per the business plan. This allows us a lot of flexibility to balance out our portfolio with a few low-yield, high-growth stocks.

Achieving our secondary goal takes a bit more time. As long as our income keeps growing, our capital will soon follow suit. By maintaining patience and discipline in our approach, we’re confident that we’ll reap the rewards.

BM

P.S. Enjoy your growing income and don’t forget to ‘Front Load The Fun’!

Please don’t hesitate to reach out to me anytime with your comments or questions to info@magicpants.ca .

MP Market Review – November 24, 2023

Last updated by BM on November 27, 2023

Summary 

  • This is a weekly installment of our MP Market Review series, which provides updates on the financial markets and Canadian dividend growth companies we monitor on ‘The List’.
  • Last week, ‘The List’ was down slightly with a YTD price return of +2.5% (capital). Dividends have increased by +8.8% YTD, highlighting the growth in the dividend (income).
  • Last week, no dividend announcements from companies on ‘The List’.
  • Last week, no earnings reports from companies on ‘The List’.
  • Three companies on ‘The List’ are due to report earnings this week.      

The List (2023)

The Magic Pants List includes 27 Canadian dividend growth stocks.  Each have raised their dividend annually for the last ten years (or longer) and have a market cap of over a billion dollars. Based on these criteria, companies on ‘The List’ are added or removed annually, on January 1. Prices and dividends are updated weekly.

While ‘The List’ does not function as a portfolio on its own, it serves as an excellent initial reference for individuals looking to diversify their investments and achieve higher returns in the Canadian stock market. Through our newsletter, readers gain a deeper understanding of how to implement and benefit from our Canadian dividend growth investing strategy.

If you’re interested in creating your own dividend growth income portfolio, consider subscribing to our premium service. Subscribers gain access to buy/sell alerts and exclusive content available only to subscribers.

Performance of ‘The List’

Last week, ‘The List’ was down slightly with a YTD price return of +2.5% (capital). Dividends have increased by +8.8% YTD, highlighting the growth in the dividend (income).

The best performers last week on ‘The List’ were TFI International (TFII-N), up +3.76%; Enghouse Systems Limited (ENGH-T), up +2.53%; and Intact Financial (IFC-T), up +1.48%.

Canadian Tire (CTC-A-T) was the worst performer last week, down -5.86%.

SYMBOL COMPANY YLD PRICE YTD % DIV YTD % STREAK
AQN-N Algonquin Power & Utilities 8.4% $6.03 -10.4% $0.51 -29.0% 12
ATD-T Alimentation Couche-Tard Inc. 0.7% $79.20 31.7% $0.56 19.1% 13
BCE-T Bell Canada 7.2% $53.76 -10.7% $3.87 5.2% 14
BIP-N Brookfield Infrastructure Partners 4.4% $27.19 -13.2% $1.44 6.3% 15
CCL-B-T CCL Industries 1.8% $57.80 -0.4% $1.06 10.4% 21
CNR-T Canadian National Railway 2.0% $157.24 -3.5% $3.16 7.8% 27
CTC-A-T Canadian Tire 4.9% $139.60 -4.8% $6.90 17.9% 12
CU-T Canadian Utilities Limited 5.8% $30.72 -16.8% $1.79 1.0% 51
DOL-T Dollarama Inc. 0.3% $98.25 23.0% $0.27 23.8% 12
EMA-T Emera 5.8% $48.20 -8.4% $2.82 5.0% 16
ENB-T Enbridge Inc. 7.6% $46.57 -12.7% $3.55 3.2% 27
ENGH-T Enghouse Systems Limited 2.5% $34.44 -3.6% $0.85 18.2% 16
FNV-N Franco Nevada 1.2% $117.56 -14.9% $1.36 6.3% 15
FTS-T Fortis Inc. 4.1% $55.73 0.7% $2.29 5.3% 49
IFC-T Intact Financial 2.1% $212.14 8.4% $4.40 10.0% 18
L-T Loblaws 1.4% $121.67 1.1% $1.74 13.2% 11
MGA-N Magna 3.4% $54.75 -4.8% $1.84 2.2% 13
MRU-T Metro 1.7% $69.74 -7.6% $1.21 10.0% 28
RY-T Royal Bank of Canada 4.5% $118.96 -7.1% $5.34 7.7% 12
SJ-T Stella-Jones Inc. 1.2% $79.46 60.3% $0.92 15.0% 18
STN-T Stantec Inc. 0.8% $95.55 46.3% $0.77 8.5% 11
TD-T TD Bank 4.6% $83.35 -4.9% $3.84 7.9% 12
TFII-N TFI International 1.2% $117.39 17.2% $1.40 29.6% 12
TIH-T Toromont Industries 1.5% $112.93 15.6% $1.68 10.5% 33
TRP-T TC Energy Corp. 7.3% $50.60 -5.1% $3.69 3.4% 22
T-T Telus Corp. 5.9% $24.06 -8.6% $1.43 7.4% 19
WCN-N Waste Connections 0.8% $133.31 1.2% $1.05 10.5% 13
Averages 3.4% 2.5% 8.8% 19

Six Canadian stocks on ‘The List’ declare earnings and dividends in US dollars and are inter-listed on a US exchange in US dollars. The simplest way to display dividend and price metrics for these stocks is to show their US exchange symbols along with their US dividends and price. The stocks I am referring to have a -N at the end of their symbols. You can still buy their Canadian counterparts (-T), but your dividends will be converted into CDN dollars and will fluctuate based on the exchange rate.

DGI Clipboard

“Time in the market is more important than timing the market.”

Market Timing

Source: FMRco, January 2019

We likely all know someone who entered an investment right before it surged and exited just before a decline. However, finding individuals claiming consistent success in this practice is exceptionally challenging, if not impossible.

As the image above depicts, attempting to time the market is statistically unfavorable. On the contrary, an investor employing a buy-and-hold strategy, even with the most unfortunate timing in history, would still surpass the average investor by a substantial margin.

Consider a hypothetical investor who invested $50,000 in the S&P 500 at the market peak just before each of the four worst bear markets in the last 50 years:

Investment 1: $50,000 in December 1972 (before a 48% crash)

Investment 2: $50,000 in August 1987 (before a 34% crash)

Investment 3: $50,000 in December 1999 (before a 49% crash)

Investment 4: $50,000 in October 2007 (before a 52% crash)

Despite the dismal timing of these purchases, the investor refrained from panic selling and automatically reinvested dividends. By May 2019, their initial $200,000 investment had grown to $3,894,503. A commendable nest egg, considering the unfavorable timing of the investments.

Source: https://www.moneycrashers.com/reasons-shouldnt-time-market/

We tend to get similar results with our dividend growth investing strategy. Below is a chart we do each year with the companies on ‘The List’ to help us stay disciplined when it comes to market timing. Regardless of valuation or current market trends, purchasing an equal amount of every company on ‘The List’ on January 1, 2013, would have produced annualized returns of 12.4%.

10YR_CAGR-The List-01-01-2023

If you have not yet joined as a paid subscriber of the blog to receive DGI Alerts on the activity and content related to our model portfolio, it’s not too late. Click Here. 

Recent News 

Cobre Panama Additional Operations Update and Revised Franco Nevada Guidance

https://s201.q4cdn.com/345177888/files/doc_news/2023/Nov/20/cobre-panama-operations-update-vf-2023-11-20.pdf

We continue to monitor the developments in a story that is impacting one of the companies on ‘The List.’

Franco-Nevada (FNV-N) holds a substantial royalty stream with First Quantum, the owner of the Cobre Panama mine. The recent uncertainty surrounding the constitutionality of the agreement between First Quantum and the government of Panama has exerted downward pressure on Franco-Nevada’s stock price.

In response to this, the company (FNV-T) has deemed the challenge to Law 406 significant enough to warrant a reissuing of guidance for this fiscal year. Currently, the Cobre Panama royalty stream constitutes approximately 21% of Franco-Nevada’s revenue. The stock is likely to face further declines if a swift resolution is not reached. Presently, the Supreme Court of Panama is in session, working towards resolving the issue.

On a positive note, Franco-Nevada and First Quantum have a crucial factor working in their favor. Cobre Panama, with its 4,000 employees, contributes around 5% to the national GDP. This economic impact may play a role in the resolution of the dispute. However, the stock’s fate hinges on the outcome of the Supreme Court deliberations.

BREAKING NEWS: Panama’s top court rules First Quantum’s mining contract is unconstitutional

https://www.theglobeandmail.com/business/article-panamas-top-court-rules-first-quantums-mining-contract-is/

Dividend Increases

“The growth of dividend paying ability is of significance in the determination of a stock’s quality, or general safety…”

– Arnold Bernhard (the founder of Value Line)

No companies on ‘The List’ announced a dividend increase last week.


Earnings Releases

Benjamin Graham once remarked that earnings are the principal factor driving stock prices.

Each quarter, we will provide readers with weekly earnings updates of stocks on ‘The List’ during the calendar earnings season. 

The updated earnings calendar can be found here.

Three earnings reports from companies on ‘The List’ this week

Alimentation Couche-Tard Inc. (ATD-T) will release its second-quarter fiscal 2024 results on Tuesday, November 28, 2023, after markets close.

Royal Bank of Canada (RY-T) will release its fourth-quarter and fiscal 2023 results on Thursday, November 30, 2023, before markets open.

TD Bank (TD-T) will release its fourth-quarter and fiscal 2023 results on Thursday, November 30, 2023, before markets open.

Last week, no earnings reports from companies on ‘The List’.


MP Market Review – November 17, 2023

Last updated by BM on November 20, 2023

Summary 

  • This is a weekly installment of our MP Market Review series, which provides updates on the financial markets and Canadian dividend growth companies we monitor on ‘The List’.
  • Last week, ‘The List’ was up with a YTD price return of +3.2% (capital). Dividends have increased by +8.8% YTD, highlighting the growth in the dividend (income).
  • Last week, no dividend announcements from companies on ‘The List’.
  • Last week, two earnings reports from companies on ‘The List’.
  • No companies on ‘The List’ are due to report earnings this week.      

The List (2023)

Last updated by BM on November 17, 2023

The Magic Pants List contains 27 Canadian dividend growth stocks. ‘The List’ contains Canadian companies that have raised their dividend yearly for at least the last ten years and have a market cap of over a billion dollars. Below is each stock’s symbol, name, current yield, current price, price return year-to-date, current dividend, dividend growth year-to-date and current dividend growth streak. Companies on ‘The List’ are added or subtracted once a year, on January 1. After that, ‘The List’ is set for the next twelve months. Prices and dividends are updated weekly.

While ‘The List’ does not function as a portfolio on its own, it serves as an excellent initial reference for individuals looking to diversify their investments and achieve higher returns in the Canadian stock market. Through our blog, we provide weekly updates on ‘The List’ and offer valuable perspectives along with real-life examples of our dividend growth investing (DGI) strategy in action. This aids readers in gaining a deeper understanding of how to implement and benefit from this investment approach.

If you’re interested in creating your own dividend growth income portfolio, consider subscribing to our premium service. Subscribers gain access to buy/sell alerts for our MP Wealth-Builder Model Portfolio (CDN) and exclusive content available only to subscribers.

Performance of ‘The List’

Last week, ‘The List’ was up with a YTD price return of +3.2% (capital). Dividends have increased by +8.8% YTD, highlighting the growth in the dividend (income).

The best performers last week on ‘The List’ were CCL Industries (CCL-B-T), up +8.01%; Brookfield Infrastructure Partners (BIP-N), up +7.17%; and Magna (MGA-N), up +6.48%.

Metro (MRU-T) was the worst performer last week, down -5.86%.

SYMBOL COMPANY YLD PRICE YTD % DIV YTD % STREAK
AQN-N Algonquin Power & Utilities 8.5% $5.97 -11.3% $0.51 -29.0% 12
ATD-T Alimentation Couche-Tard Inc. 0.7% $78.24 30.1% $0.56 19.1% 13
BCE-T Bell Canada 7.1% $54.19 -10.0% $3.87 5.2% 14
BIP-N Brookfield Infrastructure Partners 4.4% $27.36 -12.6% $1.44 6.3% 15
CCL-B-T CCL Industries 1.8% $58.28 0.4% $1.06 10.4% 21
CNR-T Canadian National Railway 2.0% $158.14 -2.9% $3.16 7.8% 27
CTC-A-T Canadian Tire 4.7% $147.82 0.8% $6.90 17.9% 12
CU-T Canadian Utilities Limited 5.7% $31.28 -15.3% $1.79 1.0% 51
DOL-T Dollarama Inc. 0.3% $98.57 23.4% $0.27 23.8% 12
EMA-T Emera 5.7% $49.09 -6.7% $2.82 5.0% 16
ENB-T Enbridge Inc. 7.7% $46.22 -13.3% $3.55 3.2% 27
ENGH-T Enghouse Systems Limited 2.5% $33.59 -5.9% $0.85 18.2% 16
FNV-N Franco Nevada 1.1% $120.42 -12.8% $1.36 6.3% 15
FTS-T Fortis Inc. 4.0% $56.46 2.0% $2.29 5.3% 49
IFC-T Intact Financial 2.1% $209.04 6.8% $4.40 10.0% 18
L-T Loblaws 1.4% $121.76 1.2% $1.74 13.2% 11
MGA-N Magna 3.3% $56.03 -2.6% $1.84 2.2% 13
MRU-T Metro 1.7% $70.16 -7.0% $1.21 10.0% 28
RY-T Royal Bank of Canada 4.4% $120.49 -5.9% $5.34 7.7% 12
SJ-T Stella-Jones Inc. 1.1% $81.82 65.0% $0.92 15.0% 18
STN-T Stantec Inc. 0.8% $96.44 47.6% $0.77 8.5% 11
TD-T TD Bank 4.5% $84.78 -3.3% $3.84 7.9% 12
TFII-N TFI International 1.2% $113.14 13.0% $1.40 29.6% 12
TIH-T Toromont Industries 1.5% $113.73 16.4% $1.68 10.5% 33
TRP-T TC Energy Corp. 7.3% $50.34 -5.6% $3.69 3.4% 22
T-T Telus Corp. 5.9% $24.22 -8.0% $1.43 7.4% 19
WCN-N Waste Connections 0.8% $134.84 2.4% $1.05 10.5% 13
Averages 3.4% 3.2% 8.8% 19

Six Canadian stocks on ‘The List’ declare earnings and dividends in US dollars and are inter-listed on a US exchange in US dollars. The simplest way to display dividend and price metrics for these stocks is to show their US exchange symbols along with their US dividends and price. The stocks I am referring to have a -N at the end of their symbols. You can still buy their Canadian counterparts (-T), but your dividends will be converted into CDN dollars and will fluctuate based on the exchange rate.

Note: When the dividend and share price currency match, the calculation is straightforward. But it’s not so simple when the dividend is declared in one currency, and the share price is quoted in another. Dividing the former by the latter would produce a meaningless result because it’s a case of apples and oranges. To calculate the yield properly, you must express the dividend and share price in the same currency.

DGI Clipboard

“Compare the compound annual growth rate (CAGR) of a firm’s dividend with its price after a few years. They should be similar: if not, do not buy, or if you own it, winnow it.”

– Tom Connolly (the founder of dividendgrowth.ca)

Dividend Growth and Price Growth Alignment

Many of our good dividend growers on ‘The List’ follow this pattern.

Similar to real estate investing, stocks that generate long-term income for their owners tend to become more valuable. The primary source of income for stock investors is often through dividend payments. Beyond short-term market cycles, the value of dividend growth investing (DGI) stocks is closely tied to the income they generate for their owners.

As dividends increase, so does the stock price. Don’t be overly concerned about price volatility if the dividend is growing. Hold onto the investment for the increasing income and the potential for future price gains. Recognize that the capital is growing in tandem with income, eventually.

This is where portfolio control comes into play. Many investors view the stock market as an enigmatic force, feeling subject to the whims of market returns. However, by linking the value of your stocks to the income they produce and focusing on building that income, you’re likely to witness price appreciation as well.

Building a portfolio consisting of stocks that have historically followed this pattern—consistently growing their dividends at a predetermined rate—enables dividend growth investors to predict future returns more reliably.

As a bonus, a growing yield not only provides added income but also enhances the security of our underlying investment.

If you have not yet joined as a paid subscriber of the blog to receive DGI Alerts on the activity and content related to our model portfolio, it’s not too late. Click Here. 

Recent News 

Don’t throw out Brookfield Infrastructure with the market bath water (Globe & Mail)

https://www.theglobeandmail.com/investing/education/article-dont-throw-out-brookfield-infrastructure-with-the-market-bath-water/

“As unpleasant as that’s been, there’s nothing inherently wrong with Brookfield Infrastructure’s businesses. The chief problem is rising interest rates.”

Brookfield Infrastructure saw a nice bounce back in its stock price last week and seems to have some life after the optimistic outlook from management in its Q3 earnings report, earlier in the month.

Investors in thematic funds hurt returns by trading too frequently: Morningstar

https://www.theglobeandmail.com/investing/investment-ideas/article-investors-in-thematic-funds-hurt-returns-by-trading-too-frequently/

“Most investors would achieve better investment outcomes by adopting a more patient buy-and-hold approach,” said the analysts.

One of the things I like about our dividend growth investing strategy is our passive approach to investing. If the company, we have on our list does not reach a ‘sensible price’ we don’t buy. If it doesn’t get severely overvalued, we don’t sell. Most of the time we do nothing and collect our growing income. Frequent trading does not bode well for the average investor over the long term.

To receive breaking news about companies on ‘The List’, follow us on Twitter @MagicPants_DGI.

Dividend Increases

“The growth of dividend paying ability is of significance in the determination of a stock’s quality, or general safety…”

– Arnold Bernhard (the founder of Value Line)

No companies on ‘The List’ announced a dividend increase last week.


Earnings Releases

Benjamin Graham once remarked that earnings are the principal factor driving stock prices.

Each quarter, we will provide readers with weekly earnings updates of stocks on ‘The List’ during the calendar earnings season. 

The updated earnings calendar can be found here.

Earnings growth and dividend growth tend to go hand in hand, so this information can tell us a lot about the future dividend growth of our quality companies. Monitoring our dividend growers periodically is part of the process, and reading the quarterly earnings releases is a good place to start.

No earnings reports from companies on ‘The List’ this week

Last week, two earnings reports from companies on ‘The List’.

Loblaw Companies Limited (L-T) released its third-quarter fiscal 2023 results on Wednesday, November 15, 2023, before markets opened.

“Our stores are delivering more value, including deeper discounts on essentials, and customers are responding positively. We remain focused on doing what we can to fight inflation and deliver lower prices for Canadians, while continuing to invest for the future.”

– Galen G. Weston, Chairman

Highlights:

  • Revenue was $18,265 million, an increase of $877 million, or 5.0%.
  • Retail segment sales were $17,982 million, an increase of $852 million, or 5.0%.
    • Food Retail (Loblaw) same-stores sales increased by 4.5%.
    • Drug Retail (Shoppers Drug Mart) same-store sales increased by 4.6%, with front store same-store sales growth of 1.8% and pharmacy same-store sales growth of 7.4%.
  • E-commerce sales increased by 13.6%.
  • Operating income was $1,065 million, an increase of $74 million, or 7.5%.
  • Adjusted EBITDA was $1,926 million, an increase of $80 million, or 4.3%.
  • Retail segment adjusted gross profit percentage was 30.6%, a decrease of 20 basis points.
  • Net earnings available to common shareholders of the Company were $621 million, an increase of $65 million or 11.7%. Diluted net earnings per common share were $1.95, an increase of $0.26, or 15.4%.
  • Adjusted net earnings available to common shareholders of the Company were $719 million, an increase of $56 million, or 8.4%.
  • Adjusted diluted net earnings per common share were $2.26, an increase of $0.25 or 12.4%.
  • Repurchased for cancellation 2.9 million common shares at a cost of $341 million and invested $676 million in capital expenditures, net of proceeds from property disposals. Free cash flow used in the Retail segment was $663 million.

Outlook:

Loblaw will continue to execute on retail excellence while advancing its growth initiatives in 2023. The Company’s businesses remain well placed to service the everyday needs of Canadians. However, the Company cannot predict the precise impacts of global economic uncertainties, including the inflationary environment, on its 2023 financial results.

For the full-year 2023, the Company continues to expect:

  • its Retail business to grow earnings faster than sales;
  • adjusted net earnings per common share growth in the low double digits;
  • to increase investments in our store network and distribution centres by investing a net amount of $1.6 billion in capital expenditures, which reflects gross capital investments of approximately $2.1 billion offset by approximately $500 million of proceeds from real estate dispositions; and
  • to return capital to shareholders by allocating a significant portion of free cash flow to share repurchases.

Source: (L-T) Q3-2023 Quarterly Review


Metro Inc. (MRU-T) released its fourth-quarter fiscal 2023 results on Wednesday, November 15, 2023, before markets opened.

“We are pleased with our fourth quarter results which were achieved in a challenging operating environment that included a 5-week strike at 27 Metro stores in Ontario. For the first time in our history, sales for the year exceeded $20 billion and net earnings reached $1 billion. Our sales momentum remains strong, driven by our discount banners and pharmacy. Food inflation declined steadily during the quarter and our teams continue to deliver the best value possible to our customers every day. We reached a key milestone in our supply chain modernization program with the start-up of our new state-of-the-art automated distribution center for fresh and frozen products north of Montreal. This facility will improve service to our stores and fuel our long-term growth.”

– Eric La Fleche, President and Chief Executive Officer

Highlights:

  • 53-week fiscal year versus 52 weeks in 2022
  • Sales of $20,724.6 million, up 9.7%
  • Net earnings of $1,018.8 million, up 19.9%, and adjusted net earnings of $1,006.6 million, up 9.2%
  • Fully diluted net earnings per share of $4.35, up 23.9%, and adjusted fully diluted net earnings per share of $4.30, up 12.6%

Outlook:

As we begin our new fiscal year, we are ramping up our new state-of-the-art, automated distribution center north of Montreal and the expansion of our Montreal produce facility as planned. We are also preparing for the launch of the final phase of our automated fresh facility in Toronto next spring. While these investments position us well for continued long-term profitable growth, we are facing significant headwinds in Fiscal 2024 as we incur some temporary duplication of costs and learning curve inefficiencies, as well as higher depreciation and lower capitalized interest. We will not fully absorb these additional expenses and we are currently forecasting operating income before depreciation and amortization and impairments of assets, net of reversals to grow by less than 2% in Fiscal 2024 versus the level reported in Fiscal 2023, and adjusted net earnings per share to be flat to down $0.10 in Fiscal 2024 versus the level reported in Fiscal 2023. We expect to resume our profit growth post Fiscal 2024 and are maintaining our publicly disclosed annual growth target of between 8% and 10% for net earnings per share over the medium and long term.

Source: (MRU-T) Q4-2023 Quarterly Review


MP Market Review – November 10, 2023

Last updated by BM on November 13, 2023

Summary 

  • This is a weekly installment of our MP Market Review series, which provides updates on the financial markets and Canadian dividend growth companies we monitor on ‘The List’.
  • Last week, ‘The List’ was up over last week with a YTD price return of +1.4% (capital). Dividend growth remained the same and is now at +8.8% YTD, highlighting income growth this year.
  • Last week, one dividend increase from companies on ‘The List’.
  • Last week, nine earnings reports from companies on ‘The List’.
  • Two companies on ‘The List’ are due to report earnings this week.
  • If you’re interested in creating your own dividend growth income portfolio, consider subscribing to our premium service, which grants you access to the MP Wealth-Builder Model Portfolio (CDN) and exclusive subscriber-only content.  Learn More         

Identifying companies whose dividend growth aligns closely with price growth can considerably enhance the predictability of future returns. Dividend growth investors know that the dividend drives the price in a predictable way, not the other way around. Fortis Inc. (FTS-T) is another company on ‘The List’ that aligns very closely with this dividend growth vs price growth pattern we like to see.

Introduction

“You have a pair of pants. In the left pocket, you have $100. You take $1 out of the left pocket and put it in the right pocket. You now have $101. There is no diminution of dollars in your left pocket. That is one magic pair of pants.”

This ‘magic pants’ analogy was from a Seeking Alpha article on dividend investing I read about a decade ago and was one of the catalysts for me to take a closer look at this type of investing and see if it truly was magical. 

After conducting additional research, I have shifted towards utilizing a dividend growth investing (DGI) strategy as my primary investment approach. While I maintain portfolios consisting of high-quality dividend growers from both the United States and Canada, I have opted to concentrate on Canadian (CDN) dividend growth companies in this blog. This is due to several reasons, including a smaller pool of DGI companies to track, a lack of coverage for the DGI strategy by the North American investment media, and a tendency for those who do cover DGI to narrowly focus on only a handful of sectors (Energy and Financials).

While ‘The List’ is not a portfolio in itself, it serves as an excellent initial reference for individuals seeking to diversify their investments and attain higher returns in the Canadian stock market. Through our blog, we provide weekly updates on ‘The List’ and offer valuable perspectives and real-life examples of the dividend growth investing strategy in practice. This helps readers gain a deeper understanding of how to implement and benefit from this investment approach.


DGI Clipboard

“As a dividend increase is a positive sign of a company’s financial strength, the safest purchase, after research, is a stock with a recent dividend increase.”

– Tom Connolly (the founder of dividendgrowth.ca)

Dividends send signals

Our list of high-quality dividend stocks is currently in the process of revealing upcoming dividend increases for the next year. While the past couple of years have presented challenges for capital returns, the steady growth of dividends remains a reassuring trend. As we analyze ‘The List,’ it becomes evident that dividends are conveying valuable signals that can inform our decision-making when it comes to purchases.

In his 2006 article, ‘Go for Dividends’, author Steve Hanke says it best:

“The positive, intuitive idea is that companies adjust dividend payouts to signal prospects. Corporate insiders have better information about potential sales growth, margins and free cash flows than investors do. Dividends are simply an efficient way for insiders to convey this valuable information to the market. A rise in dividends signals better prospects, and a decrease signals that a company expects trouble. An increase in dividends signals that corporate insiders believe the company will have enough cash flow to sustain operations and complete investment plans. And, of course, make good on their dividend commitments.”

It’s important to consider the size of the dividend increase. If a company announces a smaller increase than in the previous year, it may suggest impending short-term challenges. This could either reflect prudent management or serve as a signal that all is not well.

Here are a couple of recent dividend announcements as examples:

Waste Connections (WCN-N) on Wednesday, October 25th, said it increased its 2023 quarterly dividend from $0.255 to $0.285 per share, payable November 28, 2023, to shareholders of record on November 8, 2023.

This represents a dividend increase of +11.8%, marking the 14th straight year of dividend growth for this quality solid waste and recycling services company.

(WCN-N) raised its dividend by +10.5% in the past year, maintaining a five-year average increase of +13.7%. The announced increase for next year (+11.8%) aligns with its historical average, suggesting that management is expressing confidence in the company’s outlook.

Canadian Tire (CTC-A-T) on Thursday, November 9, said it increased its 2024 quarterly dividend from $1.725 to $1.750 per share, payable March 01, 2024, to shareholders of record on January 31, 2024.

This represents a dividend increase of +1.45%, marking the 13th straight year of dividend growth for this quality retailer.

On the flip side, (CTC-A-T) raised its dividend by +17.9% in the past year, maintaining a five-year average increase of +15.8%. The modest increase for next year (+1.45%) suggests that management is expressing heightened caution about their prospects in 2024. Nonetheless, their commitment to sustaining their dividend streak remains evident.

In both cases, you see a commitment to not only paying a dividend but growing that dividend. Not all companies on ‘The List’ consistently raise their dividends by the same rate each year so pay attention to the signals!

If you have not yet joined as a paid subscriber of the blog to receive DGI Alerts on the activity and content related to our model portfolio, it’s not too late. Click Here. 

Recent News 

Are there any dividend growth stocks that haven’t been pounded this year? (Globe & Mail)

https://www.theglobeandmail.com/investing/markets/inside-the-market/article-are-there-any-dividend-growth-stocks-that-havent-been-pounded-this/

I couldn’t help but leave a comment for the author.

When you mention dividend growth you should not put so much attention on initial yield. This is where you make your mistake. There are several good Canadian dividend growth stocks that have performed well this year if you do not start your ‘screen’ with such a high initial yield. After all, it is the dividend growth that drives the price growth not the starting yield. Stella Jones (SJ); Stantec (STN); Alimentation Couche-Tard Inc. (ATD); Dollarama Inc. (DOL) all have capital returns over 20% YTD. Magically, the average dividend growth of this list is 17% YTD as well.

To receive breaking news about companies on ‘The List’, follow us on Twitter @MagicPants_DGI.

The List (2023)

Last updated by BM on November 10, 2023

The Magic Pants List contains 27 Canadian dividend growth stocks. ‘The List’ contains Canadian companies that have raised their dividend yearly for at least the last ten years and have a market cap of over a billion dollars. Below is each stock’s symbol, name, current yield, current price, price return year-to-date, current dividend, dividend growth year-to-date and current dividend growth streak. Companies on ‘The List’ are added or subtracted once a year, on January 1. After that, ‘The List’ is set for the next twelve months. Prices and dividends are updated weekly.

SYMBOL COMPANY YLD PRICE YTD % DIV YTD % STREAK
AQN-N Algonquin Power & Utilities 9.0% $5.61 -16.6% $0.51 -29.0% 12
ATD-T Alimentation Couche-Tard Inc. 0.7% $78.65 30.8% $0.56 19.1% 13
BCE-T Bell Canada 7.3% $53.12 -11.8% $3.87 5.2% 14
BIP-N Brookfield Infrastructure Partners 4.4% $25.53 -18.5% $1.44 6.3% 15
CCL-B-T CCL Industries 2.0% $53.96 -7.0% $1.06 10.4% 21
CNR-T Canadian National Railway 2.1% $154.14 -5.4% $3.16 7.8% 27
CTC-A-T Canadian Tire 4.9% $140.31 -4.3% $6.90 17.9% 12
CU-T Canadian Utilities Limited 5.8% $30.71 -16.9% $1.79 1.0% 51
DOL-T Dollarama Inc. 0.3% $98.87 23.8% $0.27 23.8% 12
EMA-T Emera 5.9% $48.08 -8.6% $2.82 5.0% 16
ENB-T Enbridge Inc. 7.7% $46.10 -13.6% $3.55 3.2% 27
ENGH-T Enghouse Systems Limited 2.5% $34.07 -4.6% $0.85 18.2% 16
FNV-N Franco Nevada 1.1% $119.40 -13.6% $1.36 6.3% 15
FTS-T Fortis Inc. 4.1% $55.70 0.7% $2.29 5.3% 49
IFC-T Intact Financial 2.1% $206.37 5.4% $4.40 10.0% 18
L-T Loblaws 1.4% $121.31 0.8% $1.74 13.2% 11
MGA-N Magna 3.5% $52.62 -8.5% $1.84 2.2% 13
MRU-T Metro 1.6% $74.53 -1.3% $1.21 10.0% 28
RY-T Royal Bank of Canada 4.6% $116.78 -8.8% $5.34 7.7% 12
SJ-T Stella-Jones Inc. 1.1% $83.03 67.5% $0.92 15.0% 18
STN-T Stantec Inc. 0.8% $94.66 44.9% $0.77 8.5% 11
TD-T TD Bank 4.7% $81.96 -6.5% $3.84 7.9% 12
TFII-N TFI International 1.3% $111.59 11.4% $1.40 29.6% 12
TIH-T Toromont Industries 1.5% $112.99 15.6% $1.68 10.5% 33
TRP-T TC Energy Corp. 7.5% $49.49 -7.1% $3.69 3.4% 22
T-T Telus Corp. 6.0% $23.79 -9.6% $1.43 7.4% 19
WCN-N Waste Connections 0.8% $130.54 -0.9% $1.05 10.5% 13
Averages 3.5% 1.4% 8.8% 19

Six Canadian stocks on ‘The List’ declare earnings and dividends in US dollars and are inter-listed on a US exchange in US dollars. The simplest way to display dividend and price metrics for these stocks is to show their US exchange symbols along with their US dividends and price. The stocks I am referring to have a -N at the end of their symbols. You can still buy their Canadian counterparts (-T), but your dividends will be converted into CDN dollars and will fluctuate based on the exchange rate.

Note: When the dividend and share price currency match, the calculation is straightforward. But it’s not so simple when the dividend is declared in one currency, and the share price is quoted in another. Dividing the former by the latter would produce a meaningless result because it’s a case of apples and oranges. To calculate the yield properly, you must express the dividend and share price in the same currency.

Performance of ‘The List’

Feel free to click on this link, ‘The List’ for a sortable version from our website.

Last week, ‘The List’ was up over last week with a YTD price return of +1.4% (capital). Dividend growth remained the same and is at +8.8% YTD, highlighting growth in income.

The best performers last week on ‘The List’ were Stella-Jones Inc. (SJ-T), up +11.32%; Stantec Inc. (STN-T), up +8.72%; and Intact Financial (IFC-T), up +3.79%.

Brookfield Infrastructure Partners (BIP-N) was the worst performer last week, down -5.58%.


Dividend Increases

“The growth of dividend paying ability is of significance in the determination of a stock’s quality, or general safety…”

– Arnold Bernhard (the founder of Value Line)

One company on ‘The List’ announced a dividend increase last week.

Canadian Tire (CTC-A-T) on Thursday said it increased its 2024 quarterly dividend from $1.725 to $1.750 per share, payable March 01, 2024, to shareholders of record on January 31, 2024.

This represents a dividend increase of +1.45%, marking the 13th straight year of dividend growth for this quality retailer.


Earnings Releases

Benjamin Graham once remarked that earnings are the principal factor driving stock prices.

Each quarter, we will provide readers with weekly earnings updates of stocks on ‘The List’ during the calendar earnings season. 

The updated earnings calendar can be found here.

Earnings growth and dividend growth tend to go hand in hand, so this information can tell us a lot about the future dividend growth of our quality companies. Monitoring our dividend growers periodically is part of the process, and reading the quarterly earnings releases is a good place to start.

Two earnings reports from companies on ‘The List’ this week

Loblaw Companies Limited (L-T) will release its third-quarter fiscal 2023 results on Wednesday, November 15, 2023, before markets open.

Metro Inc. (MRU-T) will release its fourth-quarter fiscal 2023 results on Wednesday, November 15, 2023, before markets open.

Last week, nine earnings reports from companies on ‘The List’.

Stella-Jones Inc. (SJ-T) released its third-quarter fiscal 2023 results on Tuesday, November 07, 2023, before markets opened.

“In Q3, Stella-Jones made notable progress in its growth trajectory, delivering not only another quarter of strong sales growth, but record increase in profitability.”

– Eric Vachon, President and Chief Executive Officer

Highlights:

  • Sales of $949 million, up 13%
  • 17% organic sales growth in infrastructure-related businesses
  • EBITDA of $193 million, or a margin of 20.3%, up from 14.1% in Q3 2022
  • Net income of $110 million, or $1.91 per share, up 79% from EPS in Q3 2022
  • Acquired utility pole manufacturing business of Baldwin Pole and Piling (“Baldwin”)
  • Normal Course Issuer Bid announced for 2023-2024

Outlook:

Source: (SJ-T) Q3-2023 Quarterly Review


Intact Financial (IFC-T) released its third-quarter fiscal 2023 results on Tuesday, November 07, 2023, after markets closed.

“Our teams remain hard at work getting customers back on track after several months of elevated severe weather activity. It is in precisely these moments that we can best demonstrate our purpose – to help people, businesses and society be resilient in bad times. We have a long track record of successfully navigating volatility in catastrophe losses. The third quarter was no different, as we delivered an operating ROE of 12.2%, and our balance sheet remained strong with $2.8 billion of total capital margin. I am pleased to see continued organic growth momentum, in the context of strong underlying underwriting performance and an acceleration in the UK&I segment’s path to outperformance.”

– Charles Brindamour, Chief Executive Officer

Highlights:

  • Net operating income per share of $2.10 despite elevated catastrophe losses, driven by solid underlying performance in all geographies and 50% growth in net investment income
  • Undiscounted combined ratio of 98.3% (93.5% discounted) included 8 points of catastrophe losses in excess of expectations, while inflation moderated as expected in personal auto, and results remained strong across commercial lines
  • Operating DPW growth of 6% led by good momentum in personal lines, and continued rate action across all business segments
  • Strong balance sheet with $2.8 billion of total capital margin1 and BVPS increasing 1% sequentially, reflecting EPS of $0.83 and an equity issuance for the acquisition of Direct Line Insurance Group plc’s brokered commercial lines operations
  • Accelerated our strategy by materially increasing our presence in the outperforming UK commercial lines business, while a strategic review of UK personal lines is underway

Outlook:

  • Over the next twelve months, we expect hard insurance market conditions to continue in most lines of business, driven by inflation and natural disasters.
  • In Canada, both personal property and auto premiums are expected to grow by high single-digits in response to higher severity.
  • In commercial and specialty lines across all geographies, we expect hard market conditions to continue in most lines of business, with high single-digit premium growth on average.
  • Given the rise in interest rates, we expect pre-tax investment yield for the industry to continue increasing as portfolios roll over.

Source: (IFC-T) Q3-2023 Quarterly Review


TC Energy (TRP-T) released its third-quarter fiscal 2023 results on Wednesday, November 08, 2023, before markets opened.

“During the third quarter, we made monumental progress on Coastal GasLink and have achieved mechanical completion ahead of our year-end target. The team’s exceptional safety and construction execution on this challenging project means that we have reached 100 per cent pipeline installation, including the successful hydrotesting of the full 670 km pipeline length. The project remains on track with the approximately $14.5 billion cost estimate. We are also delivering on our 2023 strategic priorities, including strengthening the balance sheet with the recent receipt of $5.3 billion of asset sale proceeds that will be utilized for debt repayment and funding, along with maximizing the value of our assets with the announced intention to spin off our Liquids Pipelines business. Our focus on safety and the reliability of our assets continues to deliver strong year-over-year growth, and we remain on track to deliver a record year for 2023 comparable EBITDA despite macroeconomic headwinds.”

– François Poirier, President and Chief Executive Officer

Highlights:

  • Delivered approximately seven per cent comparable EBITDA growth of $2.6 billion in third quarter 2023 compared to $2.5 billion in third quarter 2022. Segmented earnings were $0.6 billion in third quarter 2023 compared to $1.8 billion in third quarter 2022, largely due to the after-tax impairment charge of $1,179 million for the three months ended September 30, 2023 related to TC Energy’s equity investment in Coastal GasLink Pipeline Limited Partnership (Coastal GasLink LP)
  • Third quarter 2023 results were underpinned by solid utilization and reliability across our assets. While our Natural Gas Pipelines business does not carry material volumetric or price risk, strong utilization rates demonstrate the demand for our services and the longer-term criticality of our assets
    • NGTL System receipts averaged 14.0 Bcf/d, up 0.5 Bcf/d from third quarter 2022
    • NGTL System daily receipts reached 14.6 Bcf on August 6, 2023, the highest single day average on the pipeline
    • S. Natural Gas Pipelines LNG deliveries averaged 3.1 Bcf/d, up 1.4 per cent from third quarter 2022
    • S. Natural Gas Pipelines business achieved a new record of deliveries to power generators of 5.2 Bcf on July 28, 2023
    • Gas Transmission Northwest (GTN) system achieved an all-time delivery record of 2.96 Bcf on July 25, 2023
    • Keystone Pipeline System achieved 93.7 per cent operational reliability year-to-date
    • Successfully completed two open seasons on Marketlink, supporting the sustained demand for Canadian crude on the Keystone Pipeline and Marketlink systems
    • Alberta cogeneration power plant fleet achieved approximately 98 per cent peak price availability
    • Bruce Power achieved 94 per cent availability and successfully completed the Unit 6 Major Component Replacement (MCR) within budget and ahead of schedule
  • Third quarter 2023 financial results:
    • Net losses attributable to common shares of $0.2 billion or $0.19 per common share compared to net income of $0.8 billion or $0.84 per common share in third quarter 2022. Comparable earnings of $1.0 billion or $1.00 per common share compared to $1.1 billion or $1.07 per common share in 2022
    • Comparable EBITDA of $2.6 billion compared to $2.5 billion in 2022 and segmented earnings of $0.6 billion compared to $1.8 billion in 2022
  • Reflecting strong year-to-date operational and financial performance, we now expect 2023 comparable EBITDA to be at the upper end of the five to seven per cent outlook compared to 2022, while 2023 comparable earnings per common share is expected to be generally consistent with 2022
  • Year to date, we have placed approximately $5 billion of projects into service on our natural gas and liquids pipeline systems, as well as the Bruce Power Unit 6 MCR which was declared commercially operational on September 14, 2023
  • Placed the lateral section of the Villa de Reyes (VdR) pipeline in commercial service
  • Placed substantially all assets of the NGTL System/Foothills West Path Delivery Program into service on November 1, 2023
  • On October 4, 2023, we successfully completed the sale of a 40 per cent non-controlling equity interest in Columbia Gas Transmission, LLC (Columbia Gas) and Columbia Gulf Transmission, LLC (Columbia Gulf) systems to Global Infrastructure Partners (GIP) for total cash proceeds of $5.3 billion (US$3.9 billion), which were directed towards reducing leverage
  • Coastal GasLink has achieved mechanical completion, ahead of its year-end target and the project remains on track with the cost estimate of approximately $14.5 billion
  • The Southeast Gateway Pipeline project continues to progress to our US$4.5 billion cost estimate and schedule. Land rights and rights of way negotiations have closed and all critical permits for onshore construction have been received. We are advancing construction of on-shore facilities and landfalls. Offshore engineering is complete and offshore installation expected to commence prior to the end of 2023
  • Approved the Bison XPress expansion project on Northern Border and Bison systems that will replace and upgrade certain facilities and provide production egress from the Bakken basin to a delivery point at the Cheyenne Hub
  • GTN XPress project received FERC approval to expand the GTN system that will provide for the transport of incremental contracted export capacity facilitated by the NGTL System/Foothills West Path Delivery Program
  • John E. Lowe will be appointed as TC Energy’s Board Chair, effective January 1, 2024
  • Progressing proposed Liquids Pipelines spinoff with the announcement of the Board Chair and company name, South Bow Corporation
  • Declared a quarterly dividend of $0.93 per common share for the quarter ending December 31, 2023.

Outlook:

Reflecting strong year-to-date operational and financial performance, we now expect 2023 comparable EBITDA to be at the upper end of the five to seven per cent outlook compared to 2022 and 2023 comparable earnings per share to be generally consistent with 2022. Total capital expenditures for 2023 are now expected to be approximately $12.0 billion to $12.5 billion. While the estimated capital costs associated with our major projects remains consistent, the increase from the range as outlined in our 2022 Annual Report is primarily related to shifts in timing for some of our growth projects and maintenance capital expenditures in our natural gas pipelines businesses, as well as the foreign exchange impact of a stronger U.S. dollar. We continue to work on cost mitigation strategies and assess developments in our construction projects and market conditions for changes to our overall capital program. To date, we have placed approximately $5 billion of assets into service on budget, further supporting comparable EBITDA growth. Beyond 2024, we remain committed to limiting annual sanctioned net capital expenditures to $6 billion to $7 billion. At this level, we believe we can continue to grow our business at a commensurate rate with our dividend growth outlook of three to five per cent, while also providing the optionality to further reduce leverage and/or return incremental capital to shareholders. TC Energy’s Board of Directors declared a quarterly dividend of $0.93 per common share for the quarter ending December 31, 2023, equating to $3.72 on an annualized basis.

Source: (TRP-T) Q3-2023 Quarterly Review


CCL Industries (CCL-B-T) released its third-quarter fiscal 2023 results on Wednesday, November 08, 2023, after markets closed.

“The Company posted another solid quarter despite soft demand from customer destocking initiatives, the impact of inflation and higher interest rates on consumers plus the geopolitical uncertainties unfolding around the world. Excluding an $11.9 million gain on the sale of excess real estate recorded at Checkpoint in the 2022 third quarter, I am pleased to report all Segments reported operating income gains compared to the prior year period. Consolidated, the Company posted $0.95 basic and adjusted basic earning per Class B share for the third quarter of 2023, equal to the record prior year period.”

– Geoffrey T. Martin, President and Chief Executive Officer

Highlights:

CCL

  • Sales increased 6.4% to $1.1 billion, on 3.6% organic decline, offset by 4.0% acquisition contribution and 6.0% positive impact from foreign currency translation
  • Regional organic sales growth: almost flat in the Americas, mid-single digit decline in Europe and double digit decline in Asia Pacific
  • Operating income $169.7 million, increased 5.9%, 15.9% operating margin down 10 bps
  • Label joint ventures added $0.03 earnings per Class B share

Avery

  • Sales increased 4.9% to $269.5 million, on 0.7% organic decline, offset by 1.2% acquisition contribution and 4.4% positive impact from foreign currency translation
  • Operating income $50.7 million, up 13.4%, 18.8% operating margin , up 140 bps

Checkpoint

  • Sales increased 7.2% to $210.1 million, on organic growth of 4.1% and 3.1% positive impact from foreign currency translation
  • Operating income $28.8 million, down 17.9%, 13.7% operating margin , down 420 bps. Excluding the $11.9 million gain on sale of excess real estate in China in 2022, operating income up 24.1%

Innovia

  • Sales declined 28.4% to $146.3 million with 34.4% organic decline partially offset by 6.0% positive impact from foreign currency translation
  • Operating income $6.9 million, up 1.5%, 4.7% operating margin, up 140 bps

Outlook:

  • Core CCL business units’ expect similar conditions to Q3 for the coming quarter
  • CCL Design expected to return to profit growth as we lap the change in demand in the electronics industry
  • CCL Secure should post modest progress
  • Avery results expected to be stable, horticulture moves into busy production season
  • Checkpoint faces tough comps compared to a strong end to 2022, RFID continues to grow
  • Innovia expected to outperform weak Q422, perhaps significantly if the label materials industry volume recovery gains traction
  • FX tailwind to continue at current exchange rates

Source: (CCL-B-T) Q3-2023 Quarterly Review


Franco Nevada (FNV-N) released its third-quarter fiscal 2023 results on Wednesday, November 08, 2023, after markets closed.

“Our core precious metal assets anchored the quarter, resulting in increased revenue and earnings over the prior year period. We are looking forward to added precious metal contributions from a number of new mines in 2024 and, in particular, from the Tocantinzinho stream where G Mining Ventures is progressing construction on time and budget. Franco-Nevada is debt-free and is growing its cash balances.”

– Paul Brink, Chief Executive Officer

Highlights:

  • In Q3 2023, we earned $309.5 million in revenue, up 1.7% from Q3 2022. We benefited from an increase in GEOs from our Precious Metal assets as well as higher gold prices. This more than offset the decrease in revenue from our Diversified assets, which reflect lower oil and gas prices when compared to the relative highs of the prior year quarter.
  • Precious Metal revenue accounted for 77.8% of our revenue (64.5% gold, 10.2% silver, 3.1% PGM). Revenue was sourced 88.0% from the Americas (28.7% South America, 28.4% Central America & Mexico, 15.9% U.S. and 15.0% Canada).

Outlook:

The Panamanian National Assembly approved the revised Cobre Panama concession agreement in October 2023. In response to protests that followed the approval, the Government proposed but did not proceed with a popular consultation on the revised concession contract. The Panamanian Supreme Court is, however, considering a number of lawsuits challenging the constitutionality of the law pertaining to the contract. Production at the Cobre Panama mine has not been impacted and we, along with the operator, First Quantum, are closely monitoring the unfolding situation.

Source: (FNV-N) Q3-2023 Quarterly Review


Canadian Tire (CTC-A-T) released its third-quarter fiscal 2023 results on Thursday, November 09, 2023, before markets opened.

“Against softening consumer demand, our Q3 results show the continued resilience, relevance, and underlying strength of our business as we leveraged loyalty and prioritized essential categories within our multi-category assortment. We remain focused on driving value for our customers as we head into the important fourth quarter.”

– Greg Hicks, President and Chief Executive Officer

Highlights:

  • Consolidated comparable sales1 down 1.6% as consumers continue to shift to essentials
  • Increase in Retail Gross margin rate as higher CTR product margin offset promotional intensity at other banners
  • Normalized diluted Earnings Per Share1 (“EPS”) was $2.96; Diluted EPS was $(1.19)
  • Annualized dividend increased from $6.90 to $7.00 per share; intention to repurchase up to an additional $200.0 million Class A Non-Voting Shares during 2024

Outlook:

“In a more challenging economic environment, we are accelerating efficiency initiatives, prioritizing investments within our Better Connected strategy, and actively managing our resource allocation,” added Hicks.

Source: (CTC-A-T) Q3-2023 Quarterly Review


Stantec (STN-T) released its third-quarter fiscal 2023 results on Thursday, November 09, 2023, after markets closed.

“I am extremely pleased with our third quarter results as we continued to deliver exceptional growth in revenue and earnings through excellent operational performance. As a result of our outperformance this quarter, our strong year-to-date results, and the continued favorable market demand, we are increasing our guidance for 2023 once more. Our backlog is at a near-record high level and market demand continues to be robust, bolstering our optimism for ongoing strong growth in 2024 and beyond. We are confident that our diverse business model and engaged workforce ideally position Stantec to continue delivering industry-leading results.”

– Gord Johnston, President and Chief Executive Officer

Highlights:

  • Net revenue of $1.3 billion, an increase of 13.5% over Q3 2022
  • Adjusted EBITDA margin1of 18.3%, up 160 basis points over Q3 2022
  • Adjusted diluted EPS1of $1.14, up 32.6% over Q3 2022
  • Backlog of $6.4 billion, up 7.6% since December 31, 2022

Outlook:

Source: (STN-T) Q3-2023 Quarterly Review


Emera Inc. (EMA-T) released its third-quarter fiscal 2023 results on Friday, November 10, 2023, before markets opened.

“Continued strong operational performance across Emera is helping to offset the headwinds of higher interest costs, and we continue to see solid growth throughout our business. Our $8.9 billion 3-year capital plan underpins this growth as we continue to invest to deliver upon our customer’s demand for cleaner, reliable and cost-effective energy.”

– Scott Balfour, President and Chief Executive Officer

Highlights:

  • Quarterly adjusted EPS was $0.75 compared to $0.76 in Q3 2022. Quarterly reported net income per common share decreased $0.26 to $0.37 in Q3 2023 compared to $0.63 in Q3 2022 due to higher mark-to-market (“MTM”) losses.
  • Year-to-date, adjusted EPS increased $0.06 or 3% to $2.33 compared to $2.27 in 2022. Year-to-date reported EPS was $2.53 compared to $1.75 in 2022, primarily due to year-over-year differences in MTM impacts.
  • Operating cash flow before changes in working capital increased 125% to $1.8 billion compared to $806 million in 2022 due to solid operating performance and the recovery of fuel and storm costs in 2023 that were under-recovered in 2022.
  • 2024-2026 capital plan of $8.9 billion predominately focused on reliability, customer growth and cleaner energy investments is driving approximately 7% annualized rate base growth.
  • Approximately 75% of our capital plan to be invested in Florida.
  • The Florida Public Service Commission approved new rates for Peoples Gas Systems, Inc. (“PGS”) which will provide additional annual revenues of $107M USD starting in 2024. This outcome from the PGS rate case application positions us to advance important investments to support the growth of that business for the benefit of customers.

Outlook:

There have been no material changes in Emera’s business overview and outlook from the Company’s 2022 annual MD&A. Emera’s year-to-date results have been impacted by macroeconomic conditions, specifically higher interest rates as well as other impacts of inflation. These macroeconomic conditions are likely to continue for the near term.

Source: (EMA-T) Q3-2023 Quarterly Review


Algonquin Power & Utilities (AQN-N) released its third-quarter fiscal 2023 results on Friday, November 10, 2023, before markets opened.

“We have launched the sale process for our portfolio of high-quality renewable assets and extensive development pipeline, and we remain focused on appropriate valuation. Having now served as Interim CEO for three months and met with various stakeholders, I believe the Company’s two businesses have untapped potential and bright futures ahead. With regards to the quarter, we continued to see constructive growth from rate cases and new development projects year over year.  However, we also saw those efforts partially offset by unfavourable weather and higher interest rates.  On balance, our Adjusted Net Earnings1 grew at a healthy pace for the quarter.”

– Chris Huskilson, Interim Chief Executive Officer

Highlights:

  • Adjusted EBITDA of $281.3 million, an increase of 2%;
  • Adjusted Net Earnings of $79.3 million, an increase of 8%; and
  • Adjusted Net Earnings1per common share of $0.11, no change, in each case on a year-over-year basis.

Outlook:

  • YTD results challenged by unfavourable weather
  • 2023 Adjusted Net EPS expected to be at or below lower end of 2023 guidance
  • Remain focused on renewables sales process

Source: (AQN-N) Q3-2023 Quarterly Review

MP Market Review – November 03, 2023

Last updated by BM on November 06, 2023

Summary 

  • This is a weekly installment of our MP Market Review series, which provides updates on the financial markets and Canadian dividend growth companies we monitor on ‘The List’.
  • Last week, ‘The List’ was up with a YTD price return of +0.8% (capital). Dividend growth remained the same and is now at +8.8% YTD, highlighting income growth this year.
  • Last week, one dividend increase from companies on ‘The List’.
  • Last week, six earnings reports from companies on ‘The List’.
  • Nine companies on ‘The List’ are due to report earnings this week.
  • If you’re interested in creating your own dividend growth income portfolio, consider subscribing to our premium service, which grants you access to the MP Wealth-Builder Model Portfolio (CDN) and exclusive subscriber-only content.  Learn More         

Identifying companies whose dividend growth aligns closely with price growth can considerably enhance the predictability of future returns. Dividend growth investors know that the dividend drives the price in a predictable way, not the other way around. Fortis Inc. (FTS-T) is another company on ‘The List’ that aligns very closely with this dividend growth vs price growth pattern we like to see.

Introduction

“You have a pair of pants. In the left pocket, you have $100. You take $1 out of the left pocket and put it in the right pocket. You now have $101. There is no diminution of dollars in your left pocket. That is one magic pair of pants.”

This ‘magic pants’ analogy was from a Seeking Alpha article on dividend investing I read about a decade ago and was one of the catalysts for me to take a closer look at this type of investing and see if it truly was magical. 

After conducting additional research, I have shifted towards utilizing a dividend growth investing (DGI) strategy as my primary investment approach. While I maintain portfolios consisting of high-quality dividend growers from both the United States and Canada, I have opted to concentrate on Canadian (CDN) dividend growth companies in this blog. This is due to several reasons, including a smaller pool of DGI companies to track, a lack of coverage for the DGI strategy by the North American investment media, and a tendency for those who do cover DGI to narrowly focus on only a handful of sectors (Energy and Financials).

While ‘The List’ is not a portfolio in itself, it serves as an excellent initial reference for individuals seeking to diversify their investments and attain higher returns in the Canadian stock market. Through our blog, we provide weekly updates on ‘The List’ and offer valuable perspectives and real-life examples of the dividend growth investing strategy in practice. This helps readers gain a deeper understanding of how to implement and benefit from this investment approach.


DGI Clipboard

“Think of stocks as being chickens, and dividends as being the eggs that those stocks provide.”

-(Jim Garland, 2013, P.4, ‘Memo to the Darcy Family: To Thine Own Self Be True’)

Egg Farming in a Chicken Farming World

One of my greatest joys as a father was sharing Aesop’s fables with my kids when they were younger. The simple yet timeless moral lessons from these stories served as a foundation for conveying important values to my children in an enjoyable and educational manner.

From time to time, I come across stories that, like Aesop’s fables, convey essential investment principles. These principles have stood the test of time but are often overshadowed by the next ‘bright shiny object’ out there.

The story of the two farmers told by Jim Garland in his 2013 paper, ‘Memo to the Darcy Family: To Thine Own Self Be True’, is one such story.

“Imagine two farms and two farmers. One farmer raises chickens and sells them to grocery stores. We’ll call him a chicken farmer. The other farmer keeps hens in a henhouse and feeds the eggs to his rather large family. The second one is an egg farmer.

The first person, the chicken farmer, is vitally interested in the market value of chickens. The second one, the egg farmer, is vitally interested in the number of eggs that his hens can lay, and in the health of the hens, but he doesn’t care at all about the market value of his hens.

For the chicken farmer, risk means the probability of a decline in the price of chickens. On the other hand, the egg farmer could care less about market values. His risks are foxes, viruses, and other such threats to the well-being of his hens.

Think of stocks as being chickens, and dividends as being the eggs that those stocks provide. Total return investors are chicken farmer investors, because total return investors worry about the market value of their “chickens” – of their stocks. On the other hand endowment investors are egg farmer investors. All that endowment investors worry about is the current and future quantities of their “eggs” – of their dividends.”

The moral of the story: As dividend growth investors who purchase quality companies, we share a resemblance with egg farmers in that our primary concern is the present and future quantities of our growing dividends, not the volatility in the price.

If you have not yet joined as a paid subscriber of the blog to receive DGI Alerts on the activity and content related to our model portfolio, it’s not too late. Click Here. 

Recent News 

First Quantum faces ‘shocker’ in Panama as president calls referendum on Cobre Panama contract (Globe & Mail)

https://www.theglobeandmail.com/business/article-first-quantum-faces-uncertainty-as-panamanian-president-calls/

The Panamanian government swiftly reversed its decision just one week after implementing a new law that would have allowed First Quantum to pay higher taxes to the government in exchange for keeping the mine operational. It now appears that a referendum may be necessary to officially enact this agreement into law.

Franco Nevada (FNV-T) holds a significant royalty stake with First Quantum in their Panama mine, and this surprising turn of events had a noticeable impact on the company’s share price last week. According to reports from Panama, it seems that resolving this situation may take some time.

Coastal GasLink completes B.C. pipeline installation after five years (Globe & Mail)

https://www.theglobeandmail.com/business/article-coastal-gaslink-completes-bc-pipeline-installation-after-five-years/

“Now that the pipeline has reached this milestone, it will soon enter the testing phase required before it can begin transporting natural gas to LNG Canada’s liquefied natural gas export terminal, which is still under construction in Kitimat, on the West Coast.

The terminal will be the first facility in Canada capable of loading natural gas in liquid form onto tankers for shipping abroad. It and the pipeline are critical to the industry’s hopes of supplying Asian markets with Canadian fuel.”

Coastal GasLink is operated by TC Energy Corp. (TRP-T), which currently owns 35 per cent of the project. This is good news for TC Energy who have run into several obstacles along the way in building this pipeline.

To receive breaking news about companies on ‘The List’, follow us on Twitter @MagicPants_DGI.

The List (2023)

Last updated by BM on November 03, 2023

The Magic Pants List contains 27 Canadian dividend growth stocks. ‘The List’ contains Canadian companies that have raised their dividend yearly for at least the last ten years and have a market cap of over a billion dollars. Below is each stock’s symbol, name, current yield, current price, price return year-to-date, current dividend, dividend growth year-to-date and current dividend growth streak. Companies on ‘The List’ are added or subtracted once a year, on January 1. After that, ‘The List’ is set for the next twelve months. Prices and dividends are updated weekly.

SYMBOL COMPANY YLD PRICE YTD % DIV YTD % STREAK
AQN-N Algonquin Power & Utilities 8.8% $5.75 -14.6% $0.51 -29.0% 12
ATD-T Alimentation Couche-Tard Inc. 0.7% $76.80 27.7% $0.56 19.1% 13
BCE-T Bell Canada 7.1% $54.52 -9.5% $3.87 5.2% 14
BIP-N Brookfield Infrastructure Partners 4.4% $27.04 -13.7% $1.44 6.3% 15
CCL-B-T CCL Industries 1.9% $55.57 -4.3% $1.06 10.4% 21
CNR-T Canadian National Railway 2.1% $151.77 -6.8% $3.16 7.8% 27
CTC-A-T Canadian Tire 4.8% $144.81 -1.2% $6.90 17.9% 12
CU-T Canadian Utilities Limited 5.7% $31.29 -15.3% $1.79 1.0% 51
DOL-T Dollarama Inc. 0.3% $95.96 20.2% $0.27 23.8% 12
EMA-T Emera 5.8% $48.48 -7.9% $2.82 5.0% 16
ENB-T Enbridge Inc. 7.7% $46.26 -13.3% $3.55 3.2% 27
ENGH-T Enghouse Systems Limited 2.5% $34.17 -4.3% $0.85 18.2% 16
FNV-N Franco Nevada 1.1% $124.69 -9.7% $1.36 6.3% 15
FTS-T Fortis Inc. 4.0% $56.85 2.7% $2.29 5.3% 49
IFC-T Intact Financial 2.2% $198.84 1.6% $4.40 10.0% 18
L-T Loblaws 1.5% $119.57 -0.6% $1.74 13.2% 11
MGA-N Magna 3.4% $53.51 -7.0% $1.84 2.2% 13
MRU-T Metro 1.7% $73.33 -2.8% $1.21 10.0% 28
RY-T Royal Bank of Canada 4.6% $116.05 -9.4% $5.34 7.7% 12
SJ-T Stella-Jones Inc. 1.2% $74.59 50.4% $0.92 15.0% 18
STN-T Stantec Inc. 0.9% $87.07 33.3% $0.77 8.5% 11
TD-T TD Bank 4.7% $80.98 -7.6% $3.84 7.9% 12
TFII-N TFI International 1.2% $114.02 13.9% $1.40 29.6% 12
TIH-T Toromont Industries 1.5% $110.05 12.6% $1.68 10.5% 33
TRP-T TC Energy Corp. 7.4% $49.92 -6.3% $3.69 3.4% 22
T-T Telus Corp. 5.9% $24.25 -7.9% $1.43 7.4% 19
WCN-N Waste Connections 0.8% $133.23 1.2% $1.05 10.5% 13
Averages 3.5% 0.8% 8.8% 19

Six Canadian stocks on ‘The List’ declare earnings and dividends in US dollars and are inter-listed on a US exchange in US dollars. The simplest way to display dividend and price metrics for these stocks is to show their US exchange symbols along with their US dividends and price. The stocks I am referring to have a -N at the end of their symbols. You can still buy their Canadian counterparts (-T), but your dividends will be converted into CDN dollars and will fluctuate based on the exchange rate.

Note: When the dividend and share price currency match, the calculation is straightforward. But it’s not so simple when the dividend is declared in one currency, and the share price is quoted in another. Dividing the former by the latter would produce a meaningless result because it’s a case of apples and oranges. To calculate the yield properly, you must express the dividend and share price in the same currency.

Performance of ‘The List’

Feel free to click on this link, ‘The List’ for a sortable version from our website.

Last week, ‘The List’ was up with a YTD price return of +0.8% (capital). Dividend growth remained the same and is now at +8.8% YTD, highlighting income growth this year.

The best performers last week on ‘The List’ were Brookfield Infrastructure Partners (BIP-N), up +26.41%; Algonquin Power & Utilities (AQN-N), up +14.31%; and Magna (MGA-N), up +12.30%.

Franco Nevada (FNV-N) was the worst performer last week, down -9.30%.


Dividend Increases

“The growth of dividend paying ability is of significance in the determination of a stock’s quality, or general safety…”

– Arnold Bernhard (the founder of Value Line)

“As a dividend increase is a positive sign of a company’s financial strength, the safest purchase, after research, is a stock with a recent dividend increase.”

– Tom Connolly (the founder of dividendgrowth.ca)

One company on ‘The List’ announced a dividend increase last week.

Telus (T-T) on Friday said it increased its 2024 quarterly dividend from $0.3636 to $0.3761 per share, payable January 02, 2024, to shareholders of record on December 11, 2023.

This represents a dividend increase of +3.40%, marking the 20th straight year of dividend growth for this quality telco.


Earnings Releases

Benjamin Graham once remarked that earnings are the principal factor driving stock prices.

Each quarter, we will provide readers with weekly earnings updates of stocks on ‘The List’ during the calendar earnings season. 

The updated earnings calendar can be found here.

Earnings growth and dividend growth tend to go hand in hand, so this information can tell us a lot about the future dividend growth of our quality companies. Monitoring our dividend growers periodically is part of the process, and reading the quarterly earnings releases is a good place to start.

Nine earnings reports from companies on ‘The List’ this week

Stella-Jones Inc. (SJ-T) will release its third-quarter fiscal 2023 results on Tuesday, November 07, 2023, before markets open.

Intact Financial (IFC-T) will release its third-quarter fiscal 2023 results on Tuesday, November 07, 2023, after markets close.

TC Energy (TRP-T) will release its third-quarter fiscal 2023 results on Wednesday, November 08, 2023, before markets open.

CCL Industries (CCL-B-T) will release its third-quarter fiscal 2023 results on Wednesday, November 08, 2023, after markets close.

Franco Nevada (FNV-N) will release its third-quarter fiscal 2023 results on Wednesday, November 08, 2023, after markets close.

Canadian Tire (CTC-A-T) will release its third-quarter fiscal 2023 results on Thursday, November 09, 2023, before markets open.

Stantec (STN-T) will release its third-quarter fiscal 2023 results on Thursday, November 09, 2023, after markets close.

Emera Inc. (EMA-T) will release its third-quarter fiscal 2023 results on Friday, November 10, 2023, before markets open.

Algonquin Power & Utilities (AQN-N) will release its third-quarter fiscal 2023 results on Friday, November 10, 2023, before markets open.

Last week, six earnings reports from companies on ‘The List’.

Toromont Industries (TIH-T) released its third-quarter fiscal 2023 results on Monday, October 30, 2023, after markets closed.

“We are pleased with the operating and financial performance through the first nine months of the year. The Equipment Group executed well, delivering against the opening order backlog in line with customer schedules and improvement in inventory flow, coupled with good growth in rental and product support activity, as well as a continued focus on expense control. CIMCO revenue and bottom line improved in the quarter on good execution and higher product support activity. Across the organization, we continue to navigate through uncertain economic conditions and remain committed to our operating disciplines, driving our after-market strategies and delivering customer solutions.”

– Michael S. McMillan, President and Chief Executive Officer

Highlights:

  • Revenue increased $87.5 million or 8% in the third quarter compared to the similar period last year, with higher revenues in both groups. Equipment Group was up 7% in the quarter on higher equipment sales (up 7%), product support revenues (up 7%) and rental activity (up 11%). CIMCO revenue increased 15%, with progress on package sales (up 2%) and strong product support growth (up 29%).
  • Revenue increased $408.5 million (14%) to $3.4 billion for the year-to-date period. Revenue increased in both groups, with the Equipment Group up 13% and CIMCO up 17% year-to-date, on similar trends as noted for the quarter.
  • Operating income increased 17% in the quarter reflecting the higher revenue and gross margins, along with the lower relative expense ratio. Operating income as a percentage of sales increased to 16.4% from 15.3% in the prior year.
  • Operating income increased 22% in the year-to-date period, and was 14.7% of revenue compared to 13.7% in the similar period last year, reflecting similar trends as noted for the quarter
  • Net earnings from continuing operations increased $25.1 million or 21% in the quarter versus a year ago to $145.6 million or $1.77 EPS (basic) and $1.76 EPS (fully diluted).
  • For the year-to-date period, net earnings from continuing operations increased $83.2 million or 29% to $375.1 million, or $4.56 EPS (basic) and $4.52 EPS (fully diluted).
  • Bookings for the third quarter decreased 5% compared to last year and increased 5% on a year-to-date basis. The Equipment Group reported lower bookings during the quarter (down 10%), after a strong start to the year and given the uncertain economic conditions. CIMCO reported increased bookings (up 18%) on good demand for our products and services. Year-to-date both groups reported increased bookings, with the Equipment Group up 4% and CIMCO up 17%.
  • Backlog was $1.2 billion as at September 30, 2023, compared to $1.4 billion as at September 30, 2022, reflecting good order intake, progress on construction and delivery schedules as well as some improvement in equipment flow through the supply chain.

Outlook:

We are mindful of the uncertain economic environment and continue to monitor key metrics and supply‑dynamics,” continued Mr. McMillan. “We have seen some softening in demand for equipment in construction markets after a period of strong growth. We will continue to follow our disciplined approach, working our operational model while delivering results for our customers, suppliers and employees. While focused on managing discretionary spend, we continue to recruit technicians, to support our critical after-market service strategies and value‑added product offering over the long term.

Source: (TIH-T) Q3-2023 Quarterly Review


Brookfield Infrastructure Partners (BIP-N) released its third-quarter fiscal 2023 results on Wednesday, November 1, 2023, before markets opened.

“We had strong financial results and delivered on all of our strategic initiatives to date in 2023. We have demonstrated our ability to use our size, scale and diversification to continue recycling capital at good valuations, while investing at higher returns on our new investments.”

– Sam Pollock, CEO

Highlights:

  • Brookfield Infrastructure reported net income of $104 million for the three-month period ended September 30, 2023 compared to $113 million in the prior year. Current year results benefited from the contribution associated with recently completed acquisitions and organic growth across our base business. These positive impacts were partially offset by higher borrowing costs associated with the financing of growth initiatives and lower gains on currency and commodity contracts than in the same period last year.
  • Funds from operations (FFO) in the quarter was $560 million, a 7% increase compared with the same period last year. Results benefited from strong base business performance reflecting higher tariffs and the commissioning of approximately $1 billion of capital projects in the past 12 months. Our financial results do not reflect the benefit of new investments this year and we are conversely impacted by nearly $2 billion of asset sales that primarily closed in the second quarter of 2023. The fourth quarter will fully reflect the contributions of our new investments, which closed right before, or subsequent to, September 30.

Outlook:

The market backdrop has created a strong environment for capital deployment, with returns on new investments expected to be well in excess of our 12-15% target. Our 2023 deployment is expected to provide us with some of the best risk-adjusted returns we have seen in the last decade.

Source: (BIP-N) Q3-2023 Quarterly Review


Bell Canada (BCE-T) released its third-quarter fiscal 2023 results on Thursday, November 2, 2023, before markets opened.

“The Bell team has demonstrated continued operational excellence, delivering results that place us in a solid position as we look ahead to the end of the year.”

– Mirko Bibic, President and CEO

Highlights:

  • 1% consolidated adjusted EBITDA growth delivered 0.9 percentage-point increase in adjusted EBITDA margin2 to 43.9% — best quarterly result since Q2 2022
  • Net earnings of $707 million down 8.3% with net earnings attributable to common shareholders of $640 million, down 10.5% or $0.70 per common share; adjusted net earnings of $741 million yielded adjusted EPS1 of $0.81, down 8.0% reflecting higher interest expense, increased depreciation and amortization and higher income taxes
  • Cash flows from operating activities down 1.8% to $1,961 million; stronger Q3 free cash flow growth trajectory as profiled in 2023 quarterly budget, increasing 17.4% to $754 million on strong adjusted EBITDA flow-through and lower capital expenditures
  • Strong wireless performance with 231,212 total mobile phone and connected device net subscriber activations3 — second-best ever quarterly result; 3.9% wireless service revenue growth as blended average revenue per user remains essentially stable in a competitive market
  • Record quarter for fibre Internet net activations of 104,159, up 7.9%, driving total retail Internet net activations of 79,327 and 6.1% residential Internet revenue growth; on track to achieve 85% planned broadband buildout target by year end
  • Bell Media adjusted EBITDA up 11.5% on lower operating costs and restructuring initiatives as total revenue declined 1.3% due to ongoing advertising recession; digital revenue5 up 26% as digital platforms and advertising technology drive digital advertising market share growth
  • Reconfirming all 2023 financial guidance targets

Outlook:

Source: (BCE-T) Q3-2023 Quarterly Review


Telus (T-T) released its third-quarter fiscal 2023 results on Friday, November 3, 2023, before markets opened.

“For the third quarter, our TELUS team once again demonstrated execution strength in our TTech business segment, characterized by the potent combination of leading customer growth, complemented by strong operational and financial results, alongside improving EBITDA growth and margin expansion in our DLCX segment.”

– Darren Entwistle, President and CEO

Highlights:

  • Total telecom customer growth of 406,000, up 59,000 over last year, an all-time quarterly record, driven by strong customer demand for our leading portfolio of bundled services across Mobility and Fixed
  • Mobile Phone net additions of 160,000, our best third quarter on record, and a record setting quarter for Connected Device net additions of 179,000
  • Robust third quarter Fixed customer net additions of 67,000, including 37,000 internet customer additions, powered by leading customer loyalty in combination with TELUS’ PureFibre network
  • Consolidated Operating Revenue and Adjusted EBITDA growth of 7.2 per cent and 5.5 per cent, respectively, and Free Cash Flow growth of 7.3 per cent; Net Income lower by 75 per cent on higher efficiency-related restructuring and other costs, higher depreciation, amortization and financing costs; Adjusted Net Income down 21 per cent
  • Quarterly dividend increased to $0.3761, up 7.1 per cent over the same period last year, representing a dividend yield of approximately 6.5 per cent
  • Reconfirming our 2023 Consolidated Financial Targets

Outlook:

Source: (T-T) Q3-2023 Quarterly Review


Enbridge Inc. (ENB-T) released its third-quarter fiscal 2023 results on Friday, November 3, 2023, before markets opened.

“Despite ongoing market volatility, Enbridge’s four businesses delivered another solid quarter of financial performance. We saw high utilization across our systems delivering reliable, affordable, and sustainable energy for our customers while upholding industry leading safety standards. We’re tracking to plan and expect to achieve our 2023 EBITDA and DCF per share guidance for the 18th consecutive year.”

– Greg Ebel, President and CEO

Highlights:

  • Third quarter GAAP earnings of $0.5 billion or $0.26 per common share, compared with GAAP earnings of $1.3 billion or $0.63 per common share in 2022
  • Adjusted earnings of $1.3 billion or $0.62 per common share, compared with $1.4 billion or $0.67 per common share in 2022
  • Adjusted earnings before interest, income taxes and depreciation and amortization (EBITDA) of $3.9 billion, an increase of 3%, compared with $3.8 billion in 2022
  • Cash provided by operating activities of $3.1 billion, compared with $2.1 billion in 2022
  • Distributable cash flow (DCF) of $2.6 billion, an increase of $0.1 billion, compared with $2.5 billion in 2022
  • Reaffirmed 2023 full year financial guidance for EBITDA and DCF inclusive of the recent share offering dilution
  • Enbridge entered into definitive agreements (the “Acquisitions”) with Dominion Energy, Inc. (“Dominion”) to acquire The East Ohio Gas Company, Questar Gas Company and its related Wexpro companies, and Public Service Company of North Carolina, Incorporated for an aggregate purchase price of US$14 billion (CDN$19 billion)
  • Enbridge has filed applications for all key federal and state required regulatory approvals to complete the pending Acquisitions and approximately 75% of the financing for the aggregate purchase price has been secured
  • Signed an agreement to increase ownership in Hohe See Offshore Wind Farm and Albatros Offshore Wind Farm by a further 24.45%, bringing Enbridge’s interest to 49.89%, for €625 million (including €358 million of assumed debt)
  • Signed a definitive agreement to acquire seven operating landfill-to-renewable natural gas (RNG) assets located in Texas and Arkansas for US$1.2 billion with staggered consideration
  • Upsized and relaunched the Flanagan South Pipeline (FSP) binding open season for US Gulf Coast delivery service
  • Closed the acquisition of Aitken Creek Gas Storage on November 1
  • Debt-to-EBITDA expected to exit the year below the target range of 4.5x to 5.0x reflecting substantial equity pre-funding prior to closing the Acquisitions

Outlook:

The Company reaffirms its 2023 financial guidance for EBITDA and DCF. Results for the first nine months of 2023 are in line with the Company’s expectations and the Company anticipates that its businesses will continue to experience strong capacity utilization and operating performance through the balance of the year with normal course seasonality. Strong operational performance in the first nine months of the year is expected to be offset by higher financing costs, due to increased interest rates, pre-funding of the U.S. gas utilities acquisitions and a lower toll on the Mainline.

Source: (ENB-T) Q3-2023 Quarterly Review


Magna (MGA-N) released its third-quarter fiscal 2023 results on Friday, November 3, 2023, before markets opened.

“We continue to execute across all segments of our business through a combination of launching new programs, working to offset inflationary pressures, reducing expenses, and optimizing our cost structure. Our raised Outlook reflects our relentless focus on delivering short- and long-term margin expansion and increased returns on investment.”

– Swamy Kotagiri, Magna’s Chief Executive Officer

Highlights:

  • Sales increased 15% to $10.7 billion, compared to a global light vehicle production increase of 4%
  • Diluted earnings per share were $1.37
  • Adjusted diluted earnings per share increased 33% to $1.46
  • Raised Outlook for Adjusted EBIT Margin and Adjusted Net Income attributable to Magna, including UAW strike impact

Outlook:

We buy quality individual dividend growth stocks when they are sensibly priced and hold for the growing income.