Last updated by BM on November 20, 2023
Summary
- This is a weekly installment of our MP Market Review series, which provides updates on the financial markets and Canadian dividend growth companies we monitor on ‘The List’.
- Last week, ‘The List’ was up with a YTD price return of +3.2% (capital). Dividends have increased by +8.8% YTD, highlighting the growth in the dividend (income).
- Last week, no dividend announcements from companies on ‘The List’.
- Last week, two earnings reports from companies on ‘The List’.
- No companies on ‘The List’ are due to report earnings this week.
The List (2023)
Last updated by BM on November 17, 2023
The Magic Pants List contains 27 Canadian dividend growth stocks. ‘The List’ contains Canadian companies that have raised their dividend yearly for at least the last ten years and have a market cap of over a billion dollars. Below is each stock’s symbol, name, current yield, current price, price return year-to-date, current dividend, dividend growth year-to-date and current dividend growth streak. Companies on ‘The List’ are added or subtracted once a year, on January 1. After that, ‘The List’ is set for the next twelve months. Prices and dividends are updated weekly.
While ‘The List’ does not function as a portfolio on its own, it serves as an excellent initial reference for individuals looking to diversify their investments and achieve higher returns in the Canadian stock market. Through our blog, we provide weekly updates on ‘The List’ and offer valuable perspectives along with real-life examples of our dividend growth investing (DGI) strategy in action. This aids readers in gaining a deeper understanding of how to implement and benefit from this investment approach.
If you’re interested in creating your own dividend growth income portfolio, consider subscribing to our premium service. Subscribers gain access to buy/sell alerts for our MP Wealth-Builder Model Portfolio (CDN) and exclusive content available only to subscribers.
Performance of ‘The List’
Last week, ‘The List’ was up with a YTD price return of +3.2% (capital). Dividends have increased by +8.8% YTD, highlighting the growth in the dividend (income).
The best performers last week on ‘The List’ were CCL Industries (CCL-B-T), up +8.01%; Brookfield Infrastructure Partners (BIP-N), up +7.17%; and Magna (MGA-N), up +6.48%.
Metro (MRU-T) was the worst performer last week, down -5.86%.
| SYMBOL | COMPANY | YLD | PRICE | YTD % | DIV | YTD % | STREAK |
|---|---|---|---|---|---|---|---|
| AQN-N | Algonquin Power & Utilities | 8.5% | $5.97 | -11.3% | $0.51 | -29.0% | 12 |
| ATD-T | Alimentation Couche-Tard Inc. | 0.7% | $78.24 | 30.1% | $0.56 | 19.1% | 13 |
| BCE-T | Bell Canada | 7.1% | $54.19 | -10.0% | $3.87 | 5.2% | 14 |
| BIP-N | Brookfield Infrastructure Partners | 4.4% | $27.36 | -12.6% | $1.44 | 6.3% | 15 |
| CCL-B-T | CCL Industries | 1.8% | $58.28 | 0.4% | $1.06 | 10.4% | 21 |
| CNR-T | Canadian National Railway | 2.0% | $158.14 | -2.9% | $3.16 | 7.8% | 27 |
| CTC-A-T | Canadian Tire | 4.7% | $147.82 | 0.8% | $6.90 | 17.9% | 12 |
| CU-T | Canadian Utilities Limited | 5.7% | $31.28 | -15.3% | $1.79 | 1.0% | 51 |
| DOL-T | Dollarama Inc. | 0.3% | $98.57 | 23.4% | $0.27 | 23.8% | 12 |
| EMA-T | Emera | 5.7% | $49.09 | -6.7% | $2.82 | 5.0% | 16 |
| ENB-T | Enbridge Inc. | 7.7% | $46.22 | -13.3% | $3.55 | 3.2% | 27 |
| ENGH-T | Enghouse Systems Limited | 2.5% | $33.59 | -5.9% | $0.85 | 18.2% | 16 |
| FNV-N | Franco Nevada | 1.1% | $120.42 | -12.8% | $1.36 | 6.3% | 15 |
| FTS-T | Fortis Inc. | 4.0% | $56.46 | 2.0% | $2.29 | 5.3% | 49 |
| IFC-T | Intact Financial | 2.1% | $209.04 | 6.8% | $4.40 | 10.0% | 18 |
| L-T | Loblaws | 1.4% | $121.76 | 1.2% | $1.74 | 13.2% | 11 |
| MGA-N | Magna | 3.3% | $56.03 | -2.6% | $1.84 | 2.2% | 13 |
| MRU-T | Metro | 1.7% | $70.16 | -7.0% | $1.21 | 10.0% | 28 |
| RY-T | Royal Bank of Canada | 4.4% | $120.49 | -5.9% | $5.34 | 7.7% | 12 |
| SJ-T | Stella-Jones Inc. | 1.1% | $81.82 | 65.0% | $0.92 | 15.0% | 18 |
| STN-T | Stantec Inc. | 0.8% | $96.44 | 47.6% | $0.77 | 8.5% | 11 |
| TD-T | TD Bank | 4.5% | $84.78 | -3.3% | $3.84 | 7.9% | 12 |
| TFII-N | TFI International | 1.2% | $113.14 | 13.0% | $1.40 | 29.6% | 12 |
| TIH-T | Toromont Industries | 1.5% | $113.73 | 16.4% | $1.68 | 10.5% | 33 |
| TRP-T | TC Energy Corp. | 7.3% | $50.34 | -5.6% | $3.69 | 3.4% | 22 |
| T-T | Telus Corp. | 5.9% | $24.22 | -8.0% | $1.43 | 7.4% | 19 |
| WCN-N | Waste Connections | 0.8% | $134.84 | 2.4% | $1.05 | 10.5% | 13 |
| Averages | 3.4% | 3.2% | 8.8% | 19 |
Six Canadian stocks on ‘The List’ declare earnings and dividends in US dollars and are inter-listed on a US exchange in US dollars. The simplest way to display dividend and price metrics for these stocks is to show their US exchange symbols along with their US dividends and price. The stocks I am referring to have a -N at the end of their symbols. You can still buy their Canadian counterparts (-T), but your dividends will be converted into CDN dollars and will fluctuate based on the exchange rate.
Note: When the dividend and share price currency match, the calculation is straightforward. But it’s not so simple when the dividend is declared in one currency, and the share price is quoted in another. Dividing the former by the latter would produce a meaningless result because it’s a case of apples and oranges. To calculate the yield properly, you must express the dividend and share price in the same currency.
DGI Clipboard
“Compare the compound annual growth rate (CAGR) of a firm’s dividend with its price after a few years. They should be similar: if not, do not buy, or if you own it, winnow it.”
– Tom Connolly (the founder of dividendgrowth.ca)
Dividend Growth and Price Growth Alignment
Many of our good dividend growers on ‘The List’ follow this pattern.
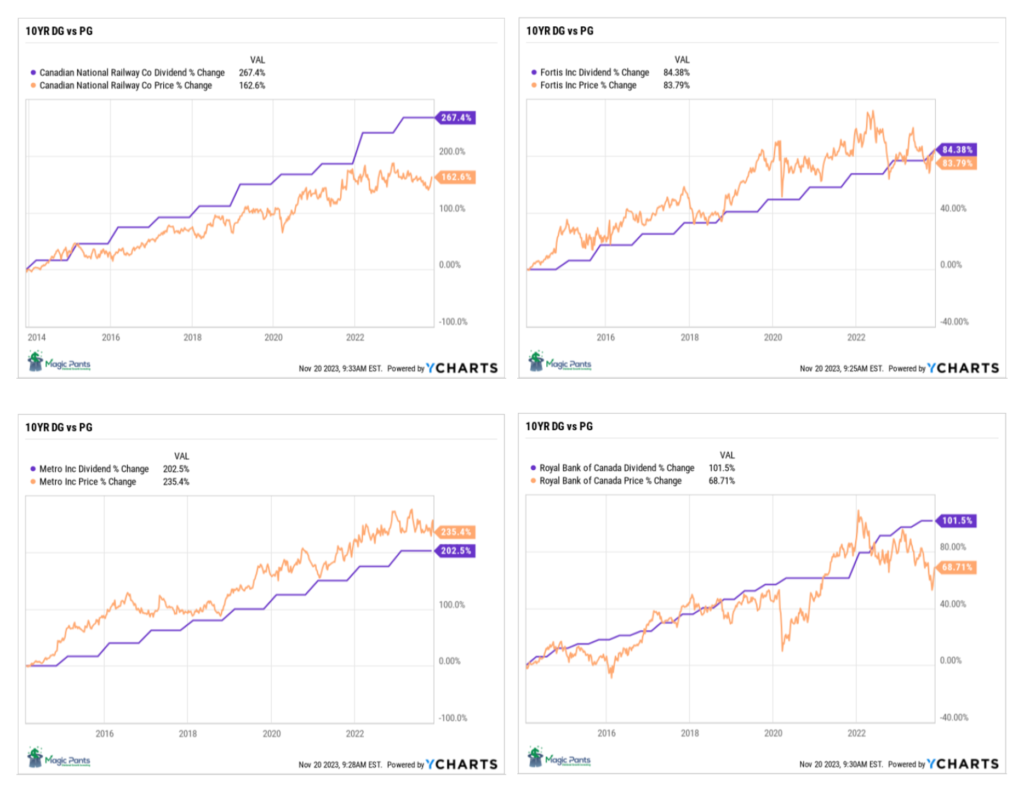
Similar to real estate investing, stocks that generate long-term income for their owners tend to become more valuable. The primary source of income for stock investors is often through dividend payments. Beyond short-term market cycles, the value of dividend growth investing (DGI) stocks is closely tied to the income they generate for their owners.
As dividends increase, so does the stock price. Don’t be overly concerned about price volatility if the dividend is growing. Hold onto the investment for the increasing income and the potential for future price gains. Recognize that the capital is growing in tandem with income, eventually.
This is where portfolio control comes into play. Many investors view the stock market as an enigmatic force, feeling subject to the whims of market returns. However, by linking the value of your stocks to the income they produce and focusing on building that income, you’re likely to witness price appreciation as well.
Building a portfolio consisting of stocks that have historically followed this pattern—consistently growing their dividends at a predetermined rate—enables dividend growth investors to predict future returns more reliably.
As a bonus, a growing yield not only provides added income but also enhances the security of our underlying investment.
If you have not yet joined as a paid subscriber of the blog to receive DGI Alerts on the activity and content related to our model portfolio, it’s not too late. Click Here.
Recent News
Don’t throw out Brookfield Infrastructure with the market bath water (Globe & Mail)
“As unpleasant as that’s been, there’s nothing inherently wrong with Brookfield Infrastructure’s businesses. The chief problem is rising interest rates.”
Brookfield Infrastructure saw a nice bounce back in its stock price last week and seems to have some life after the optimistic outlook from management in its Q3 earnings report, earlier in the month.
Investors in thematic funds hurt returns by trading too frequently: Morningstar
“Most investors would achieve better investment outcomes by adopting a more patient buy-and-hold approach,” said the analysts.
One of the things I like about our dividend growth investing strategy is our passive approach to investing. If the company, we have on our list does not reach a ‘sensible price’ we don’t buy. If it doesn’t get severely overvalued, we don’t sell. Most of the time we do nothing and collect our growing income. Frequent trading does not bode well for the average investor over the long term.
To receive breaking news about companies on ‘The List’, follow us on Twitter @MagicPants_DGI.
Dividend Increases
“The growth of dividend paying ability is of significance in the determination of a stock’s quality, or general safety…”
– Arnold Bernhard (the founder of Value Line)
No companies on ‘The List’ announced a dividend increase last week.
Earnings Releases
Benjamin Graham once remarked that earnings are the principal factor driving stock prices.
Each quarter, we will provide readers with weekly earnings updates of stocks on ‘The List’ during the calendar earnings season.
The updated earnings calendar can be found here.
Earnings growth and dividend growth tend to go hand in hand, so this information can tell us a lot about the future dividend growth of our quality companies. Monitoring our dividend growers periodically is part of the process, and reading the quarterly earnings releases is a good place to start.
No earnings reports from companies on ‘The List’ this week
Last week, two earnings reports from companies on ‘The List’.
Loblaw Companies Limited (L-T) released its third-quarter fiscal 2023 results on Wednesday, November 15, 2023, before markets opened.
“Our stores are delivering more value, including deeper discounts on essentials, and customers are responding positively. We remain focused on doing what we can to fight inflation and deliver lower prices for Canadians, while continuing to invest for the future.”
– Galen G. Weston, Chairman
Highlights:
- Revenue was $18,265 million, an increase of $877 million, or 5.0%.
- Retail segment sales were $17,982 million, an increase of $852 million, or 5.0%.
- Food Retail (Loblaw) same-stores sales increased by 4.5%.
- Drug Retail (Shoppers Drug Mart) same-store sales increased by 4.6%, with front store same-store sales growth of 1.8% and pharmacy same-store sales growth of 7.4%.
- E-commerce sales increased by 13.6%.
- Operating income was $1,065 million, an increase of $74 million, or 7.5%.
- Adjusted EBITDA was $1,926 million, an increase of $80 million, or 4.3%.
- Retail segment adjusted gross profit percentage was 30.6%, a decrease of 20 basis points.
- Net earnings available to common shareholders of the Company were $621 million, an increase of $65 million or 11.7%. Diluted net earnings per common share were $1.95, an increase of $0.26, or 15.4%.
- Adjusted net earnings available to common shareholders of the Company were $719 million, an increase of $56 million, or 8.4%.
- Adjusted diluted net earnings per common share were $2.26, an increase of $0.25 or 12.4%.
- Repurchased for cancellation 2.9 million common shares at a cost of $341 million and invested $676 million in capital expenditures, net of proceeds from property disposals. Free cash flow used in the Retail segment was $663 million.
Outlook:
Loblaw will continue to execute on retail excellence while advancing its growth initiatives in 2023. The Company’s businesses remain well placed to service the everyday needs of Canadians. However, the Company cannot predict the precise impacts of global economic uncertainties, including the inflationary environment, on its 2023 financial results.
For the full-year 2023, the Company continues to expect:
- its Retail business to grow earnings faster than sales;
- adjusted net earnings per common share growth in the low double digits;
- to increase investments in our store network and distribution centres by investing a net amount of $1.6 billion in capital expenditures, which reflects gross capital investments of approximately $2.1 billion offset by approximately $500 million of proceeds from real estate dispositions; and
- to return capital to shareholders by allocating a significant portion of free cash flow to share repurchases.
Source: (L-T) Q3-2023 Quarterly Review
Metro Inc. (MRU-T) released its fourth-quarter fiscal 2023 results on Wednesday, November 15, 2023, before markets opened.
“We are pleased with our fourth quarter results which were achieved in a challenging operating environment that included a 5-week strike at 27 Metro stores in Ontario. For the first time in our history, sales for the year exceeded $20 billion and net earnings reached $1 billion. Our sales momentum remains strong, driven by our discount banners and pharmacy. Food inflation declined steadily during the quarter and our teams continue to deliver the best value possible to our customers every day. We reached a key milestone in our supply chain modernization program with the start-up of our new state-of-the-art automated distribution center for fresh and frozen products north of Montreal. This facility will improve service to our stores and fuel our long-term growth.”
– Eric La Fleche, President and Chief Executive Officer
Highlights:
- 53-week fiscal year versus 52 weeks in 2022
- Sales of $20,724.6 million, up 9.7%
- Net earnings of $1,018.8 million, up 19.9%, and adjusted net earnings of $1,006.6 million, up 9.2%
- Fully diluted net earnings per share of $4.35, up 23.9%, and adjusted fully diluted net earnings per share of $4.30, up 12.6%
Outlook:
As we begin our new fiscal year, we are ramping up our new state-of-the-art, automated distribution center north of Montreal and the expansion of our Montreal produce facility as planned. We are also preparing for the launch of the final phase of our automated fresh facility in Toronto next spring. While these investments position us well for continued long-term profitable growth, we are facing significant headwinds in Fiscal 2024 as we incur some temporary duplication of costs and learning curve inefficiencies, as well as higher depreciation and lower capitalized interest. We will not fully absorb these additional expenses and we are currently forecasting operating income before depreciation and amortization and impairments of assets, net of reversals to grow by less than 2% in Fiscal 2024 versus the level reported in Fiscal 2023, and adjusted net earnings per share to be flat to down $0.10 in Fiscal 2024 versus the level reported in Fiscal 2023. We expect to resume our profit growth post Fiscal 2024 and are maintaining our publicly disclosed annual growth target of between 8% and 10% for net earnings per share over the medium and long term.
Source: (MRU-T) Q4-2023 Quarterly Review
