MP Market Review – April 28, 2023
Last updated by BM on May 01, 2023
Summary
- This is a weekly installment of our MP Market Review series, which provides updates on the financial markets and Canadian dividend growth companies we monitor on ‘The List’.
- Last week, ‘The List’ was down with a YTD price return of +7.4% (capital). Dividend growth remained the same and is now at +8.1% YTD, highlighting growth in income over the past year.
- Last week, no dividend increases from companies on ‘The List’.
- Last week, six earnings reports from companies on ‘The List’.
- Eight companies on ‘The List’ are due to report earnings this week.
- If you’re interested in creating your own dividend growth income portfolio, consider subscribing to our premium service, which grants you access to the MP Wealth-Builder Model Portfolio (CDN) and exclusive subscriber-only content. Learn More

Introduction
“You have a pair of pants. In the left pocket, you have $100. You take $1 out of the left pocket and put it in the right pocket. You now have $101. There is no diminution of dollars in your left pocket. That is one magic pair of pants.”
This ‘magic pants’ analogy was from a Seeking Alpha article on dividend investing I read about a decade ago and was one of the catalysts for me to take a closer look at this type of investing and see if it truly was magical.
After conducting additional research, I have shifted towards utilizing a dividend growth investing (DGI) strategy as my primary investment approach. While I maintain portfolios consisting of high-quality dividend growers from both the United States and Canada, I have opted to concentrate on Canadian (CDN) dividend growth companies in this blog. This is due to several reasons, including a smaller pool of DGI companies to track, a lack of coverage for the DGI strategy by the North American investment media, and a tendency for those who do cover DGI to narrowly focus on only a handful of sectors (Energy and Financials).
While ‘The List’ is not a portfolio in itself, it serves as an excellent initial reference for individuals seeking to diversify their investments and attain higher returns in the Canadian stock market. Through our blog, we provide weekly updates on ‘The List’ and offer valuable perspectives and real-life examples of the dividend growth investing strategy in practice. This helps readers gain a deeper understanding of how to implement and benefit from this investment approach.
DGI Thoughts
“Your ultimate success or failure will depend on your ability to ignore the worries of the world long enough to allow your investments to succeed. It isn’t the head, but the stomach that determines the fate of the stockpicker.”
– Peter Lynch
Last week, a subscriber asked about a storyline regarding a company that I had recently included in our model portfolio. Typically, we don’t give much weightage to such news. Nevertheless, this inquiry prompted me to contemplate why I no longer experience unease when I invest in a top-notch dividend growth stock that is priced reasonably. While I cannot assure that I have purchased at the rock-bottom price, I take solace in knowing that our approach and methodology, coupled with a long-term investment horizon, make it highly probable to attain a positive return.
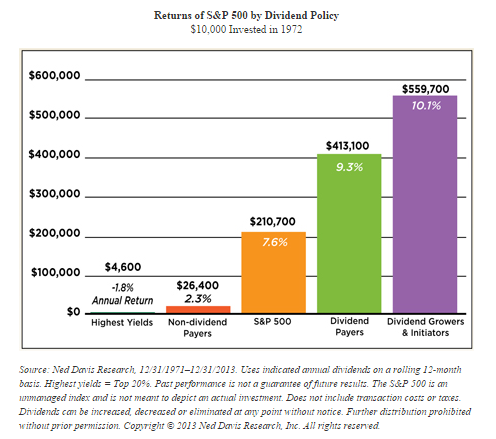
Here is a chart of U.S. Stock Market returns over the last 150 years over different holding periods.

In the long run, stocks have delivered strong returns. The longer you hold the higher the probability of a positive outcome. By building a concentrated portfolio of quality stocks that pay a growing dividend we do even better.
If you have not yet joined as a subscriber of the blog to receive DGI Alerts on the activity in our model portfolio, it’s not too late. Click Here.
Recent News
A lot of acquisition activity recently from companies on ‘The List’. We like acquisitions because they allow our quality dividend growers to increase earnings. Growing earnings translates into growing dividends. Growing dividends drives our stock prices higher.
TFI INTERNATIONAL ANNOUNCES TWO ACQUISITIONS
https://twitter.com/MagicPants_DGI/status/1653038464521183232?s=20
CCL INDUSTRIES ACQUIRING DATA MANAGEMENT INC.
https://twitter.com/MagicPants_DGI/status/1653018756119920647?s=20
ALIMENTATION COUCHE-TARD TO BUY RETAIL SITES FROM MAPCO EXPRESS
https://twitter.com/MagicPants_DGI/status/1653043466002219008?s=20
To receive breaking news about companies on ‘The List’ follow us on Twitter @MagicPants_DGI.
The List (2023)
Last updated by BM on April 28, 2023
The Magic Pants List contains 27 Canadian dividend growth stocks. ‘The List’ contains Canadian companies that have raised their dividend yearly for at least the last ten years and have a market cap of over a billion dollars. Below is each stock’s symbol, name, current yield, current price, price return year-to-date, current dividend, dividend growth year-to-date and current dividend growth streak. Companies on ‘The List’ are added or subtracted once a year, on January 1. After that, ‘The List’ is set for the next twelve months. Prices and dividends are updated weekly.
| SYMBOL | COMPANY | YLD | PRICE | YTD % | DIV | YTD % | STREAK |
|---|---|---|---|---|---|---|---|
| AQN-N | Algonquin Power & Utilities | 5.9% | $8.52 | 26.6% | $0.51 | -29.0% | 12 |
| ATD-T | Alimentation Couche-Tard Inc. | 0.8% | $67.62 | 12.4% | $0.56 | 19.1% | 13 |
| BCE-T | Bell Canada | 5.9% | $65.12 | 8.1% | $3.82 | 5.0% | 14 |
| BIP-N | Brookfield Infrastructure Partners | 4.4% | $34.83 | 5.2% | $1.44 | 6.3% | 15 |
| CCL-B-T | CCL Industries | 1.7% | $63.71 | 9.8% | $1.06 | 10.4% | 21 |
| CNR-T | Canadian National Railway | 2.0% | $161.50 | -0.8% | $3.16 | 7.8% | 27 |
| CTC-A-T | Canadian Tire | 3.9% | $177.61 | 21.2% | $6.90 | 17.9% | 12 |
| CU-T | Canadian Utilities Limited | 4.6% | $39.17 | 6.0% | $1.79 | 1.0% | 51 |
| DOL-T | Dollarama Inc. | 0.3% | $83.92 | 5.1% | $0.27 | 23.8% | 12 |
| EMA-T | Emera | 4.8% | $57.65 | 9.6% | $2.76 | 3.0% | 16 |
| ENB-T | Enbridge Inc. | 6.6% | $53.87 | 1.0% | $3.55 | 3.2% | 27 |
| ENGH-T | Enghouse Systems Limited | 2.3% | $37.29 | 4.4% | $0.85 | 18.2% | 16 |
| FNV-N | Franco Nevada | 0.9% | $151.78 | 9.9% | $1.36 | 6.3% | 15 |
| FTS-T | Fortis | 3.8% | $59.49 | 7.5% | $2.26 | 4.1% | 49 |
| IFC-T | Intact Financial | 2.1% | $204.94 | 4.7% | $4.40 | 10.0% | 18 |
| L-T | Loblaws | 1.3% | $127.43 | 5.9% | $1.62 | 5.2% | 11 |
| MGA-N | Magna | 3.5% | $52.16 | -9.3% | $1.84 | 2.2% | 13 |
| MRU-T | Metro | 1.6% | $77.22 | 2.3% | $1.21 | 10.0% | 28 |
| RY-T | Royal Bank of Canada | 3.9% | $134.51 | 5.1% | $5.28 | 6.5% | 12 |
| SJ-T | Stella-Jones Inc. | 1.7% | $53.02 | 6.9% | $0.92 | 15.0% | 18 |
| STN-T | Stantec Inc. | 0.9% | $81.44 | 24.7% | $0.77 | 8.5% | 11 |
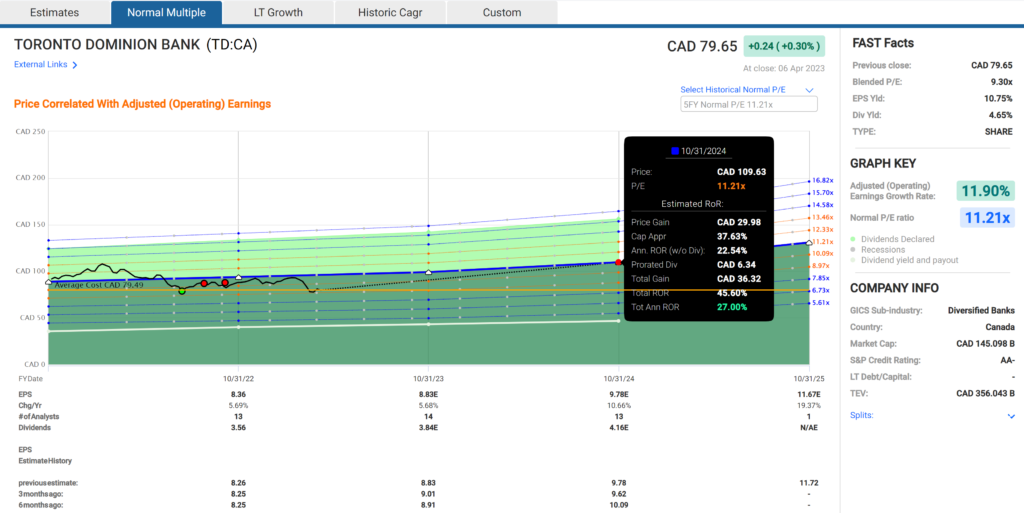
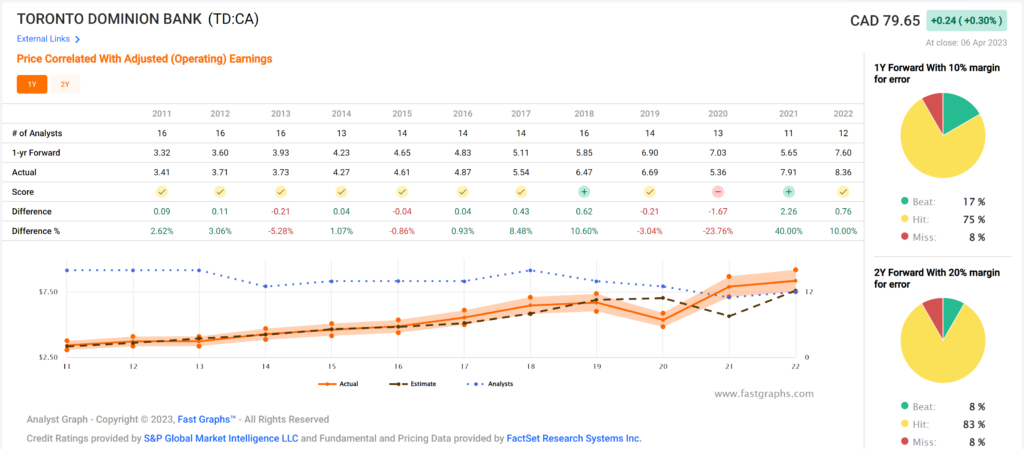
| TD-T | TD Bank | 4.7% | $82.07 | -6.4% | $3.84 | 7.9% | 12 |
| TFII-N | TFI International | 1.3% | $107.80 | 7.7% | $1.40 | 29.6% | 12 |
| TIH-T | Toromont Industries | 1.5% | $109.48 | 12.0% | $1.68 | 10.5% | 33 |
| TRP-T | TC Energy Corp. | 6.6% | $56.31 | 5.6% | $3.69 | 3.4% | 22 |
| T-T | Telus | 4.9% | $28.72 | 9.1% | $1.40 | 5.4% | 19 |
| WCN-N | Waste Connections | 0.7% | $139.15 | 5.6% | $1.02 | 7.9% | 13 |
| Averages | 3.1% | 7.4% | 8.1% | 19 |
Six Canadian stocks on ‘The List’ declare earnings and dividends in US dollars and are inter-listed on a US exchange in US dollars. The simplest way to display dividend and price metrics for these stocks is to show their US exchange symbols along with their US dividends and price. The stocks I am referring to have a -N at the end of their symbols. You can still buy their Canadian counterparts (-T), but your dividends will be converted into CDN dollars and will fluctuate based on the exchange rate.
Note: When the dividend and share price currency match, the calculation is straightforward. But it’s not so simple when the dividend is declared in one currency, and the share price is quoted in another. Dividing the former by the latter would produce a meaningless result because it’s a case of apples and oranges. To calculate the yield properly, you must express the dividend and share price in the same currency.
Performance of ‘The List’
Feel free to click on this link, ‘The List’ for a sortable version from our website.
Last week, ‘The List’ was down with a YTD price return of +7.4% (capital). Dividend growth remained the same and is now at +8.1% YTD, highlighting growth in income over the past year.
The best performers last week on ‘The List’ were Algonquin Power & Utilities (AQN-N), up +2.04%; Loblaws (L-T), up +2.02%; and Metro (MRU-T), up +1.23%.
TFI International (TFII-N) was the worst performer last week, down -9.5%.
Dividend Increases
“The growth of dividend paying ability is of significance in the determination of a stock’s quality, or general safety…”
– Arnold Bernhard (the founder of Value Line)
“As a dividend increase is a positive sign of a company’s financial strength, the safest purchase, after research, is a stock with a recent dividend increase.”
– Tom Connolly (the founder of dividendgrowth.ca)
Last week, no dividend increases from companies on ‘The List’.
Earnings Releases
Benjamin Graham once remarked that earnings are the principal factor driving stock prices.
Each quarter we will provide readers with weekly earnings updates of stocks on ‘The List’ during the calendar earnings season.
The updated earnings calendar can be found here.
Earnings growth and dividend growth tend to go hand in hand, so this information can tell us a lot about the future dividend growth of our quality companies. Monitoring our dividend growers periodically is part of the process, and reading the quarterly earnings releases is a good place to start.
Eight companies on ‘The List’ ares due to report earnings this week.
Q1 earnings season continues in a big way. Eight companies on ‘The List’ are due to report earnings this week.
Franco Nevada (FNV-N) will release its first-quarter fiscal 2023 results on Tuesday, May 2, 2023, after markets close.
Loblaws (L-T) will release its first-quarter fiscal 2023 results on Wednesday, May 3, 2023, before markets open.
Fortis (FTS-T) will release its first-quarter fiscal 2023 results on Wednesday, May 3, 2023, before markets open.
Brookfield Infrastructure Partners (BIP-N) will release its first-quarter fiscal 2023 results on Wednesday, May 3, 2023, before markets open.
Bell Canada (BCE-T) will release its first-quarter fiscal 2023 results on Thursday, May 4, 2023, before markets open.
Telus (T-T) will release its first-quarter fiscal 2023 results on Thursday, May 4, 2023, before markets open.
Enbridge Inc. (ENB-T) will release its first-quarter fiscal 2023 results on Friday, May 5, 2023, before markets open.
Magna (MGA-N) will release its first-quarter fiscal 2023 results on Friday, May 5, 2023, before markets open.
Last week, six earnings report from companies on ‘The List’.
Canadian National Railway (CNR-T) released its first-quarter fiscal 2023 results on Monday, April 24, 2023, after markets closed.
“We are very proud of our performance this quarter. Safety is at the heart of everything we do and I’m particularly proud of our safety performance. We remain confident in our long-term growth despite current economic uncertainty. Our updated guidance reflects the strength of our scheduled operating model and its ability to drive strong operational results. For the immediate future, we remain focused on running our plan and providing reliable service to our customers.”
– President and Chief Executive Officer, Tracy Robinson
Highlights:
- Record first quarter Revenues of C$4,313 million, an increase of C$605 million, or 16%.
- Record first quarter Operating income of C$1,662 million, an increase of C$435 million, or 35%.
- Operating ratio, defined as operating expenses as a percentage of revenues, of 61.5%, an improvement of 5.4- points, or an improvement of 5.1-points on an adjusted basis.
- Record first quarter Diluted EPS of C$1.82, an increase of 39%, or an increase of 38% on an adjusted basis.
- Free cash flow of C$593 million, an increase of 4%.
Outlook:
In light of the strength of its first quarter results, CN is now expecting to deliver adjusted diluted EPS growth in the mid single digits over 2022 (compared to its January 24, 2023 target of low single digits).
Source: (CNR-T) Q1-2023 Quarterly Review
TFI International (TFII-N) release its first-quarter fiscal 2023 results on Tuesday, April 25, 2023, after markets closed.
“We generated 69% growth in net cash from operating activities and our free cash flow more than doubled over the past year even as intensifying macro headwinds drove reduced volumes, and despite unfavorable FX fluctuations and the sale of CFI assets last summer,” said Alain Bédard, Chairman, President and Chief Executive Officer. “During the quarter we remained active with our many self-help initiatives, including cost reductions through a streamlining of our workforce and the conversion of accounting and finance systems at TForce Freight. At the same time, the many talented individuals of TFI continue to push ahead every day and deliver results through adherence to our operating principles that capitalize on our business line diversity and favorable niche market positioning. We also continue to allocate capital in the interest of enhancing long-term shareholder value. TFI has remained active with opportunistic M&A, completing five acquisitions year to date, each strategically expanding our geographic reach and capabilities. Also during the quarter, our Board of Directors approved our dividend, 30% higher than a year earlier, reflecting our confidence in the long-term outlook for TFI International even as economic uncertainty persists.”
– President and Chief Executive Officer, Alain Bedard
Highlights:
- First quarter operating income of $166.4 million compares to $219.8 million the same quarter last year, primarily reflecting reduced freight volumes, non-recurring costs of $21.1 million, including $9.5 million in severance and early retirement buyouts in US LTL, $7.9 million of IT systems and related transition expenses in US LTL and $3.7 million of mark-to-market expense related to deferred share units (“DSUs”). In addition to these items, the results were also impacted by $6.2 million unfavorable currency translation impact relative to the same period last year and $17.4 million from the divestiture of CFI, from which the proceeds largely remain to be invested.
- Net income of $111.9 million compares to $147.7 million in Q1 2022. Diluted earnings per share (diluted “EPS”) of $1.27 compares to $1.57 in Q1 2022, due in part to the costs discussed above.
- Adjusted net income , a non-IFRS measure, of $116.5 million compares to $157.6 million in Q1 2022, due in part to the costs discussed above.
- Adjusted diluted EPS , a non-IFRS measure, of $1.33 compares to $1.68 in Q1 2022, due in part to the costs discussed above.
- Net cash from operating activities of $232.1 million increased 69% compared to $137.7 million in Q1 2022, the increase being driven primarily by favorable movements in working capital.
- Free cash flow , a non-IFRS measure, of $195.7 million increased 113% compared to $91.8 million in Q1 2022, with the increase again primarily driven by favorable movements in working capital.
- The Company’s reportable segments performed as follows:
- Package and Courier operating income increased 5% to $27.3 million;
- Less-Than-Truckload operating income decreased 39% to $57.9 million, driven primarily by weaker volume and the non-recurring items listed above;
- Truckload operating income decreased 1% to $70.5 million, even though the comparative period includes $17.4 million contribution from the divested operations of CFI; and
- Logistics operating income decreased 9% to $31.7 million.
- On March 15, 2023, the Board of Directors of TFI declared a quarterly dividend of $0.35 per share paid on April 17, 2023, a 30% increase over the quarterly dividend of $0.27 per share declared in Q1 2022. The annualized dividend represents 12.3% of the trailing twelve month free cash flow .
- During the quarter, TFI International acquired selected assets of Stallion Express, LLC, D.M. Breton Inc. which will operate in the TL segment, the Axsun Group which will operate in the logistics segment, and Hot-Line Freight Inc which will operate in the less-than-truckload segment. Subsequent to quarter end TFI International completed the acquisition of SM Freight which will operate in the TL segment.
Outlook:
The North American economic growth forecast from leading economists remains subdued due to a variety of factors including elevated interest rates, high inflation, early signs of weakness in labor markets, global supply chain challenges, and slower growth in many international markets. TFI International’s diversity across industrial and consumer end markets and across many modes of transportation, along with the Company’s disciplined approach to operations, helped support results during the first quarter, but macro conditions have slowed and the possibility of economic recession over the coming year remains.
TFI International remains vigilant in its monitoring for new potential risks that could cause further economic disruption, resulting in additional rounds of declining freight volumes and higher costs that could adversely affect TFI’s operating companies and the markets they serve. Lower diesel prices in the months ahead are likely to cause a headwind. Other uncertainties include but are not limited to geopolitical risk such as the ongoing war in Ukraine, weakening labor market conditions that can affect consumer demand, policy changes surrounding international trade, environmental mandates, and changes to the tax code in any jurisdictions in which TFI International operates.
While North American economic weakness is likely to continue weighing on freight demand dynamics, management believes the Company is well positioned to navigate these difficult operating conditions, benefiting from its financial foundation and strong cash flow that allows for a strategic approach to the business. The Company strives for a lean cost structure and has a longstanding focus on profitability, efficiency, network density, customer service, optimal pricing, driver retention, and capacity rationalization. TFI also continues to have material synergy opportunities related to the 2021 acquisition of TForce Freight, and has opportunities to enhance performance within most of its other operations. Longer term, TFI’s diverse industrial exposure through its specialized TL and LTL segments should continue to benefit from a gradual shift toward domestic manufacturing, while its P&C and Logistics business segments should benefit over the long term from the expansion of e-commerce.
Regardless of the operating environment, management’s goal is to build shareholder value through consistent adherence to its operating principles, including customer focus, an asset-light approach, and continual efforts to enhance efficiencies. In addition, TFI International values free cash flow generation and strong liquidity with a conservative balance sheet that features a high portion of attractive fixed-rate spreads and limited near-term debt maturities. This strong financial footing allows the Company to prudently invest and pursue select, accretive acquisitions while returning excess capital to shareholders.
Source: (TFII-N) Q1-2023 Quarterly Report
Waste Connections (WCN-N) released its first-quarter fiscal 2023 results on Wednesday, April 26, 2023, after markets closed.
“Record solid waste pricing growth, strong operational execution and continuing acquisition activity in the first quarter provided a strong start to the year. Q1 was recognized to be a difficult year-over-year comparison given the precipitous decline in resource recovery values during the second half of 2022, and results in the period were further affected by weather-related impacts to solid waste roll-off activity and landfill volumes, particularly on the West Coast. Underlying adjusted EBITDA margins were in line with our expectations, but acquisitions completed since the year-ago period were 30 basis points dilutive to reported margins, or more than 20 basis points higher than expected, given the disproportionate weather-related impacts on West Coast acquisitions.”
– President and Chief Executive Officer, Ronald J. Mittelstaedt
Highlights:
- Price-led organic growth, strong operational execution, and continuing acquisition activity drive strong start to 2023
- Revenue of $1.901 billion, up 15.4%
- Net income of $197.8 million and adjusted EBITDA of $566.9 million
- Net income and adjusted net income of $0.77 and $0.89 per share, respectively
- Net cash provided by operating activities of $442.4 million and adjusted free cash flow of $274.0 million
- On track to achieve full year outlook as provided in February, with potential upside from any additional acquisitions, increases in recycled commodities and renewable fuels values, or reduction of inflationary pressures
Outlook:
“Continued visibility on pricing, improving trends in labor availability and retention, and recent normalization of weather patterns position us to deliver the full year outlook we provided in February. And as we also noted then, upside potential to this outlook remains from any additional acquisitions, increases in recycled commodities and renewable fuels values, or reduction of inflationary pressures. We’ve already closed approximately $45 million of acquired revenue year-to-date, and currently expect that pace of activity to continue throughout the year.”
– President and Chief Executive Officer, Ronald J. Mittelstaedt
Source: (WCN-N) Q1-2023 Earnings Release
Toromont Industries (TIH-T) released its first-quarter fiscal 2023 results on Thursday, April 27, 2023, after markets closed.
“We are pleased with the solid start to the year, buoyed in part by a solid opening order backlog. The Equipment Group executed well delivering on several large customer orders, as well as growing rental and product support results. CIMCO revenue improved in the quarter on project construction and higher product support activity. Across the organization, we remain committed to our operating disciplines, driving our after-market strategies and delivering customer solutions.”
– President and Chief Executive Officer, Scott J. Medhurst
Highlights:
- Revenue increased $201.1 million (23%) to $1.1 billion for the quarter. Revenue increased in both groups, with the Equipment Group up 24%, compared to last year on higher equipment sales (+33%), product support (+20%) and rental activity (+6%), while CIMCO was up 17% versus the first quarter last year, on higher package revenue (+29%) and product support activity levels (+8%).
- Operating income increased 48% in the quarter, and was 12% of revenue compared to 10% in the similar period last year, reflecting a lower relative expense ratio.
- During the quarter, a vacant property was sold for $7.4 million, resulting in an after-tax gain of $3.1 million ($0.04 per share basic).
- For the quarter, net earnings increased $36.5 million or 61% to $96.0 million, or $1.17 EPS (basic) and $1.16 EPS (fully diluted).
- Bookings decreased 33% compared to the similar period last year. Equipment Group booking decreased against a tough comparable which included several large orders, exacerbated by cautious market ordering during the uncertain economic environment. CIMCO bookings increased on solid demand for our products and services. A number of factors previously reported have impacted booking activity over the past several years, over-riding typical seasonality.
- Backlog was $1.2 billion as at March 31, 2023, compared to $1.5 billion as at March 31, 2022, reflecting progress on construction and delivery schedules as well as some improvement in general equipment flow through the supply chain.
Outlook:
- Expecting the business environment to gradually improve, however a number of factors are at play:
- Dynamics of the supply chain and improving availability
- Inflationary & macro-economic trends
- Balancing customer credit risk in light growth opportunities
- Our focus areas:
- Execute safely
- Serve and support our customer requirements
- Disciplined focus on building our business for the future (leverage operating model & managing risks)
- Backlogs remain well positioned, as bookings are shifting toward pre-pandemic levels – careful monitoring of customer buying patterns
- Technician hiring is a key priority, we made progress in 2022 and it remains an essential focus to support the growing customer demand for our products and services
- Operationally and Financially, we are well positioned with ample liquidity and our strong leadership teams, disciplined culture and focused operating models
Source: (TIH-T) Q1-2023 Earnings Release
Canadian Utilities Limited (CU-T) released its first-quarter fiscal 2023 results on Thursday, April 27, 2023, before markets opened.
“Overall, it was a great quarter that saw our newly acquired assets contribute to earnings in a meaningful way and our core businesses continue to deliver great performance during this key regulatory transition period.”
– Executive Vice President and Chief Financial Officer, Brian Shkrobot.
Highlights:
- Canadian Utilities achieved adjusted earnings of $217 million, or $0.81 per share, in the first quarter of 2023, compared to $219 million in the first quarter of last year.
- Invested $304 million in capital expenditures in the first quarter of 2023, of which 86 per cent was invested in regulated utilities and 14 per cent mainly in Energy Infrastructure.
- Closed the acquisition of the renewable generation portfolio on January 3, 2023. The 232-MW of operating Forty Mile and Adelaide wind assets have contributed revenues of $27 million for the three months ended March 31, 2023. Uprating work is currently underway for the Forty Mile wind assets with expected completion in the fourth quarter of 2023. This uprating is expected to increase Forty Mile Wind generation capacity from 202-MW to 225-MW.
- In 2023, the Electricity Distribution and Natural Gas Distribution businesses, following the conclusion of the second performance-based regulation (PBR) term, began a one-year cost-of service rebasing. The cost efficiencies generated over the second generation PBR term are now being passed along to customers, providing lower rates and creating long-term savings for Albertans. Following a one-year cost-of-service rebasing in 2023, these businesses will move to a third generation of performance-based regulation (PBR3) beginning in 2024.
Outlook:
“Overall, with our 2023 estimates remaining largely intact, including AFFO/sh at $3.56 (was $3.54) and D/EBITDA at 5.2x, our $37 target remains unchanged.”
– National Bank
Source: (CU-T) Q1-2023 Earnings Release
TC Energy (TRP-T) released its first-quarter fiscal 2023 results on Friday, April 28, 2023, before markets opened.
“First quarter 2023 results were underpinned by the strong demand for our assets and our ability to safely and reliably deliver essential energy services across North America. Comparable EBITDA was $2.8 billion, up 16 per cent compared to first quarter 2022, and segmented earnings were $2.2 billion compared to $1.2 billion in first quarter 2022. Comparable earnings per share for the quarter was $1.21, up eight per cent compared to $1.12 in first quarter 2022. Net income per common share was $1.29, up from $0.36 in first quarter 2022.
Over the winter construction season, the Coastal GasLink project progressed in line with our revised cost and schedule and is now approximately 87 per cent complete. The entire project route has been cleared, grading is approximately 99 per cent complete, welding is approximately 95 per cent complete and we continue to target mechanical completion in late 2023.”
– President and Chief Executive Officer, François Poirier
Highlights:
- First quarter 2023 results were underpinned by strong utilization and demand for our assets and services
- NGTL System total deliveries averaged 14.5 Bcf/d, up compared to first quarter 2022
- Throughput across U.S. Natural Gas Pipelines averaging 28.5 Bcf/d with several assets performing at near record levels during peak demand
- S. Natural Gas Pipelines achieved a new all-time record for deliveries to LNG export facilities
- Alberta cogeneration power plant fleet reached 100 per cent peak price availability in February
- Bruce Power achieved 95 per cent availability
- First quarter 2023 financial results:
- Net income attributable to common shares of $1.3 billion or $1.29 per common share compared to $0.4 billion or $0.36 per common share in first quarter 2022. Comparable earnings1 of $1.2 billion or $1.21 per common share compared to $1.1 billion or $1.12 per common share in 2022
- Segmented earnings of $2.2 billion compared to segmented earnings of $1.2 billion in 2022 and comparable EBITDA of $2.8 billion compared to $2.4 billion in 2022
- Dividend Reinvestment and Share Repurchase Plan (DRP) participation rate amongst common shareholders was approximately 38 per cent, resulting in $363 million reinvested in common equity from the dividends declared on February 13, 2023
- Continuing to advance our industry leading secured capital program, placing $1.4 billion of projects in service in first quarter 2023 and on track to place $6.0 billion in service during 2023
- Canadian Natural Gas Pipelines brought $1.1 billion of projects in service in first quarter 2023, enabling 700 MMcf/d of additional market access with an incremental 500 MMcf/d expected in second quarter 2023
- Placed Port Neches Link Pipeline System in service in March 2023 providing last mile connectivity to key demand markets
- Acquired 155 MW Fluvanna Wind Farm for US$99 million in cash, before post-closing adjustments in Scurry County, Texas. Entered into an agreement to acquire 148 MW Blue Cloud Wind Farm for US$125 million in cash, before post-closing adjustments in Bailey County, Texas. Closing of the Blue Cloud acquisition is pending regulatory approval
- Received FERC approval for ANR Section 4 Rate Case on April 11, 2023
- Bruce Power Unit 3 removed from service March 1, 2023 to begin its Major Component Replacement (MCR) outage with return to service expected in 2026.
Outlook:
We reaffirm our 2023 comparable EBITDA growth outlook of five to seven per cent relative to 2022, while comparable earnings per common share is expected to be modestly higher than 2022, showcasing the resiliency and sustainability of our earnings and cash flows. In addition, we expect capital spending in 2023 to continue to be $11.5 to $12.0 billion. Our 2023 outlook reflects our commitment to driving long-term growth and value for our shareholders. Based on the confidence of our business and growth outlook, TC Energy’s Board of Directors declared a quarterly dividend of $0.93 per common share for the quarter ending June 30, 2023, equivalent to $3.72 per common share on an annualized basis. We expect to continue to grow the common share dividend at an annual rate of three to five per cent, enabling our shareholders to benefit from our growth and success in the coming years.
Source: (TRP-T) Q1-2023 Earnings Release