“You have a pair of pants. In the left pocket, you have $100. You take $1 out of the left pocket and put in the right pocket. You now have $101. There is no diminution of dollars in your left pocket. That is one magic pair of pants.”

Two Stocks from ‘The List’ Announce Double-Digit Dividend Increases

Posted by BM on October 29, 2021 

Q3 Earnings season is upon us and the stocks on ‘The List’ continue their stellar performance in 2021.

Waste Connections posts higher Q3 results, lifts full year revenue outlook, raises dividend 12.2%.

05:43 AM EDT, 10/28/2021 (MT Newswires) — Waste Connections (WCN) on Wednesday reported adjusted Q3 net income of $0.89 per share, compared with $0.72 per share a year ago.

Analysts polled by Capital IQ were expecting $0.84 per share.

Revenue totaled $1.60 billion, up from $1.39 billion a year earlier. The consensus estimate was for $1.57 billion.

The waste management company said it now expects 2021 revenue of approximately $6.11 billion, up from its prior projection of $5.98 billion. It expects net income of approximately $633 million and adjusted EBITDA and approximately $1.91 billion, up from its earlier outlook of $1.88 billion.

Waste Connections also announced that the board approved a 12.2% increase in the quarterly dividend to $0.23 per share, payable on Nov. 23 to shareholders of record on Nov. 9.

TFI International reports Q3 adjusted EPS of US $1.46, Hikes dividend by 17%, Announces NCIB

04:38 PM EDT, 10/28/2021 (MT Newswires) — TFI International (TFII.TO) reported (in US$) Q3 2021 net income from continuing operations of $132.8 million, or $1.40 per diluted share, compared with $83.1 million, or $0.90 per diluted share, for the year ago quarter. Operating income from continuing operations grew 65% to $192.8 million from $117 million the prior year period, primarily driven by business acquisitions.

The company reported adjusted income of $138.9 million, or $1.46 per adjusted diluted share. TFI International had recorded adjusted income of $87.4 million or $0.94 per adjusted diluted share for Q3 2020.

Total revenue for the quarter was $2.1 billion, versus $936.1 million for the previous corresponding quarter, a 124% YoY increase. Net of fuel surcharge, total revenue was $1.87 billion, compared with $867 million for the prior year period.

The company said record Q3 results and strong profitability were driven by all four business segments.

The Board approved a $0.27 per share quarterly dividend, a 17% increase over the previous quarterly dividend of $0.23 per share, effective as of the next regular payment, in January.

The TSX has also approved the renewal of TFI International’s normal course issuer bid. TFI International may purchase a maximum of 7 million common shares, representing 7.96% of its public float. The NCIB runs from Nov 2 to Nov 1, next year. Under TFI International’s last NCIB, which expired on Oct 13, the company repurchased 1.15 million common shares at a volume weighted average purchase price of C$98.40 per share.

“During the third quarter, TFI International further built upon this year’s achievements with robust cash flow and strong performance across all business segments, many of which are already surpassing pre-pandemic performance despite ongoing macro disruptions,” stated Alain Bedard, Chairman, President and Chief Executive Officer. “I’m particularly pleased that our strong performance comes at a time when the most compelling benefits from our pivotal acquisition of UPS Freight are still ahead, and yet firmly within grasp as the newly branded TForce Freight continues to exceed expectations under the TFI umbrella.”

When I was still working, I used to listen to the news station on my drive to work every morning. I knew I was going to have a good day when the business update came on and one of my good dividend growers announced a dividend increase. Not only was I getting closer to my retirement goal of replacing my salary with dividend income, I knew that my capital would eventually grow as well.

Waste Connections and TFI International have been two of the three top performers on ‘The List’ in 2021 and they don’t appear to be slowing down based on their recent earnings releases. In our Magic Pants Wealth-Builder portfolio, we were fortunate to enter a position with TFII.TO in September 2020 when the P/E was 13 (today it is 31) unfortunately we never got an opportunity with WCN.TO. The stock price has been on fire since 2015.

Position Sizing: It Matters!

Posted by BM on October 25, 2021 

In 2016 Michael J. Mauboussin wrote a paper titled ‘Thirty Years: Reflections on the Ten Attributes of Great Investors’. One of those attributes deals with position sizing.

Mauboussin writes, “success in investing has two parts: finding edge and fully taking advantage of it through proper position sizing. Almost all investment firms focus on edge, while position sizing generally gets much less attention.”

He uses the example of card counting in blackjack as means to finding an edge and incorporating a betting strategy that takes advantage of it when the cards are in your favor.

As dividend growth investors we already know what our ‘edge’ is…buying quality individual dividend growth companies when they are sensibly priced and holding for the growing income. Our strategy for taking advantage of our ‘edge’ requires further explanation.

First, we size our positions based on quality. Our portfolios have a high concentration of high quality dividend growth stocks (as much as 80%) and not as much on quantity (think ETF). Studies have proven that once you get by sixteen stocks you have utilized most if not all the benefit that diversification provides. The added benefit to a concentrated portfolio is that we have fewer stocks to monitor (Step 3 in our process) which takes us less time to stay on top of our portfolios.

Secondly, like the card counting strategy mentioned earlier, we add to our position sizes (increase our bets) when our quality companies are sensibly priced and more aggressively when they go on sale. To dividend growth investors, this is the equivalent of having a lot of face cards left in the deck and increases the probability of better long-term returns.

Getting Started

Let’s say you’ve come up with a sensible estimate of fair value for a company on ‘The List’. Its share price is now below your estimate of fair value, so you think there is very probably a margin of safety between the current price and fair value.

You like the quality of the company (based on our quality indicators), and you like the current price, so you decide to invest. But how much of your capital should you invest into this business?

First separate your quality companies into ‘Core’ and ‘non-Core’ categories. In Canada, ‘Core’ companies are the ones that are essential to the economy (Telcos, Utilities, Banks, Railroads, Pipelines). We then ensure that these companies have high safety and financial ratings from third party sources (i.e. Value Line, S&P). These companies will be the foundation of our Canadian dividend growth portfolio.

Next, we choose our ‘non-Core’ companies. These companies are typically low yield/high growth businesses that tend to be a bit smaller in size but have stability in earnings, good management teams, and a history of paying growing dividends.

Our ‘full’ position size for a company will be about 8% in ‘Core’ companies and 2-4% in ‘non-Core’ companies.  We typically, only take the top two rated companies in any given sector. This allows us to hold between 15-20 stocks in our portfolio providing ample diversification across industries.

The logic behind our approach is that we now have greater concentration around the safest opportunities (Core) with some exposure to faster growing companies (non-Core). Our goal is that some of these ‘non-Core’ companies will continue to grow and will become ‘Core’ holdings over time.

If our position sizes grow beyond our initial full position size, we have the luxury of either allocating some of that growth to other areas of our portfolio or letting it run. We typically do not let any one position size grow to more than 10% or our portfolio.

Next, we enter our positions incrementally. This helps us avoid the dreaded price drop in the short term which can discourage those new to dividend growth investing and can supercharge our returns if done properly during times of market volatility. We like to buy in 50-100 basis points at a time when we are entering a position. A basis point is one-one hundredth of one percent so it can take a few trades to get to the position size we want. If the price dops 5% and nothing has fundamentally changed with the company, we will buy more. We usually only buy into a declining stock price three times in a short period of time. If the stock price reverses, we can buy more on the upswing if it remains sensibly priced provided, we have not exceeded our full position size.

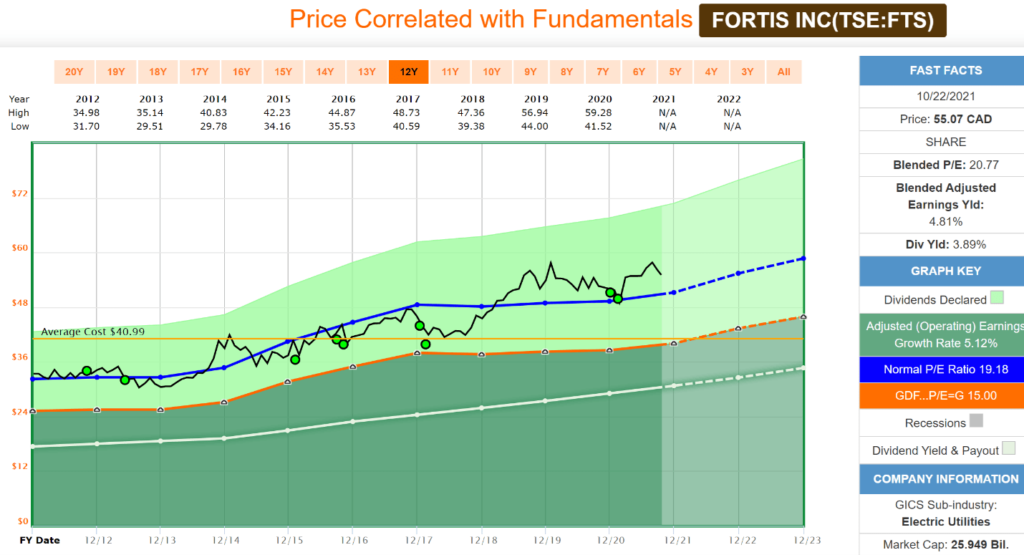
I will illustrate how we built a position size using a company from our Canadian Dividend Growth Portfolio, Fortis Inc. (FTS.TO). Both our buying strategies (sensibly priced and on sale) were part of our strategy when building this position. The green dots on the graphic are when we bought a position.

Price Correlated with Fundamentals FTS-TO
Source: FASTgraphs

Our historical graph shows that Fortis’ valuation corridor tends to follow its P/E ratio (Blue Line) very closely. The price (Black Line) has periods when it is above the P/E ratio (overpriced) and ones where it is below (on sale). We bought Fortis nine times over the last nine years. On four occasions we initiated a position when the price was at or near the average P/E (sensibly priced) where on five other occasions we initiated a position when the price was well below the average P/E. This is how we win!

The chart below is what we use to quickly monitor how our positions are performing. Dividend growth (DIV UP %) and price growth (PRICE UP %) quickly tell us how our purchases have performed. We like Fortis’ pattern as it seems to align dividend growth with price growth over time when it is purchased at a sensible price. The ‘on sale’ purchases (2016-2018) tend to have higher price appreciation compared to their dividend growth which makes sense given they were a bargain at the time and the price has now recovered.

Summary

We never know if our good dividend growers will go on sale and if they do, how long will it last. Being out-of-the-market for long periods of time will affect your returns so don’t be too cautious with your buying strategy. Entering positions incrementally along the way when our quality companies are sensibly priced and fully taking advantage of a sale when it presents itself increases the probability of above average long-term returns and the best way to use our ‘edge’.

CNR Executive Change Excites Investors

Posted by JM on October 20, 2021 

Here is an excerpt from Canadian National Railway’s (CNR) recent quarterly earnings release October 19, 2021.

Earnings Report:

Q3 2021 Actual: 1.52
Q3 2021 Estimate: 1.43
Q4 2021 Estimate: 1.59

Canadian National Railway Company (CNR.TO) was up in Canada early Wednesday after the company on Tuesday said its third-quarter profit rose 71%, topping expectations, and announced the retirement of its chief executive.

The railway reported net income of C$1.69 billion in the period, or C$2.37 per share, up from C$985 million, or C$1.38, in the third quarter of 2020. Adjusted profit, which excludes most one-time items, rose 9.5% to C$1.08 billion, or C$1.52 per share, besting the consensus analyst estimate for the measure of a C$1.42 per share adjusted profit, according to Capital IQ.

Revenue rose 5.3% to C$3.59 billion “mainly due to freight rate increases, higher applicable fuel surcharge rates, and an increase in intermodal ancillary services”.

CN’s operating ratio, a closely watched efficiency measure for which lower is better, rose 1.8 percentage points to 62.7%, and down 0.9 percentage points to 59% on an adjusted basis.

The company, which is in the midst of a proxy battle with shareholders disgruntled by its failed US$33-billion bid for the Kansas City Southern (KSU) railroad, said chief executive J.J. Ruest will retire at the end of January and the company is launching a search for a replacement. Replacing Ruest was one of the goals of the disgruntled group.

It appears that any opportunity to purchase this good dividend grower at a sensible price have dwindled in the short term with the release of their Q3 earnings report and CEO change. Investors like the news and the price is now at an all-time high with an earnings yield of just 3.55%.

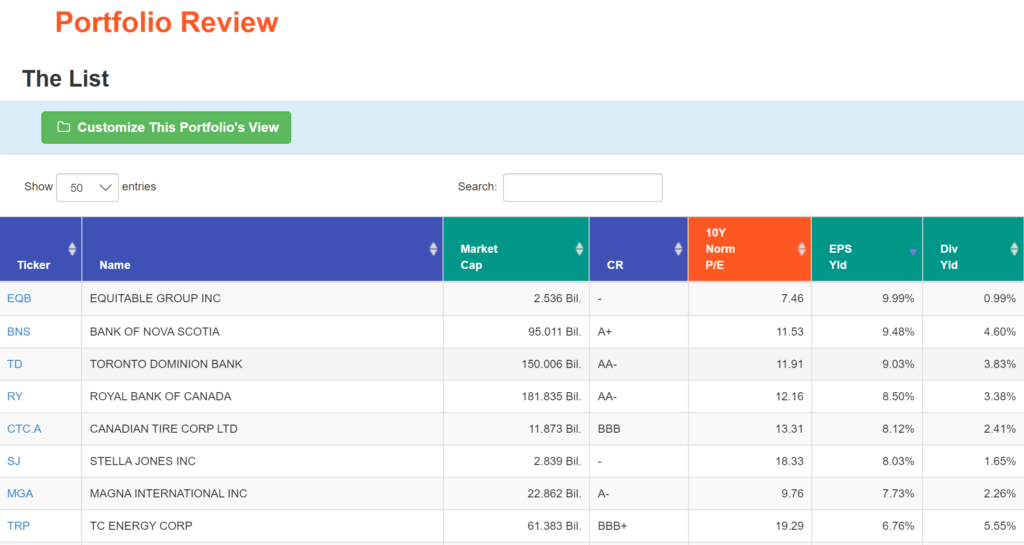
‘The List’ – Portfolio Review (October 2021)

Posted by BM on October 17, 2021 

Each month I will walk through our valuation process using a stock on ‘The List’ that meets our minimum screen of 6.5% EPS Yld. This month it is Equitable Group Inc. (EQB-T).

Valuation is the second step in our three-step process. Buying when our quality stocks are sensibly priced will help ensure our future investment returns meet our expectations. We rely heavily on the fundamental analyzer software tool (FASTgraphs) to help us understand the fundamentals of the stocks we invest in and then read the company’s website for investor presentations and recent earnings reports to learn more.

Intro:

Equitable Group Inc. trades on the Toronto Stock Exchange (TSX: EQB and EQB.PR.C) and serves a growing number of Canadians through Equitable Bank, Canada’s Challenger Bank™. Equitable Bank has grown to become the country’s eighth largest independent Schedule I bank with a clear mandate to drive real change in Canadian banking to enrich people’s lives. Founded over 50 years ago, Equitable Bank provides diversified personal and commercial banking and through its EQ Bank platform has been named #1 Bank in Canada on the Forbes World’s Best Banks 2021 list. EQ Bank provides state-of-the-art digital banking services, like the Savings Plus Account that reimagines banking by offering an everyday high interest rate, plus the flexibility of a chequing account, as well as a wide range of smart banking solutions for Canadians, like fast international money transfers, US dollar accounts and a suite of registered products.

Historical Graph:

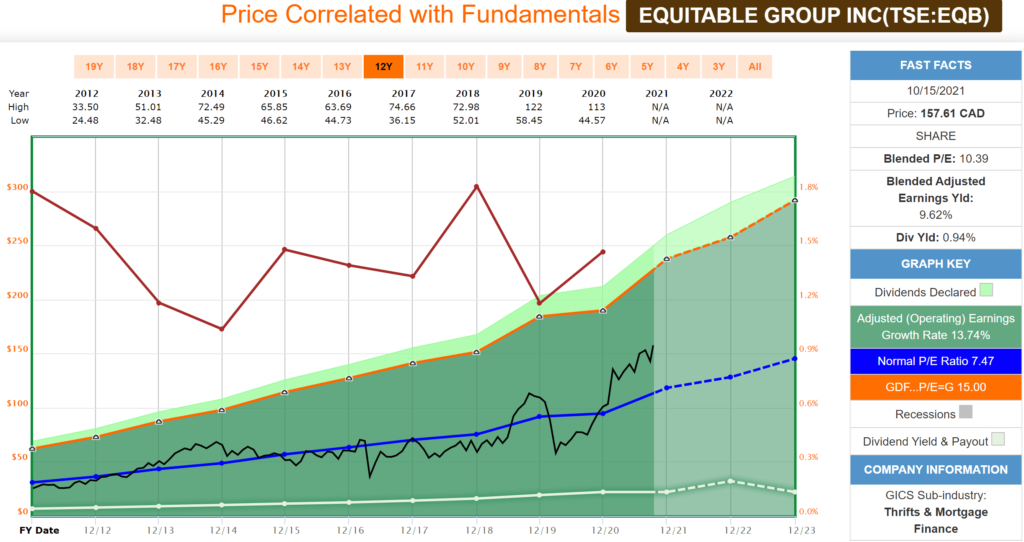
Historical Graph-EQB
Source: FASTgraphs

Comments:

Equitable Group is another of our good dividend growers that has traded within a narrow valuation corridor. As you can see from the Blue Line on the graph (Average P/E) and the Black Line (Price), there is typically very little variance (except for the large dip in 2020 due to COVID). Investment opportunities occur when the Black Line touches or falls below the Blue Line with this quality dividend grower. The fundamentals show a company whose earnings have grown steadily over the last ten years and are accelerating. The price reflects this with a higher-than-average P/E with a lower dividend yield (Red Line).

Performance Graph:

Performance-EQB
Source: FASTgraphs

Comments:

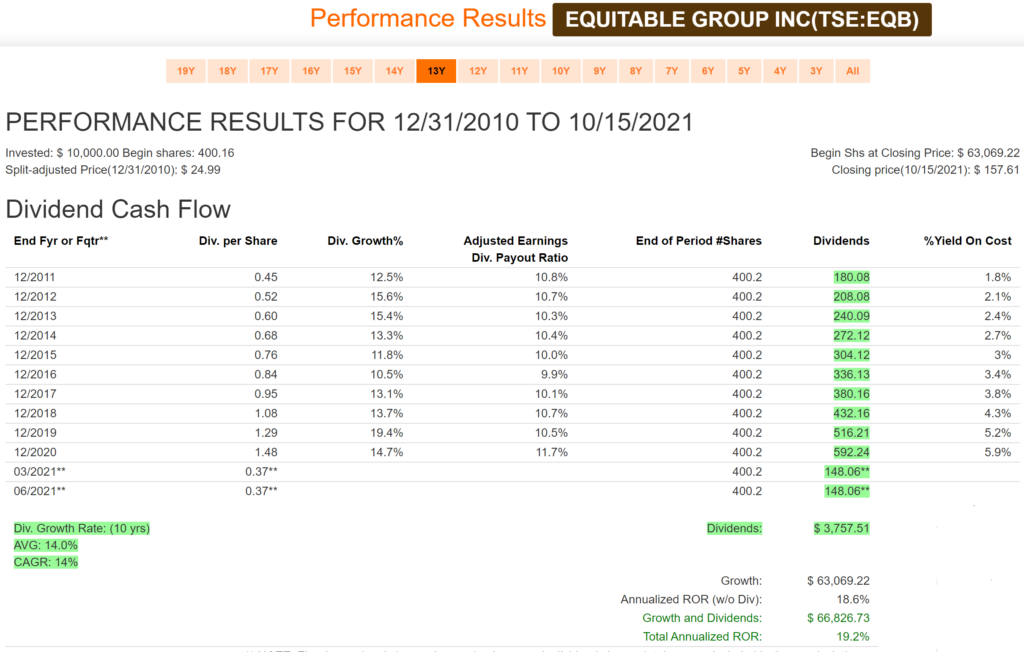
Equitable Group Inc. has an excellent dividend growth rate (14%/year) over the last decade. A low starting yield takes a bit longer to produce an acceptable income level for retirees, but you can clearly see that EQB is gaining fast. With a starting yield of 1.8% ten years ago, you would now be receiving a return of 5.9% on your original investment from dividends alone.

EQB is also one of the stocks we like as dividend growth investors that aligns dividend growth closely with price growth (~16% CAGR of capital over the past decade).

Note: The dividend rate was unchanged from 2020 reflecting regulatory guidance from OSFI to all federally regulated banks. The Bank intends to resume its previously announced dividend increases once regulatory restrictions are lifted.

Estimated Earnings:

Forecast-EQB
Source: FASTgraphs

Comments:

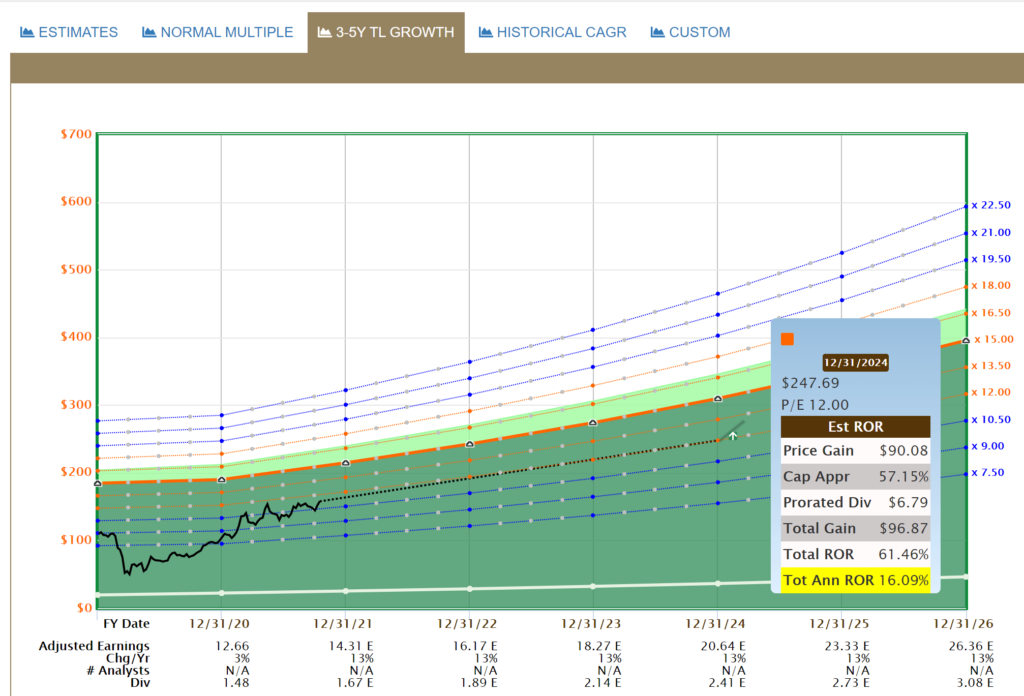
We are going to use a different way of forecasting for EQB than we have used for some of the other stocks we have analyzed. The reason is that EQB has been accelerating its earnings growth over the last few years and the historical P/E is becoming less relevant. In this example we use the ‘3-5Y TL Growth’ or Trend Line Growth. With a historical 13% earnings growth rate over this period we can see that the stock should be valued at a higher multiple (P/E).

EQB’s ‘Blended P/E’ is 11.29. Blended P/E is based upon a weighted average of the most recent actual value and the closest forecast value. It appears that EQB will demand a higher multiple going forward from the market which makes the price today a sensible entry point using this forecasting methodology.

Analyst Scorecard:

Scorecard-EQB
Source: FASTgraphs

Comments:

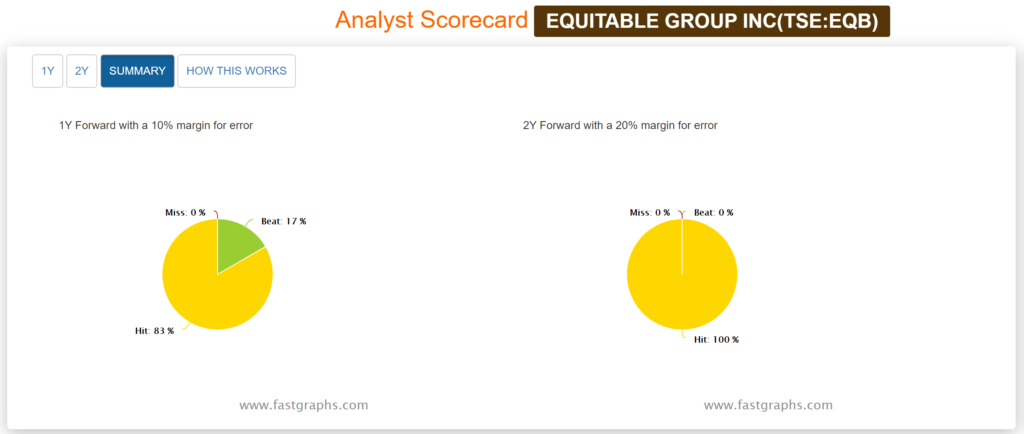
Analyst estimates over the years are quite accurate based on one and two-year earnings projections. Analysts projections have hit or beat 100% of the time on one and two year estimates.

Recent Earnings Report-Q2 2021:

Q2 Net Earnings $70.8 million, +$18.3 million or +35% from 2020

  • Q2 diluted EPS $4.05, +33% from Q2 2020

ROE 16.5% with $100 million in Excess Capital

  • Q2 ROE towards high end of 15-17% target, and 1.8% better than 14.7% in Q2 2020
  • CET1 14.4% vs. mid-point target of 13.5%, or excess capital of nearly $6 per share
  • Efficiency remaining in target range of 39-41% at 40.9% in Q2 and 39.6% YTD

Book Value Surpasses $100 per share

  • Book value +20% y/y to $101.94 per share and +$4.08 or +4% from Q1 2021

Customers and Digital – Growing & Deepening

  • Now serving nearly 300,000 Canadians, with EQ Bank digital customers +79% y/y to 222,000 and deposits +99% y/y to over $6.5 billion
  • Digital transactions +101% y/y, average products per customer +44%, customer lifetime value more than 10 times higher than account acquisition costs

Conventional Lending Driving Asset Growth

  • Loans under management +9% y/y to $35.4 billion
  • Single family alternative loan originations +200% y/y to $1.8 billion, reverse mortgage originations +318% y/y to $45 million, and Commercial loan originations +16% y/y to $0.7 billion

“Earlier this year, we significantly upgraded our growth forecast and in so doing, challenged ourselves to do more for customers, partners, and shareholders. Through Q2, Equitable delivered to this guidance. On the strength of great execution by our team and meaningful innovations in our challenger bank services, each area of the Bank registered growth. EQ Bank deposits grew 99% over 2020 to a record $6.5 billion, an indication that digital services like our new US Dollar Account are driving the kind of change that enriches the lives of our customers. This past quarter was also an excellent illustration of how we’re positioning to drive future earnings, with double-digit loan origination growth reflecting strong contributions from alternative single family, reverse mortgages, Cash Surrender Value lines of credit and conventional commercial loans where Equitable stands out for responsive service, effective underwriting, and risk management. For shareholders, Q2 featured record earnings, high ROE, and an industry best efficiency ratio, even as we purposely drive higher investment to seed future growth. With the tailwinds of an improving economy and the positive impact of service expansions, Equitable is in a great position to realize its objectives this year and beyond, on behalf of almost 300,000 customers, our valued shareholders, and business partners,” said Andrew Moor, President and Chief Executive Officer.

Summary:

Equitable Group Inc. (EQB) checks a lot of the boxes that dividend growth investors look for in a quality candidate; above average dividend and price growth over the last decade, low payout ratio with estimated double-digit growth ahead. Throw in a 2:1 stock split recently announced (Oct. 5) and you have a compelling case for an investment.

The only caveat is that EQB is not covered by any of the third-party services we subscribe to, so it is hard to get a complete read on the ‘quality’ of this business. The market cap (~2.7B) is a little lower than we would like to see for a core position.

Retirees may not find today’s starting yield appealing but investors with a longer-term horizon may want to consider adding a smaller position to their low yield/high growth category.

Q3 2021 Earnings Calendar-Intro

Posted by JM on October 4, 2021 

Benjamin Graham once remarked that earnings are the principal factor driving stock prices.

Each quarter we will provide readers with weekly earnings updates of stocks on ‘The List’ during the calendar earnings season. Q3 has just ended, and companies are now beginning to report.

Earnings growth and dividend growth tend to go hand in hand so this information can tell us a lot about future dividend growth of our quality companies. Monitoring our dividend growers periodically is part of the process and reading the quarterly earnings releases is a good place to start.

Some of our dividend growers from ‘The List’ have reported quarterly earnings already, based on their fiscal year, with the majority of Q3 earnings scheduled to report in October.

The complete chart can be found below the updated List by selecting ‘The List’ menu item at the top of the page.

Q3 Estimates and Results:

SYMBOL COMPANY DATE ESTIMATE RESULT
BNS-T Bank of Nova Scotia 24-Aug $1.90 $2.01
RY-T Royal Bank of Canada 25-Aug $2.71 $3.00
TD-T TD Bank 26-Aug $1.92 $1.96
ATD-B-T Alimentation Couche-Tard Inc. 31-Aug $0.65 $0.71
DOL-T Dollarama Inc. 9-Sep $0.49 $0.48
ENGH-T Enghouse Systems Limited 9-Sep $0.39 $0.38

We buy quality individual dividend growth stocks when they are sensibly priced and hold for the growing income.