“You have a pair of pants. In the left pocket, you have $100. You take $1 out of the left pocket and put in the right pocket. You now have $101. There is no diminution of dollars in your left pocket. That is one magic pair of pants.”

MP Market Review – June 23, 2023

Last updated by BM on June 26, 2023

Summary 

  • This is a weekly installment of our MP Market Review series, which provides updates on the financial markets and Canadian dividend growth companies we monitor on ‘The List’.
  • Last week, ‘The List’ was down with a YTD price return of +2.2% (capital). Dividend growth remained the same and is now at +8.4% YTD, highlighting growth in income over the past year.
  • Last week, no dividend increases from companies on ‘The List’.
  • Last week, no earnings reports from companies on ‘The List’.
  • One company on ‘The List’ is due to report earnings this week.
  • If you’re interested in creating your own dividend growth income portfolio, consider subscribing to our premium service, which grants you access to the MP Wealth-Builder Model Portfolio (CDN) and exclusive subscriber-only content.  Learn More         

Introduction

“You have a pair of pants. In the left pocket, you have $100. You take $1 out of the left pocket and put it in the right pocket. You now have $101. There is no diminution of dollars in your left pocket. That is one magic pair of pants.”

This ‘magic pants’ analogy was from a Seeking Alpha article on dividend investing I read about a decade ago and was one of the catalysts for me to take a closer look at this type of investing and see if it truly was magical. 

After conducting additional research, I have shifted towards utilizing a dividend growth investing (DGI) strategy as my primary investment approach. While I maintain portfolios consisting of high-quality dividend growers from both the United States and Canada, I have opted to concentrate on Canadian (CDN) dividend growth companies in this blog. This is due to several reasons, including a smaller pool of DGI companies to track, a lack of coverage for the DGI strategy by the North American investment media, and a tendency for those who do cover DGI to narrowly focus on only a handful of sectors (Energy and Financials).

While ‘The List’ is not a portfolio in itself, it serves as an excellent initial reference for individuals seeking to diversify their investments and attain higher returns in the Canadian stock market. Through our blog, we provide weekly updates on ‘The List’ and offer valuable perspectives and real-life examples of the dividend growth investing strategy in practice. This helps readers gain a deeper understanding of how to implement and benefit from this investment approach.

DGI Thoughts

“What’s an investment, anyhow, but a body of capital that produces income. The income maybe current income, or it may be prospective income, but is is the magnitude of the income, current or prospective, that determines the value of the capital which produces it. “

– Arnold Bernhard, page 21, The Evaluation of Common Stocks, 1959

When markets are falling or going sideways, I have always taken comfort in looking at the income my investments produce. Unlike most growth-only investors, we do not have to wait on our excellent dividend growers to go up in value to generate income to pay our bills or have fun with.

The link below is a table with each stock in ‘The List’ sorted by total dividends paid over the last ten years.

THE LIST 10YR_DIV_PAID

The average is a little over 45% of your initial investment ($4,539) being returned to you in the form of dividends over the last decade. Starting yield (YLD ’13) has a big impact on dividends paid in the first ten years but some of our low yield high growth stocks are gaining fast. It will be interesting to publish this report in another ten years’ time to see how the order has changed.

If you have not yet joined as a subscriber of the blog to receive DGI Alerts on the activity and content related to our model portfolio, it’s not too late. Click Here. 

Recent News 

Is there a new bull market on the horizon? (Globe & Mail)

https://www.theglobeandmail.com/investing/article-new-bull-market/

According to the author, the rise in Artificial Intelligence companies recently and renewed strength in the real estate sector have some thinking a new bull market is just around the corner.

Bull or Bear markets don’t really affect how we execute our process except for the fact that we acquire good dividend growers at lower valuations during market downturns. Being in the market is more important to us than trying to time it.

A gameplan for savers and conservative investors who think interest rates will go higher (Globe & Mail)

https://www.theglobeandmail.com/investing/personal-finance/carrick-on-money/article-rob-carrick-a-gameplan-for-savers-and-conservative-investors-who-think/

The author recommends looking at High-Interest Savings Accounts (HISAs). Rates are around 5% right now.

We prefer to invest in dividend growth companies that offer similar yields to HISAs yet grow their yields every year. Interest income is also taxed at a higher rate than our dividend income which takes the shine off these investments as well. Not a bad idea to use HISAs to earn a little extra in the short term while you wait to deploy some of your cash in good dividend growers but as a long-term investment we think there are better alternatives.

To receive breaking news about companies on ‘The List’ follow us on Twitter @MagicPants_DGI.

The List (2023)

Last updated by BM on June 23, 2023

The Magic Pants List contains 27 Canadian dividend growth stocks. ‘The List’ contains Canadian companies that have raised their dividend yearly for at least the last ten years and have a market cap of over a billion dollars. Below is each stock’s symbol, name, current yield, current price, price return year-to-date, current dividend, dividend growth year-to-date and current dividend growth streak. Companies on ‘The List’ are added or subtracted once a year, on January 1. After that, ‘The List’ is set for the next twelve months. Prices and dividends are updated weekly.

SYMBOL COMPANY YLD PRICE YTD % DIV YTD % STREAK
AQN-N Algonquin Power & Utilities 6.3% $8.05 19.6% $0.51 -29.0% 12
ATD-T Alimentation Couche-Tard Inc. 0.9% $63.48 5.6% $0.56 19.1% 13
BCE-T Bell Canada 6.5% $58.82 -2.3% $3.82 5.0% 14
BIP-N Brookfield Infrastructure Partners 4.4% $35.06 5.2% $1.44 6.3% 15
CCL-B-T CCL Industries 1.7% $61.89 6.6% $1.06 10.4% 21
CNR-T Canadian National Railway 2.0% $155.32 -4.6% $3.16 7.8% 27
CTC-A-T Canadian Tire 4.0% $170.53 16.3% $6.90 17.9% 12
CU-T Canadian Utilities Limited 5.2% $34.35 -7.0% $1.79 1.0% 51
DOL-T Dollarama Inc. 0.3% $86.36 8.1% $0.27 23.8% 12
EMA-T Emera 5.2% $53.38 1.4% $2.76 3.0% 16
ENB-T Enbridge Inc. 7.4% $47.74 -10.5% $3.55 3.2% 27
ENGH-T Enghouse Systems Limited 2.7% $31.41 -12.0% $0.85 18.2% 16
FNV-N Franco Nevada 1.0% $139.15 0.7% $1.36 6.3% 15
FTS-T Fortis 4.1% $55.43 0.2% $2.26 4.1% 49
IFC-T Intact Financial 2.2% $195.74 0.0% $4.40 10.0% 18
L-T Loblaws 1.5% $116.39 -3.3% $1.74 10.3% 11
MGA-N Magna 3.5% $52.03 -9.5% $1.84 2.2% 13
MRU-T Metro 1.7% $71.91 -4.7% $1.21 10.0% 28
RY-T Royal Bank of Canada 4.4% $122.32 -4.5% $5.34 7.7% 12
SJ-T Stella-Jones Inc. 1.4% $64.37 29.8% $0.92 15.0% 18
STN-T Stantec Inc. 0.9% $82.86 26.8% $0.77 8.5% 11
TD-T TD Bank 4.9% $78.00 -11.0% $3.84 7.9% 12
TFII-N TFI International 1.3% $105.65 5.5% $1.40 29.6% 12
TIH-T Toromont Industries 1.6% $104.30 6.7% $1.68 10.5% 33
TRP-T TC Energy Corp. 7.1% $51.81 -2.8% $3.69 3.4% 22
T-T Telus 5.6% $25.35 -3.7% $1.43 7.3% 19
WCN-N Waste Connections 0.7% $136.10 3.3% $1.02 7.4% 13
Averages 3.3% 2.2% 8.4% 19

Six Canadian stocks on ‘The List’ declare earnings and dividends in US dollars and are inter-listed on a US exchange in US dollars. The simplest way to display dividend and price metrics for these stocks is to show their US exchange symbols along with their US dividends and price. The stocks I am referring to have a -N at the end of their symbols. You can still buy their Canadian counterparts (-T), but your dividends will be converted into CDN dollars and will fluctuate based on the exchange rate.

Note: When the dividend and share price currency match, the calculation is straightforward. But it’s not so simple when the dividend is declared in one currency, and the share price is quoted in another. Dividing the former by the latter would produce a meaningless result because it’s a case of apples and oranges. To calculate the yield properly, you must express the dividend and share price in the same currency.

Performance of ‘The List’

Feel free to click on this link, ‘The List’ for a sortable version from our website.

Last week, ‘The List’ was down with a YTD price return of +2.2% (capital). Dividend growth remained the same and is now at +8.4% YTD, highlighting growth in income over the past year.

The best performers last week on ‘The List’ were Metro (MRU-T), up +1.08%; Loblaws (L-T), up +1.02%; and CCL Industries (CCL-B-T), up +0.15%.

Magna (MGA-T) was the worst performer last week, down -8.7%.


Dividend Increases

“The growth of dividend paying ability is of significance in the determination of a stock’s quality, or general safety…”

– Arnold Bernhard (the founder of Value Line)

“As a dividend increase is a positive sign of a company’s financial strength, the safest purchase, after research, is a stock with a recent dividend increase.”

– Tom Connolly (the founder of dividendgrowth.ca)

Last week, no dividend increases from companies on ‘The List’.


Earnings Releases

Benjamin Graham once remarked that earnings are the principal factor driving stock prices.

Each quarter we will provide readers with weekly earnings updates of stocks on ‘The List’ during the calendar earnings season. 

The updated earnings calendar can be found here.

Earnings growth and dividend growth tend to go hand in hand, so this information can tell us a lot about the future dividend growth of our quality companies. Monitoring our dividend growers periodically is part of the process, and reading the quarterly earnings releases is a good place to start.

One earnings report from companies on ‘The List’ this week

Alimentation Couche-Tard Inc. (ATD-T) will release its fourth-quarter fiscal 2023 results on Tuesday, June 27, 2023, after markets close.

Last week, No earnings reports from companies on ‘The List’.


MP Market Review – June 16, 2023

Last updated by BM on June 19, 2023

Summary 

  • This is a weekly installment of our MP Market Review series, which provides updates on the financial markets and Canadian dividend growth companies we monitor on ‘The List’.
  • Last week, ‘The List’ was up slightly with a YTD price return of +4.3% (capital). Dividend growth remained the same and is now at +8.4% YTD, highlighting growth in income over the past year.
  • Last week, no dividend increases from companies on ‘The List’.
  • Last week, one earnings report from companies on ‘The List’.
  • No companies on ‘The List’ are due to report earnings this week.
  • If you’re interested in creating your own dividend growth income portfolio, consider subscribing to our premium service, which grants you access to the MP Wealth-Builder Model Portfolio (CDN) and exclusive subscriber-only content.  Learn More         

Introduction

“You have a pair of pants. In the left pocket, you have $100. You take $1 out of the left pocket and put it in the right pocket. You now have $101. There is no diminution of dollars in your left pocket. That is one magic pair of pants.”

This ‘magic pants’ analogy was from a Seeking Alpha article on dividend investing I read about a decade ago and was one of the catalysts for me to take a closer look at this type of investing and see if it truly was magical. 

After conducting additional research, I have shifted towards utilizing a dividend growth investing (DGI) strategy as my primary investment approach. While I maintain portfolios consisting of high-quality dividend growers from both the United States and Canada, I have opted to concentrate on Canadian (CDN) dividend growth companies in this blog. This is due to several reasons, including a smaller pool of DGI companies to track, a lack of coverage for the DGI strategy by the North American investment media, and a tendency for those who do cover DGI to narrowly focus on only a handful of sectors (Energy and Financials).

While ‘The List’ is not a portfolio in itself, it serves as an excellent initial reference for individuals seeking to diversify their investments and attain higher returns in the Canadian stock market. Through our blog, we provide weekly updates on ‘The List’ and offer valuable perspectives and real-life examples of the dividend growth investing strategy in practice. This helps readers gain a deeper understanding of how to implement and benefit from this investment approach.

DGI Thoughts

“Since the S&P500 was created in 1957, there have been 10 recessions. Aside from the Covid-19 recession of 2020, which only lasted two months, the other nine recessions were preceded by high inflation and triggered by the Fed raising interest rates. Each recession ended as the Fed began lowering interest rates, loosening monetary policy, and often coincided with increased government spending, known as fiscal expansion…”

– Bryan M. Kuderna, author of Millennial Millionaire

Predicting the next recession is difficult but if you are honest with yourself the probability of one within the next twelve months is increasing. Recessions aren’t necessarily a bad thing for dividend growth investors as we do get to buy more income at attractive valuations.

In March 2020 (the last recession) within our original Wealth-Builder Portfolio, we executed on our process and did very well.

Although a 50% capital return (on average) over three years is nothing to sneeze at, I am most proud of the current return we now get from dividends alone (6.33%).

You would get an average yield today of 4.4% for these four stocks. Still pretty good but I’ll take a 5% starting yield on quality dividend growers any day. Recessions give us the opportunity to buy more income at better prices, accelerating our total returns when the economy picks up.

As investors who focus on dividend growth, we distinguish ourselves through our patient approach toward buying opportunities, our readiness to hold cash for price pullbacks, and our unwavering confidence in the economy’s ability to recover.

If you have not yet joined as a subscriber of the blog to receive DGI Alerts on the activity and content related to our model portfolio, it’s not too late. Click Here. 

Recent News 

Stress Test transcript: ‘Punched in the face by my investments’: How to endure stock market swings (Globe & Mail)

https://www.theglobeandmail.com/featured-reports/article-stress-test-transcript-punched-in-the-face-by-my-investments-how-to/

Found this conversation between two financial writers from the Globe & Mail and an Investment Advisor interesting and typical of the advice being given to new investors. Not much different from the past except they recommend ETFs now.

Good advice from the article:

  • Resist the urge to act on headlines
  • Volatility is part of investing; use it to invest in your portfolio
  • Delete trading apps on your phone
  • Invest for the long term
  • Market timing doesn’t work

Not so good advice:

  • Learn to accept that it could be 5-10 years before you see a positive return on your investment
  • Invest in ETFs as they give you lots of diversification
  • Invest 80% in stocks and 20% in bonds

Do we have to wait 5-10 years for a return on our investments? Our dividends show up early and often and dividend increases are announced like clock work every year and sometimes twice a year. Capital returns magically follow the increase in the dividend.

Bell says it will eliminate 1,300 positions, close or sell nine radio stations amid declining revenues (Globe & Mail)

https://www.theglobeandmail.com/business/article-bce-layoffs-radio-stations/

Headlines like this are starting to appear more often as recession fears and increased competition begin to take hold.

“In a separate memo, Bell Media president Wade Oosterman blamed the cuts on “major disruption” to the industry due to a combination of customer cord cutting and the shift of advertising revenue to foreign digital platforms.”

Bell Canada is one of the ‘Core’ stocks in our model portfolio so we will be paying attention to the next earnings release to learn more.

To receive breaking news about companies on ‘The List’ follow us on Twitter @MagicPants_DGI.

The List (2023)

Last updated by BM on June 16, 2023

The Magic Pants List contains 27 Canadian dividend growth stocks. ‘The List’ contains Canadian companies that have raised their dividend yearly for at least the last ten years and have a market cap of over a billion dollars. Below is each stock’s symbol, name, current yield, current price, price return year-to-date, current dividend, dividend growth year-to-date and current dividend growth streak. Companies on ‘The List’ are added or subtracted once a year, on January 1. After that, ‘The List’ is set for the next twelve months. Prices and dividends are updated weekly.

SYMBOL COMPANY YLD PRICE YTD % DIV YTD % STREAK
AQN-N Algonquin Power & Utilities 6.0% $8.41 25.0% $0.51 -29.0% 12
ATD-T Alimentation Couche-Tard Inc. 0.9% $64.73 7.6% $0.56 19.1% 13
BCE-T Bell Canada 6.3% $60.28 0.1% $3.82 5.0% 14
BIP-N Brookfield Infrastructure Partners 4.4% $35.41 5.2% $1.44 6.3% 15
CCL-B-T CCL Industries 1.7% $61.80 6.5% $1.06 10.4% 21
CNR-T Canadian National Railway 2.0% $156.99 -3.6% $3.16 7.8% 27
CTC-A-T Canadian Tire 4.0% $173.00 18.0% $6.90 17.9% 12
CU-T Canadian Utilities Limited 5.1% $35.02 -5.2% $1.79 1.0% 51
DOL-T Dollarama Inc. 0.3% $87.15 9.1% $0.27 23.8% 12
EMA-T Emera 5.1% $54.34 3.3% $2.76 3.0% 16
ENB-T Enbridge Inc. 7.2% $49.47 -7.2% $3.55 3.2% 27
ENGH-T Enghouse Systems Limited 2.6% $32.50 -9.0% $0.85 18.2% 16
FNV-N Franco Nevada 0.9% $145.74 5.5% $1.36 6.3% 15
FTS-T Fortis 4.0% $56.55 2.2% $2.26 4.1% 49
IFC-T Intact Financial 2.2% $198.54 1.4% $4.40 10.0% 18
L-T Loblaws 1.5% $115.22 -4.2% $1.74 10.3% 11
MGA-N Magna 3.2% $56.99 -0.9% $1.84 2.2% 13
MRU-T Metro 1.7% $71.14 -5.7% $1.21 10.0% 28
RY-T Royal Bank of Canada 4.2% $125.88 -1.7% $5.34 7.7% 12
SJ-T Stella-Jones Inc. 1.4% $64.54 30.2% $0.92 15.0% 18
STN-T Stantec Inc. 0.9% $84.21 28.9% $0.77 8.5% 11
TD-T TD Bank 4.8% $80.71 -7.9% $3.84 7.9% 12
TFII-N TFI International 1.3% $106.25 6.1% $1.40 29.6% 12
TIH-T Toromont Industries 1.6% $107.00 9.5% $1.68 10.5% 33
TRP-T TC Energy Corp. 6.9% $53.57 0.5% $3.69 3.4% 22
T-T Telus 5.6% $25.73 -2.2% $1.43 7.3% 19
WCN-N Waste Connections 0.7% $137.54 4.4% $1.02 7.4% 13
Averages 3.2% 4.3% 8.4% 19

Six Canadian stocks on ‘The List’ declare earnings and dividends in US dollars and are inter-listed on a US exchange in US dollars. The simplest way to display dividend and price metrics for these stocks is to show their US exchange symbols along with their US dividends and price. The stocks I am referring to have a -N at the end of their symbols. You can still buy their Canadian counterparts (-T), but your dividends will be converted into CDN dollars and will fluctuate based on the exchange rate.

Note: When the dividend and share price currency match, the calculation is straightforward. But it’s not so simple when the dividend is declared in one currency, and the share price is quoted in another. Dividing the former by the latter would produce a meaningless result because it’s a case of apples and oranges. To calculate the yield properly, you must express the dividend and share price in the same currency.

Performance of ‘The List’

Feel free to click on this link, ‘The List’ for a sortable version from our website.

Last week, ‘The List’ was up slightly with a YTD price return of +4.3% (capital). Dividend growth remained the same and is now at +8.4% YTD, highlighting growth in income over the past year.

The best performers last week on ‘The List’ were Magna (MGA-N), up +7.04%; Dollarama Inc. (DOL-T), up +4.96%; and Stantec Inc. (STN-T), up +3.43%.

Enghouse Systems Limited (ENGH-T) was the worst performer last week, down -11.71%.


Dividend Increases

“The growth of dividend paying ability is of significance in the determination of a stock’s quality, or general safety…”

– Arnold Bernhard (the founder of Value Line)

“As a dividend increase is a positive sign of a company’s financial strength, the safest purchase, after research, is a stock with a recent dividend increase.”

– Tom Connolly (the founder of dividendgrowth.ca)

Last week, no dividend increases from companies on ‘The List’.


Earnings Releases

Benjamin Graham once remarked that earnings are the principal factor driving stock prices.

Each quarter we will provide readers with weekly earnings updates of stocks on ‘The List’ during the calendar earnings season. 

The updated earnings calendar can be found here.

Earnings growth and dividend growth tend to go hand in hand, so this information can tell us a lot about the future dividend growth of our quality companies. Monitoring our dividend growers periodically is part of the process, and reading the quarterly earnings releases is a good place to start.

No earnings reports from companies on ‘The List’ this week

Last week, one earnings report from companies on ‘The List’.

Enghouse Systems Limited (ENGH-T) released its second-quarter fiscal 2023 results on Monday, June 12, 2023, after markets closed.

“During the second quarter of 2023, we generated an increase in revenue, positive operating cash flows, operating income profits and completed two acquisitions. Consistent with our strategy, the increase in revenue is mainly a result of acquisitions that have expanded our recurring SaaS revenue base. We continue with our strategy of offering our customers choice around how they deploy our technology whether on-premise or in the cloud. Furthermore, our products are “cloud-vendor agnostic” offering options to our customers to use their preferred cloud providers. Offering choice has been an important factor in winning and retaining customers.”

– Stephen J. Sadler, President and Chief Executive Officer

Highlights:

  • Revenue achieved was $113.5 and $219.9 million, respectively, compared to revenue of $106.3 and $217.4 million;
  • Results from operating activities was $25.6 and $55.5 million, respectively, compared to $31.1 and $66.8 million;
  • Net income was $12.5 and $29.6 million, respectively, compared to $17.9 and $39.5 million;
  • Adjusted EBITDA was $30.2 and $62.5 million, respectively, compared to $33.8 and $72.3 million;
  • Cash flow from operating activities excluding changes in working capital was $28.9 and $61.5 million, respectively, compared to $34.5 and $73.3 million.

Outlook:

We continue to achieve our objective of profitable growth with results from operating activities of $25.6 million and cash flows from operating activities, excluding changes in working capital, of $28.9 million, which was accomplished in a quarter where we closed two acquisitions that required significant operational improvements.

On February 9, 2023, the Company acquired 100% of the issued and outstanding common shares of Mobi All Tecnologia S.A. (“Navita”). Headquartered in Sao Paulo, Brazil, Navita provides SaaS based Enterprise Mobility Management solutions in managing and controlling critical mobile assets as well as telecom and IT expense management.

On February 8, 2023, the Company completed its acquisition of Qumu Corporation (“Qumu”) (Nasdaq: QUMU), a global provider of cloud-based enterprise video technology. Under a December 19, 2022 agreement, a wholly owned subsidiary of the Company completed the tender offer for all the outstanding shares of Qumu for USD $0.90 per share in cash. The two acquisitions were completed for an aggregate cash purchase price of $30.1 million with $2.4 million remaining in holdback, subject to potential adjustment. Results for both acquisitions are included in IMG from their respective dates of acquisition.

Subsequent Event

On May 17, 2023, Enghouse entered into an asset purchase agreement with Lifesize Inc (“Lifesize”), a global provider of video conferencing and omnichannel contact center solutions, based in Texas. Under the agreement, Enghouse will acquire substantially all of Lifesize’s assets and brands, including Lifesize, Kaptivo, ProScheduler, Serenova and Telstrat. The purchase remains subject to court approval.

Source: (ENGH-T) Q2-2023 Earnings Release


MP Market Review – June 9, 2023

Last updated by BM on June 12, 2023

Summary 

  • This is a weekly installment of our MP Market Review series, which provides updates on the financial markets and Canadian dividend growth companies we monitor on ‘The List’.
  • Last week, ‘The List’ was down slightly with a YTD price return of +4.2% (capital). Dividend growth remained the same and is now at +8.4% YTD, highlighting growth in income over the past year.
  • Last week, no dividend increases from companies on ‘The List’.
  • Last week, one earnings report from companies on ‘The List’.
  • One company on ‘The List’ is due to report earnings this week.
  • If you’re interested in creating your own dividend growth income portfolio, consider subscribing to our premium service, which grants you access to the MP Wealth-Builder Model Portfolio (CDN) and exclusive subscriber-only content.  Learn More         

Introduction

“You have a pair of pants. In the left pocket, you have $100. You take $1 out of the left pocket and put it in the right pocket. You now have $101. There is no diminution of dollars in your left pocket. That is one magic pair of pants.”

This ‘magic pants’ analogy was from a Seeking Alpha article on dividend investing I read about a decade ago and was one of the catalysts for me to take a closer look at this type of investing and see if it truly was magical. 

After conducting additional research, I have shifted towards utilizing a dividend growth investing (DGI) strategy as my primary investment approach. While I maintain portfolios consisting of high-quality dividend growers from both the United States and Canada, I have opted to concentrate on Canadian (CDN) dividend growth companies in this blog. This is due to several reasons, including a smaller pool of DGI companies to track, a lack of coverage for the DGI strategy by the North American investment media, and a tendency for those who do cover DGI to narrowly focus on only a handful of sectors (Energy and Financials).

While ‘The List’ is not a portfolio in itself, it serves as an excellent initial reference for individuals seeking to diversify their investments and attain higher returns in the Canadian stock market. Through our blog, we provide weekly updates on ‘The List’ and offer valuable perspectives and real-life examples of the dividend growth investing strategy in practice. This helps readers gain a deeper understanding of how to implement and benefit from this investment approach.

DGI Thoughts

“Inflation may have become the oldest form of government finance. It may also have been the oldest form of political confidence game used by leaders to exact tribute from constituents, older even than taxes, and inflation has kept those honoured places in human affairs to this day…For at least four thousand years of recorded history, man has known inflation.”

– Jens O. Parsson, Dying of Money

With inflation still in the news after another interest rate hike last week from the Bank of Canada, I thought it timely to revisit how above average inflation rates impact retirees.

You’ve probably come across the 4% Rule and the Age Rule when it comes to retirement planning. Let’s take a closer look at each of these rules.

The 4% Rule suggests withdrawing or spending down 4% of your assets each year. For example, if you have a $1,000,000 portfolio, you would withdraw $40,000 annually, which should ideally sustain you for 25 years of retirement. However, it’s important to note that the 4% Rule primarily works in a prolonged bull market characterized by consistent stock price growth. During an extended bear market, where stock prices decline, relying on withdrawals can significantly impact your portfolio and jeopardize your retirement savings.

The Age Rule determines the allocation of a person’s portfolio between stocks and bonds. It suggests subtracting your current age from 100 to determine the percentage of your portfolio that should be invested in stocks. For instance, if you retire at age 65, subtracting 65 from 100 gives you 35%, which should be allocated to equities, while the remaining 65% is invested in bonds and cash. As you age, the equity portion of your portfolio decreases, aiming for more stability. By age 80, it would decline to 20%.

In an inflationary environment, relying solely on a bond and cash portfolio may not sustain you throughout retirement unless you possess considerable wealth. Bonds typically do not increase their yield over the bond’s lifespan. If you purchased a Treasury bond ten years ago with a 2% yield, it would still pay you the same 2% when it matures. However, the purchasing power of that yield would be lower due to inflation. The goods and services you could have obtained with that bond ten years ago would cost more today, eroding its value.

Considering that neither rule functions optimally in a bear market or endures high inflation, retirees face a challenging dilemma. So, what can retirees do in such circumstances?

A better solution, I believe, is to own high-quality, dividend-growth stocks. In my opinion, they are the best inflation hedge that I know of that can help you keep pace with inflation and build your wealth. Predicting what my dividends will be at the end of the year has proven much more reliable than what the value of my portfolio will be. In the end, I know that eventually, my dividend growth will drive my capital growth, and I have a high probability of never running out of money in my retirement.

Here are two posts that discuss dividend growth investing and a withdrawal strategy in more depth.

The Stay-in-Stocks DGI Strategy

The 90% Balance Rule

If you have not yet joined as a subscriber of the blog to receive DGI Alerts on the activity and content related to our model portfolio, it’s not too late. Click Here. 

Recent News 

Bank of Canada hikes rate as it seeks to cool resilient economy (Globe & Mail)

https://www.theglobeandmail.com/canada/article-morning-update-bank-of-canada-hikes-rate-as-it-seeks-to-cool-resilient/

“The Bank of Canada was forced to make a U-turn after Governor Tiff Macklem announced a “conditional pause” to interest-rate increases earlier this year when the central bank believed that borrowing costs were high enough to cool the economy and bring down inflation.”

Not a good sign! Makes you wonder if these guys really know what they are doing.

Happy bull-market days are here again – sort of (Globe & Mail)

https://www.theglobeandmail.com/investing/markets/inside-the-market/article-happy-bull-market-days-are-here-again-sort-of/

“Oops. Rather than slowing, the economy continued to roar ahead in the first quarter. In April, inflation ticked higher, not lower. The Bank of Canada was forced to acknowledge in a statement on Wednesday that “concerns have increased” that inflation could “get stuck materially above the 2-per-cent target.” So it decided to make a U-turn and start raising interest rates again.”

Be careful what you glean from the financial news. This article correctly states that nobody really knows which way the economy is headed but if you stopped reading at the headline you may have missed the message from the article.

We continue to take advantage of the sensible prices a downward market provides by continuing to build our model portfolio and enjoy the rising income from our dividends. In case you missed it, the author did give a shout out to dividend stocks near the end of the article but as usual fails to differentiate between dividend growth stocks and dividend stocks.

To receive breaking news about companies on ‘The List’ follow us on Twitter @MagicPants_DGI.

The List (2023)

Last updated by BM on June 9, 2023

The Magic Pants List contains 27 Canadian dividend growth stocks. ‘The List’ contains Canadian companies that have raised their dividend yearly for at least the last ten years and have a market cap of over a billion dollars. Below is each stock’s symbol, name, current yield, current price, price return year-to-date, current dividend, dividend growth year-to-date and current dividend growth streak. Companies on ‘The List’ are added or subtracted once a year, on January 1. After that, ‘The List’ is set for the next twelve months. Prices and dividends are updated weekly.

SYMBOL COMPANY YLD PRICE YTD % DIV YTD % STREAK
AQN-N Algonquin Power & Utilities 5.9% $8.65 28.5% $0.51 -29.0% 12
ATD-T Alimentation Couche-Tard Inc. 0.9% $64.58 7.4% $0.56 19.1% 13
BCE-T Bell Canada 6.2% $61.37 1.9% $3.82 5.0% 14
BIP-N Brookfield Infrastructure Partners 4.4% $36.93 5.2% $1.44 6.3% 15
CCL-B-T CCL Industries 1.7% $63.01 8.5% $1.06 10.4% 21
CNR-T Canadian National Railway 2.1% $152.41 -6.4% $3.16 7.8% 27
CTC-A-T Canadian Tire 4.1% $167.46 14.2% $6.90 17.9% 12
CU-T Canadian Utilities Limited 5.0% $36.12 -2.2% $1.79 1.0% 51
DOL-T Dollarama Inc. 0.3% $83.03 4.0% $0.27 23.8% 12
EMA-T Emera 5.0% $55.33 5.2% $2.76 3.0% 16
ENB-T Enbridge Inc. 7.0% $50.62 -5.1% $3.55 3.2% 27
ENGH-T Enghouse Systems Limited 2.3% $36.81 3.1% $0.85 18.2% 16
FNV-N Franco Nevada 0.9% $145.81 5.5% $1.36 6.3% 15
FTS-T Fortis 3.9% $57.42 3.8% $2.26 4.1% 49
IFC-T Intact Financial 2.2% $198.29 1.3% $4.40 10.0% 18
L-T Loblaws 1.5% $116.46 -3.2% $1.74 10.3% 11
MGA-N Magna 3.5% $53.24 -7.4% $1.84 2.2% 13
MRU-T Metro 1.7% $70.16 -7.0% $1.21 10.0% 28
RY-T Royal Bank of Canada 4.3% $123.89 -3.2% $5.34 7.7% 12
SJ-T Stella-Jones Inc. 1.4% $63.79 28.7% $0.92 15.0% 18
STN-T Stantec Inc. 0.9% $81.42 24.6% $0.77 8.5% 11
TD-T TD Bank 4.9% $79.12 -9.8% $3.84 7.9% 12
TFII-N TFI International 1.3% $105.00 4.9% $1.40 29.6% 12
TIH-T Toromont Industries 1.6% $105.31 7.8% $1.68 10.5% 33
TRP-T TC Energy Corp. 6.7% $55.25 3.7% $3.69 3.4% 22
T-T Telus 5.6% $25.30 -3.9% $1.43 7.3% 19
WCN-N Waste Connections 0.8% $135.83 3.1% $1.02 7.4% 13
Averages 3.2% 4.2% 8.4% 19

Six Canadian stocks on ‘The List’ declare earnings and dividends in US dollars and are inter-listed on a US exchange in US dollars. The simplest way to display dividend and price metrics for these stocks is to show their US exchange symbols along with their US dividends and price. The stocks I am referring to have a -N at the end of their symbols. You can still buy their Canadian counterparts (-T), but your dividends will be converted into CDN dollars and will fluctuate based on the exchange rate.

Note: When the dividend and share price currency match, the calculation is straightforward. But it’s not so simple when the dividend is declared in one currency, and the share price is quoted in another. Dividing the former by the latter would produce a meaningless result because it’s a case of apples and oranges. To calculate the yield properly, you must express the dividend and share price in the same currency.

Performance of ‘The List’

Feel free to click on this link, ‘The List’ for a sortable version from our website.

Last week, ‘The List’ was down slightly with a YTD price return of +4.2% (capital). Dividend growth remained the same and is now at +8.4% YTD, highlighting growth in income over the past year.

The best performers last week on ‘The List’ were Magna (MGA-N), up +4.03%; Stella-Jones Inc. (SJ-T), up +3.99%; and Algonquin Power & Utilities (AQN-N), up +1.41%.

TFI International (TFII-N) was the worst performer last week, down -4.93%.


Dividend Increases

“The growth of dividend paying ability is of significance in the determination of a stock’s quality, or general safety…”

– Arnold Bernhard (the founder of Value Line)

“As a dividend increase is a positive sign of a company’s financial strength, the safest purchase, after research, is a stock with a recent dividend increase.”

– Tom Connolly (the founder of dividendgrowth.ca)

Last week, no dividend increases from companies on ‘The List’.


Earnings Releases

Benjamin Graham once remarked that earnings are the principal factor driving stock prices.

Each quarter we will provide readers with weekly earnings updates of stocks on ‘The List’ during the calendar earnings season. 

The updated earnings calendar can be found here.

Earnings growth and dividend growth tend to go hand in hand, so this information can tell us a lot about the future dividend growth of our quality companies. Monitoring our dividend growers periodically is part of the process, and reading the quarterly earnings releases is a good place to start.

One earnings report from companies on ‘The List’ this week

Enghouse Systems Limited (ENGH-T) will release its second-quarter fiscal 2023 results on Monday, June 12, 2023, after markets close.

Last week, one earnings report from companies on ‘The List’.

Dollarama Inc. (DOL-T) released its first-quarter fiscal 2024 results on Wednesday, June 7, 2023, before markets opened.

“Canadians from all walks of life continue to respond positively to our compelling value proposition and affordable product mix. In the context of persistent inflationary pressure, we delivered a 17% increase in comparable store sales in the first quarter of Fiscal 2024. The first quarter also marked the opening of our 1,500th Dollarama store, a significant milestone as we pursue our target of 2,000 stores across Canada by 2031.”

– Neil Rossy, President and Chief Executive Officer

Highlights:

  • 1% increase in comparable store sales
  • 1% growth in EBITDA to $366.3 million, representing 28.3% of sales
  • 6% increase in diluted net earnings per share
  • Publication of comprehensive annual 2023 ESG Report in alignment with SASB standards and TCFD recommendations

Outlook:

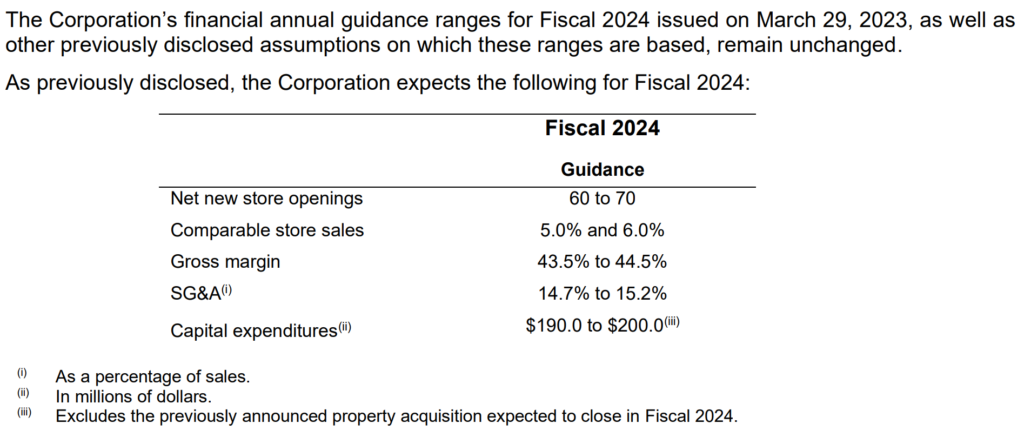
These guidance ranges are based on several assumptions, including the following:

  • The number of signed offers to lease and store pipeline for the next nine months and the absence of delays outside of our control on construction activities
  • No material increases in occupancy costs in the short to medium term
  • Continued positive customer response to our product offering, value proposition and in-store merchandising
  • Approximately three months of visibility on open orders and product margins
  • The active management of product margins, including through pricing strategies and refreshing some of the product offering
  • The continued stabilisation of our supply chain and logistics environment
  • The inclusion of the Corporation’s share of net earnings of its equity-accounted investment
  • The entering into of foreign exchange forward contracts to hedge the majority of forecasted purchases of merchandise in U.S. dollars against fluctuations of the Canadian dollar against the U.S. dollar
  • The continued execution of in-store productivity initiatives and the realization of cost savings and benefits aimed at improving operating expense
  • The absence of a significant shift in labour, economic and geopolitical conditions or material changes in the retail competitive environment
  • No significant changes in the capital budget for Fiscal 2024 for new store openings, maintenance capital expenditures, and transformational capital expenditures, the latter being mainly related to information technology projects and which budget excludes the purchase price for the previously announced property acquisition
  • The successful execution of our business strategy
  • The absence of pandemic-related restrictions impacting consumer shopping patterns or incremental direct costs related to health and safety measures
  • The absence of unusually adverse weather, especially in peak seasons around major holidays and celebrations

Many factors could cause actual results, level of activity, performance or achievements or future events or developments to differ materially from those expressed or implied by the forward-looking statements. This guidance, including the various underlying assumptions, is forward-looking and should be read in conjunction with the cautionary statement on forward-looking statements.

Source: (DOL-T) Q1-2024 Earnings Release

MP Market Review – June 2, 2023

Last updated by BM on June 5, 2023

Summary 

  • This is a weekly installment of our MP Market Review series, which provides updates on the financial markets and Canadian dividend growth companies we monitor on ‘The List’.
  • Last week, ‘The List’ was up slightly with a YTD price return of +5.1% (capital). Dividend growth remained the same and is now at +8.4% YTD, highlighting growth in income over the past year.
  • Last week, no dividend increases from companies on ‘The List’.
  • Last week, no earnings reports from companies on ‘The List’.
  • One company on ‘The List’ is due to report earnings this week.
  • If you’re interested in creating your own dividend growth income portfolio, consider subscribing to our premium service, which grants you access to the MP Wealth-Builder Model Portfolio (CDN) and exclusive subscriber-only content.  Learn More         

Introduction

“You have a pair of pants. In the left pocket, you have $100. You take $1 out of the left pocket and put it in the right pocket. You now have $101. There is no diminution of dollars in your left pocket. That is one magic pair of pants.”

This ‘magic pants’ analogy was from a Seeking Alpha article on dividend investing I read about a decade ago and was one of the catalysts for me to take a closer look at this type of investing and see if it truly was magical. 

After conducting additional research, I have shifted towards utilizing a dividend growth investing (DGI) strategy as my primary investment approach. While I maintain portfolios consisting of high-quality dividend growers from both the United States and Canada, I have opted to concentrate on Canadian (CDN) dividend growth companies in this blog. This is due to several reasons, including a smaller pool of DGI companies to track, a lack of coverage for the DGI strategy by the North American investment media, and a tendency for those who do cover DGI to narrowly focus on only a handful of sectors (Energy and Financials).

While ‘The List’ is not a portfolio in itself, it serves as an excellent initial reference for individuals seeking to diversify their investments and attain higher returns in the Canadian stock market. Through our blog, we provide weekly updates on ‘The List’ and offer valuable perspectives and real-life examples of the dividend growth investing strategy in practice. This helps readers gain a deeper understanding of how to implement and benefit from this investment approach.

DGI Thoughts

“Basically, price fluctuations have only one significant meaning for the true investor. They provide an opportunity to buy wisely when prices fall sharply and to sell wisely when they advance a great deal. At other times he will do better if he forgets about the stock market and pays attention to his dividend returns and to the operating results of his companies.”

-Benjamin Graham, Intelligent Investor C-8

Attempting to consistently time the market is an impossible feat. No individual can honestly claim to have succeeded in this task. Moreover, not only is timing the market unachievable, but it can also lead to poor investment returns.

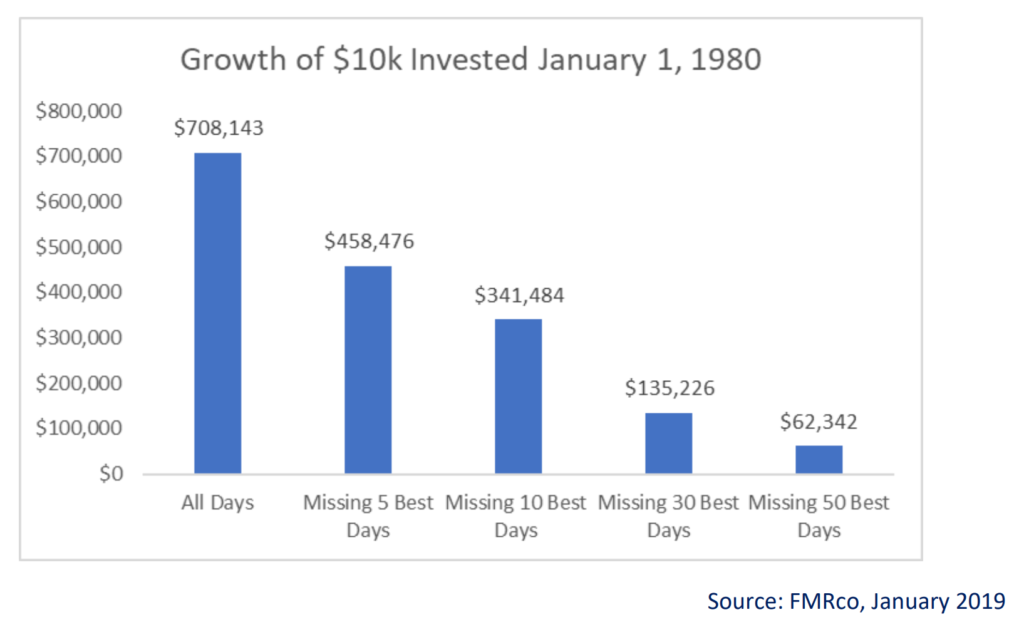
Maintaining confidence and staying invested can be challenging. During market corrections and recessions, there are often significant upswings that set new records. Since timing the market is famously difficult, panicked investors are prone to selling when their emotions are put to the test, often at the market’s bottom. While they may find solace in holding cash, missing out on the market’s subsequent best days during periods of volatility can have a detrimental impact on long-term savings.

As dividend growth investors we prefer to stay invested with only our positions sizes changing when our good dividend growers get a little pricey.

In the chart below, we look at the growth of $10k in the S&P 500 starting January 1, 1980, and the impact of missing out on the market’s best days.

We were fortunate that we listened to Graham’s advice. Forgetting about the stock market and paying attention to the dividend returns and operating results of our quality dividend growers has allowed us to outperform many other strategies.

If you have not yet joined as a subscriber of the blog to receive DGI Alerts on the activity and content related to our model portfolio, it’s not too late. Click Here. 

Recent News 

Rise of the tech giants exposes the problem of index distortions (Financial Times)

https://www.ft.com/content/e0176208-fa3e-453c-8a9d-0bca61af9cdf?desktop=true&segmentId=7c8f09b9-9b61-4fbb-9430-9208a9e233c8#myft:notification:daily-email:content

Mega market cap stocks are eating their indices, distorting their usefulness in some cases as market gauges for investors.”

This causes problems for investors who hold ETFs based on some of the more popular indices like the S&P 500 and Nasdaq. These indices are now dominated by only a few companies which makes them very different from their original forms.

By assembling your own dividend growth portfolio, you can control the mix of quality companies and their position sizes.

Telecom stocks may be down, but that doesn’t mean investors should disconnect (Globe & Mail)

https://www.theglobeandmail.com/investing/markets/inside-the-market/article-telecom-stocks-bce-telus-rogers/

“The Canadian wireless landscape has historically seen relatively disciplined behaviour from industry participants. However, we have seen periods of elevated competition and we believe that we are heading into another of these phases.

We often see articles like this which cause price pullbacks in the quality dividend growers we follow. Like the author, we see “rising competitive pressures may be more of a gift than a threat.” The author correctly points out that high telecom yields often act as a price floor for the stock price. Once a certain yield is reached the investing community tends to jump in and the price reverts. This is dividend yield theory in action.

To receive breaking news about companies on ‘The List’ follow us on Twitter @MagicPants_DGI.

The List (2023)

Last updated by BM on June 2, 2023

The Magic Pants List contains 27 Canadian dividend growth stocks. ‘The List’ contains Canadian companies that have raised their dividend yearly for at least the last ten years and have a market cap of over a billion dollars. Below is each stock’s symbol, name, current yield, current price, price return year-to-date, current dividend, dividend growth year-to-date and current dividend growth streak. Companies on ‘The List’ are added or subtracted once a year, on January 1. After that, ‘The List’ is set for the next twelve months. Prices and dividends are updated weekly.

SYMBOL COMPANY YLD PRICE YTD % DIV YTD % STREAK
AQN-N Algonquin Power & Utilities 5.9% $8.53 26.7% $0.51 -29.0% 12
ATD-T Alimentation Couche-Tard Inc. 0.8% $67.67 12.5% $0.56 19.1% 13
BCE-T Bell Canada 6.2% $61.38 1.9% $3.82 5.0% 14
BIP-N Brookfield Infrastructure Partners 4.4% $36.78 5.2% $1.44 6.3% 15
CCL-B-T CCL Industries 1.7% $63.18 8.8% $1.06 10.4% 21
CNR-T Canadian National Railway 2.0% $157.98 -3.0% $3.16 7.8% 27
CTC-A-T Canadian Tire 4.1% $168.29 14.8% $6.90 17.9% 12
CU-T Canadian Utilities Limited 4.9% $36.55 -1.1% $1.79 1.0% 51
DOL-T Dollarama Inc. 0.3% $83.48 4.5% $0.27 23.8% 12
EMA-T Emera 4.9% $56.55 7.5% $2.76 3.0% 16
ENB-T Enbridge Inc. 7.1% $50.26 -5.8% $3.55 3.2% 27
ENGH-T Enghouse Systems Limited 2.2% $37.66 5.5% $0.85 18.2% 16
FNV-N Franco Nevada 0.9% $147.52 6.8% $1.36 6.3% 15
FTS-T Fortis 3.9% $57.64 4.2% $2.26 4.1% 49
IFC-T Intact Financial 2.2% $200.85 2.6% $4.40 10.0% 18
L-T Loblaws 1.5% $118.49 -1.5% $1.74 10.3% 11
MGA-N Magna 3.6% $51.18 -11.0% $1.84 2.2% 13
MRU-T Metro 1.7% $71.92 -4.7% $1.21 10.0% 28
RY-T Royal Bank of Canada 4.3% $124.06 -3.1% $5.34 7.7% 12
SJ-T Stella-Jones Inc. 1.5% $61.34 23.7% $0.92 15.0% 18
STN-T Stantec Inc. 0.9% $81.36 24.5% $0.77 8.5% 11
TD-T TD Bank 4.9% $78.89 -10.0% $3.84 7.9% 12
TFII-N TFI International 1.3% $110.45 10.3% $1.40 29.6% 12
TIH-T Toromont Industries 1.6% $108.32 10.9% $1.68 10.5% 33
TRP-T TC Energy Corp. 6.7% $55.23 3.6% $3.69 3.4% 22
T-T Telus 5.6% $25.73 -2.2% $1.43 7.3% 19
WCN-N Waste Connections 0.7% $139.49 5.9% $1.02 7.4% 13
Averages 3.2% 5.1% 8.4% 19

Six Canadian stocks on ‘The List’ declare earnings and dividends in US dollars and are inter-listed on a US exchange in US dollars. The simplest way to display dividend and price metrics for these stocks is to show their US exchange symbols along with their US dividends and price. The stocks I am referring to have a -N at the end of their symbols. You can still buy their Canadian counterparts (-T), but your dividends will be converted into CDN dollars and will fluctuate based on the exchange rate.

Note: When the dividend and share price currency match, the calculation is straightforward. But it’s not so simple when the dividend is declared in one currency, and the share price is quoted in another. Dividing the former by the latter would produce a meaningless result because it’s a case of apples and oranges. To calculate the yield properly, you must express the dividend and share price in the same currency.

Performance of ‘The List’

Feel free to click on this link, ‘The List’ for a sortable version from our website.

Last week, ‘The List’ was up slightly with a YTD price return of +5.1% (capital). Dividend growth remained the same and is now at +8.4% YTD, highlighting growth in income over the past year.

The best performers last week on ‘The List’ were Stantec Inc. (STN-T), up +2.95%; Enbridge Inc. (ENB-T), up +2.89%; and Algonquin Power & Utilities (AQN-N), up +2.77%.

CCL Industries (CCL-B-T) was the worst performer last week, down -3.70%.


Dividend Increases

“The growth of dividend paying ability is of significance in the determination of a stock’s quality, or general safety…”

– Arnold Bernhard (the founder of Value Line)

“As a dividend increase is a positive sign of a company’s financial strength, the safest purchase, after research, is a stock with a recent dividend increase.”

– Tom Connolly (the founder of dividendgrowth.ca)

Last week, no dividend increases from companies on ‘The List’.


Earnings Releases

Benjamin Graham once remarked that earnings are the principal factor driving stock prices.

Each quarter we will provide readers with weekly earnings updates of stocks on ‘The List’ during the calendar earnings season. 

The updated earnings calendar can be found here.

Earnings growth and dividend growth tend to go hand in hand, so this information can tell us a lot about the future dividend growth of our quality companies. Monitoring our dividend growers periodically is part of the process, and reading the quarterly earnings releases is a good place to start.

One earnings report from companies on ‘The List’ this week 

Dollarama Inc. (DOL-T) will release its first-quarter fiscal 2024 results on Wednesday, June 7, 2023, before markets open.

Last week, no earnings reports from companies on ‘The List’.
 

We buy quality individual dividend growth stocks when they are sensibly priced and hold for the growing income.