‘The List’ – Portfolio Review (May 2022)
Posted by BM on May 31, 2022
Each month we walk through our valuation process using a company on ‘The List’ that meets our minimum of 6.5% EPS Yield. The company we will review today is Royal Bank (RY-T).
A fair valuation is the second rule in our three-step process. Buying when our quality stocks are sensibly priced will help ensure our future investment returns meet our expectations. We rely heavily on the fundamentals analyzer software tool (FASTgraphs) to help us understand the operating results of the stocks we invest in and then read the company’s website for investor presentations and recent earnings reports to learn more.
In arriving at a sensible price, we use an earnings-determined market price. Emotions determine the market price in the short run, and earnings determine the price in the long run. Proper investing is all about taking advantage of long-run opportunities that the short-run imbalances give you.
Intro:
Royal Bank of Canada is one of the two largest banks in Canada. It is a diversified financial services company offering personal and commercial banking, wealth management services, insurance, corporate banking, and capital markets services. The bank is concentrated in Canada, with additional operations in the U.S. and other countries.

Historical Graph:
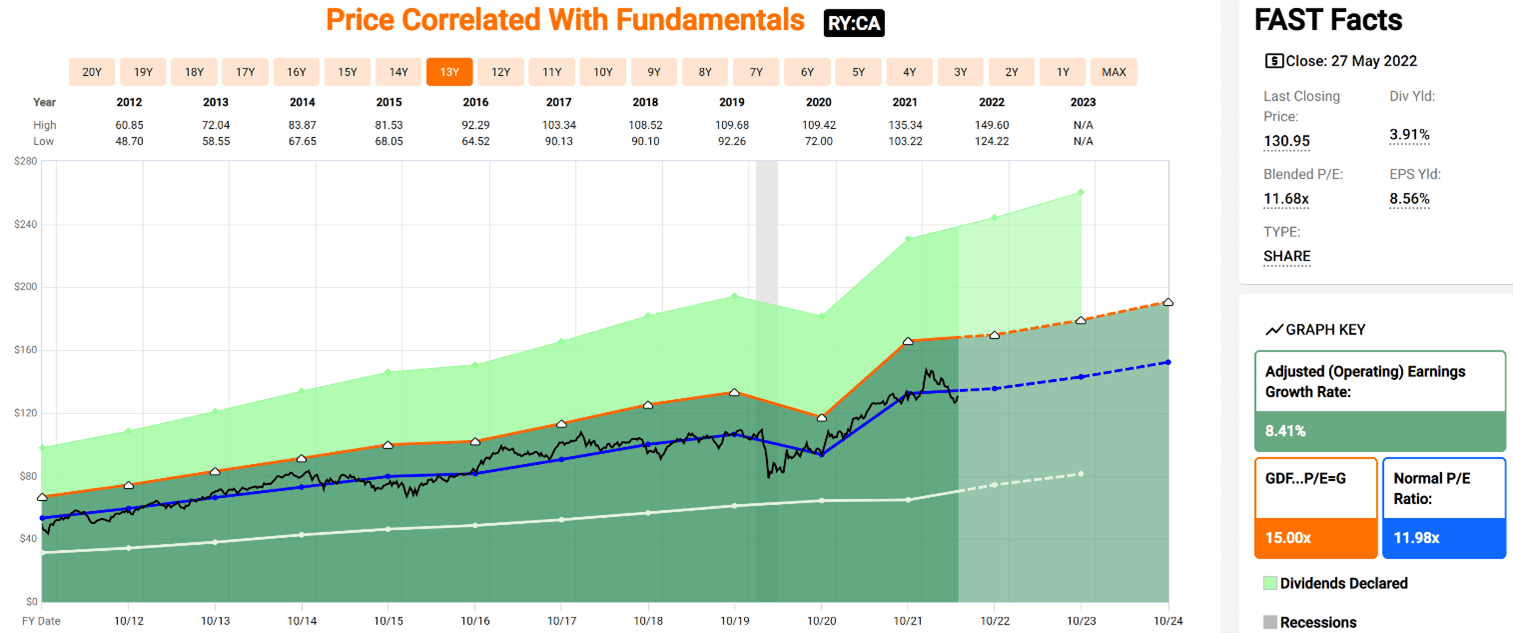
Comments:
Royal Bank has a narrow valuation corridor. The Black Line (Price) never strays too far from the Blue Line (Normal P/E). A price below the average P/E line has historically been a good entry point for RY-T.
The fundamentals show a company whose annualized earnings have grown steadily over the last ten years at ~8.41%.
Dividend/Price Growth Alignment:

Comments:
We talk a lot in our blog about dividend growth and price growth alignment over the longer term. RY-T is one of those companies that follow this pattern. We like to see our income and capital double over ten years. These graphs show that the price growth is currently slightly ahead of dividend growth, a sign of overvaluation.
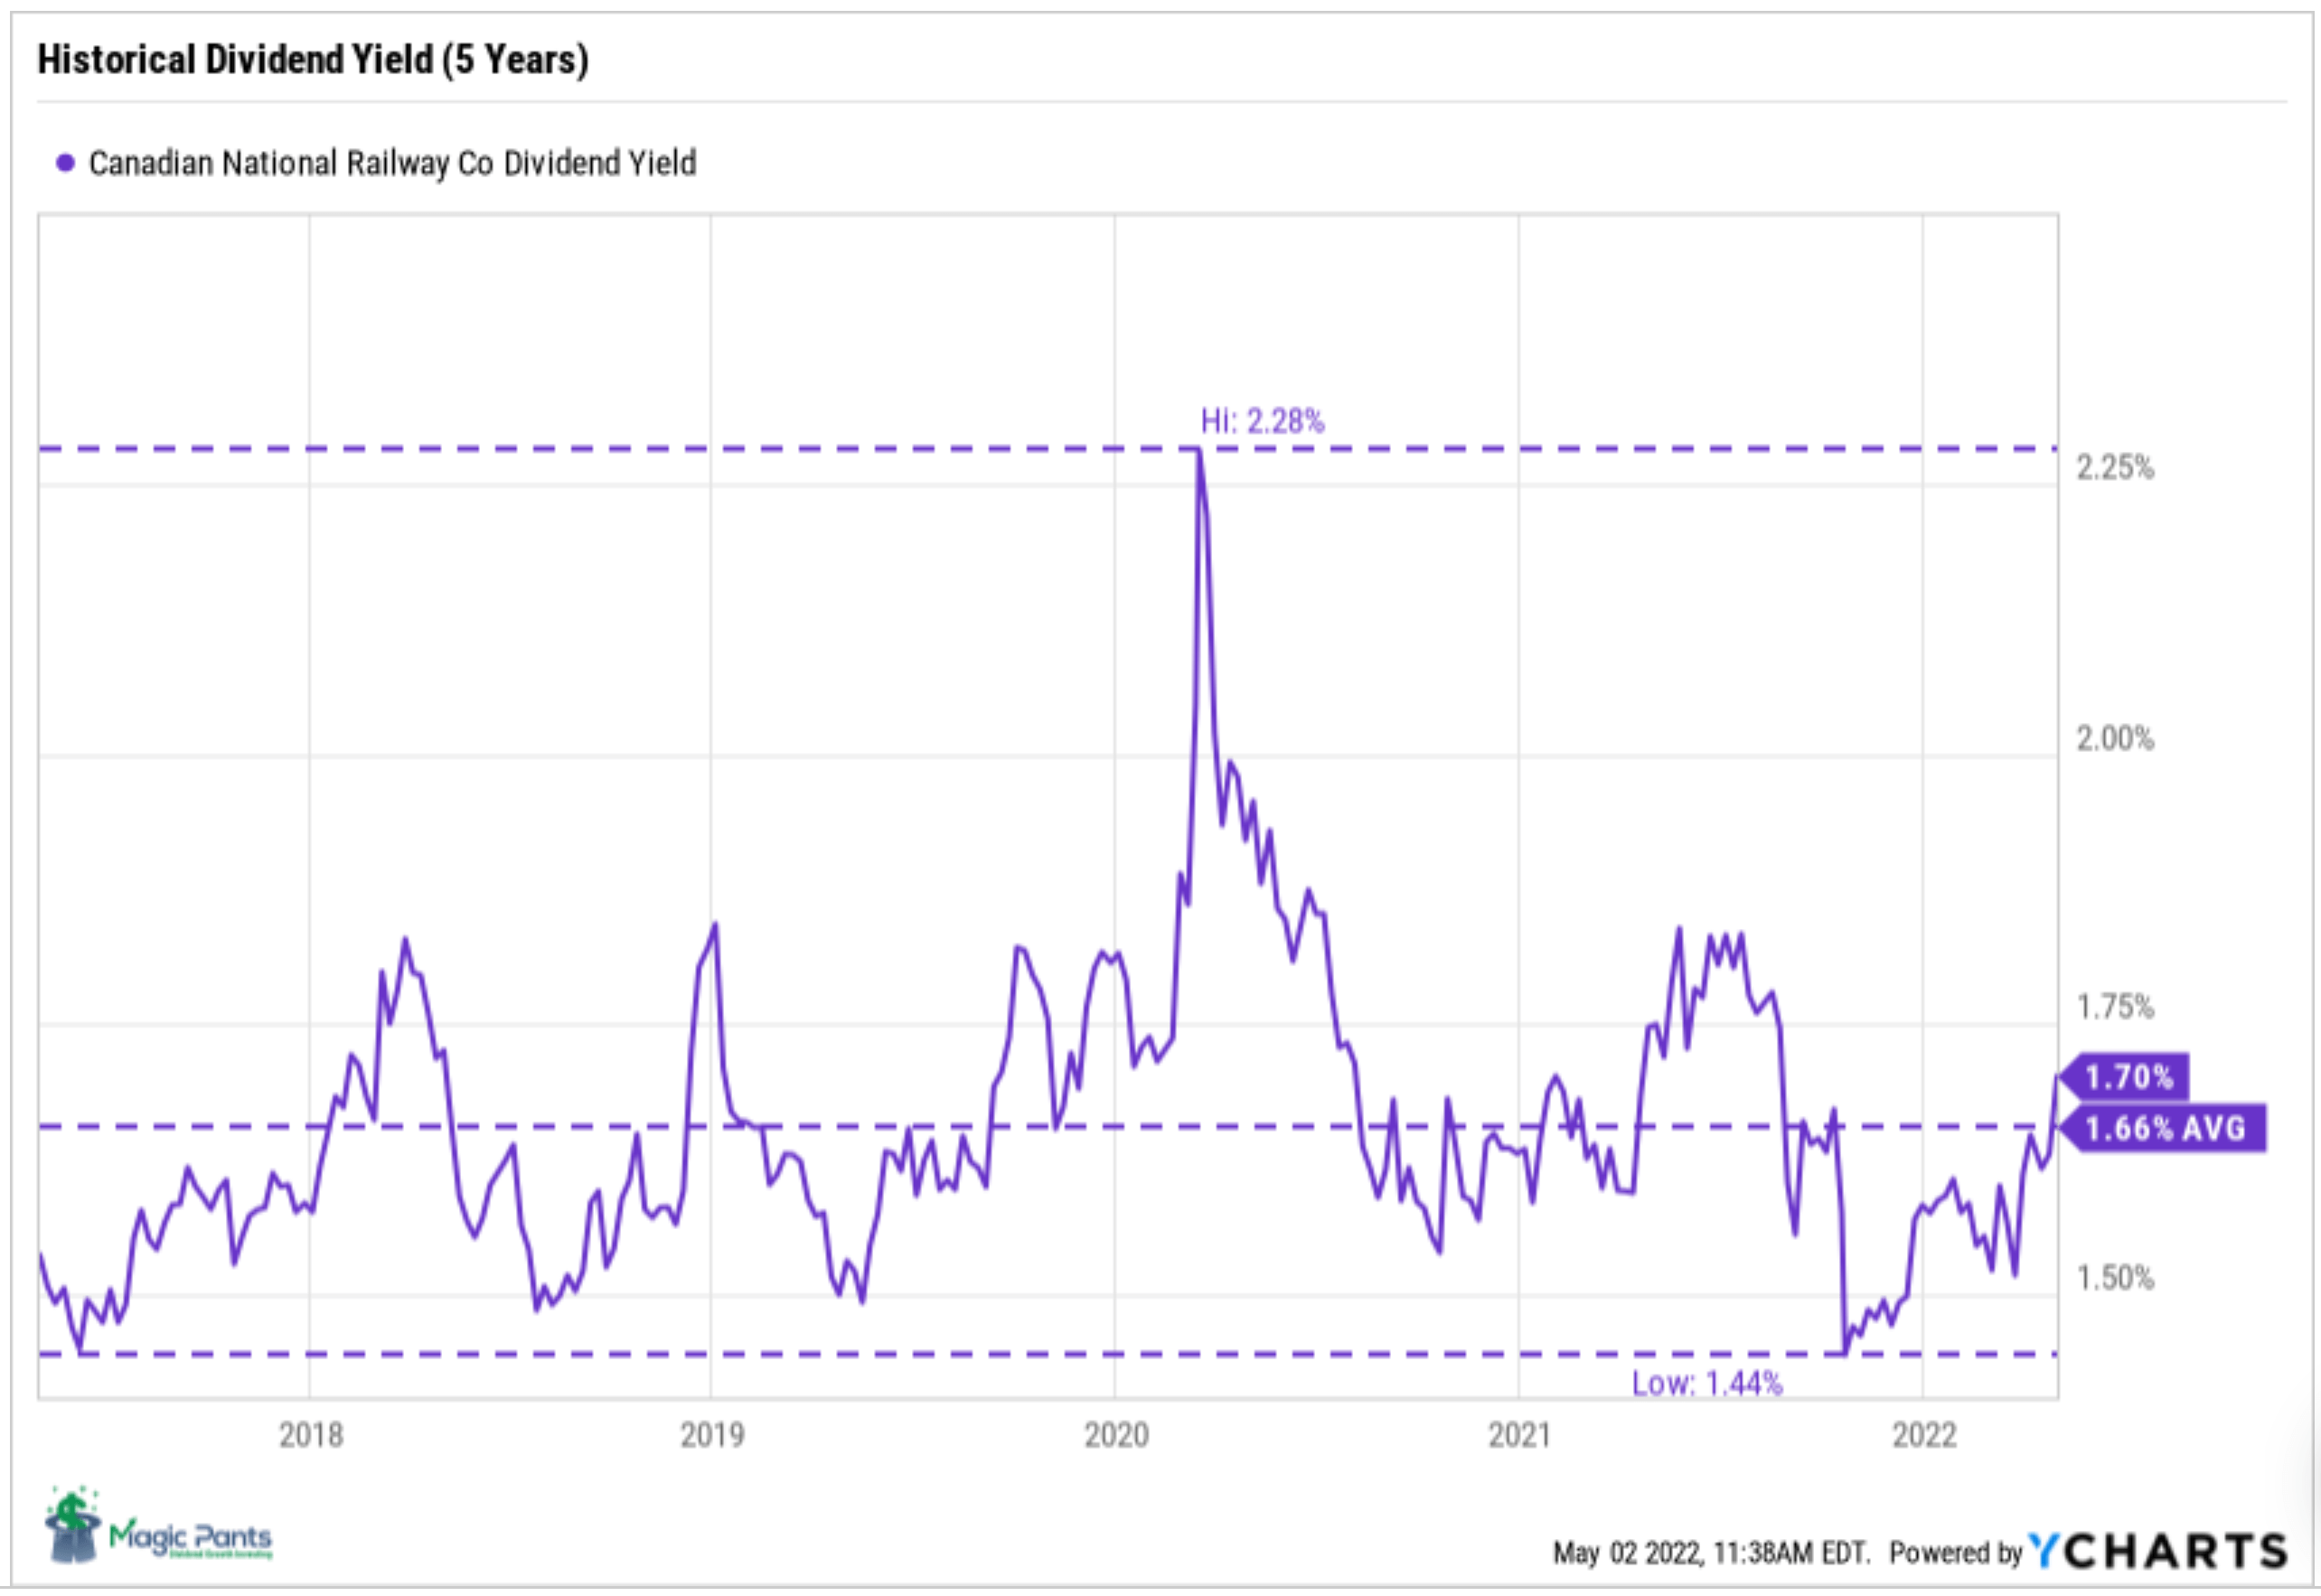
Yield Chart:
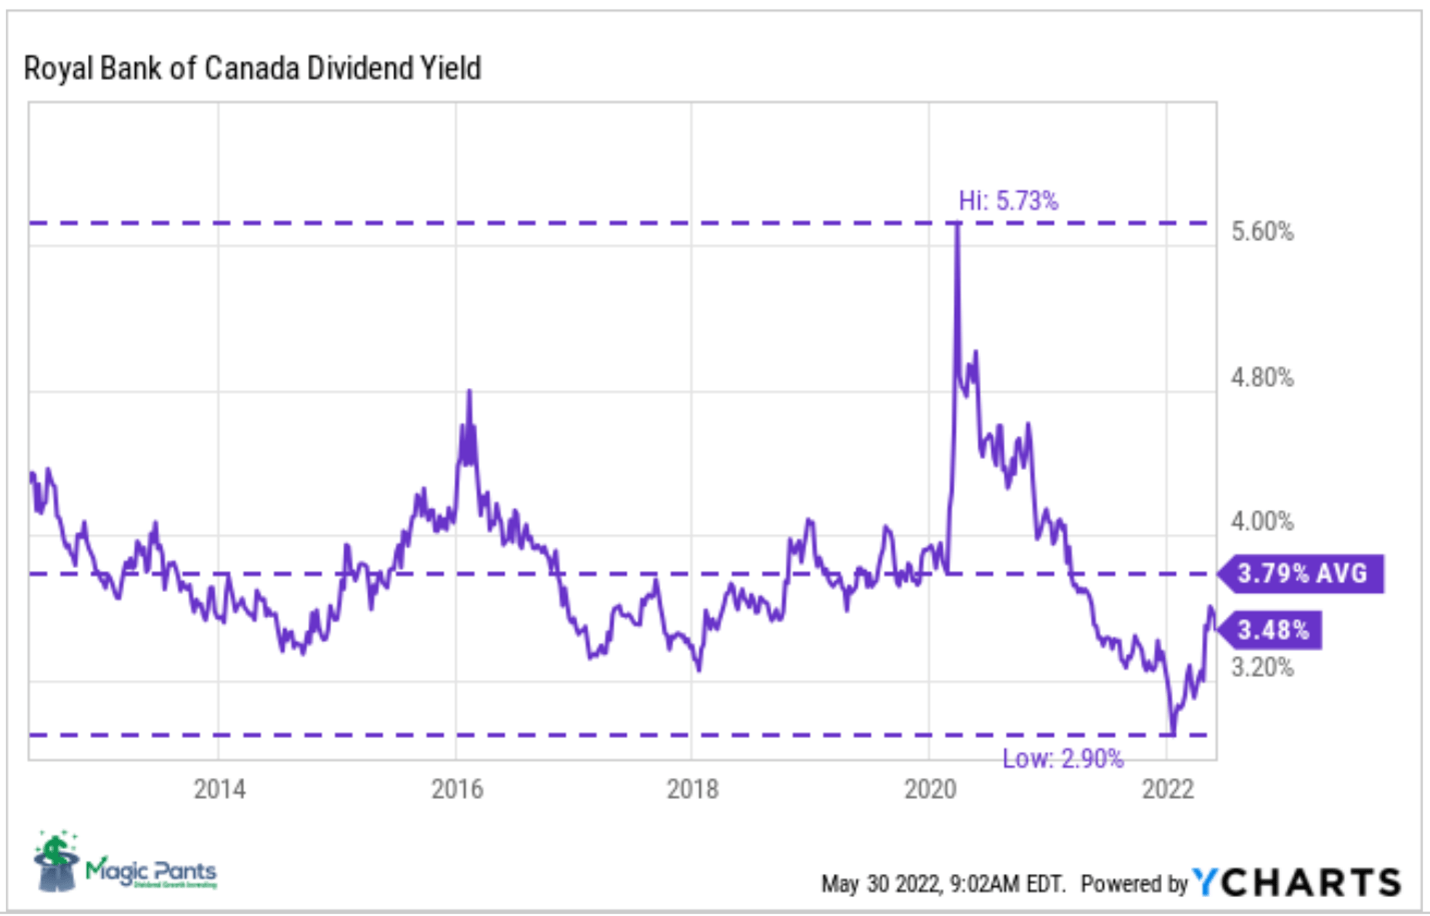
Comments:
Popularized by Investment Quality Trends (IQT) in the 1960s, ‘Dividend Yield Theory’ is simple and intuitive. It says that for quality dividend growth stocks, meaning those with stable business models that don’t significantly change over time, dividend yields tend to revert to the mean.
In the case of Royal Bank, the dividend is not quite at its average ten-year historical yield of 3.79%. This conveys that RY-T is slightly overvalued based on today’s price. A five-year chart will show similar overvaluation.
Performance Graph:
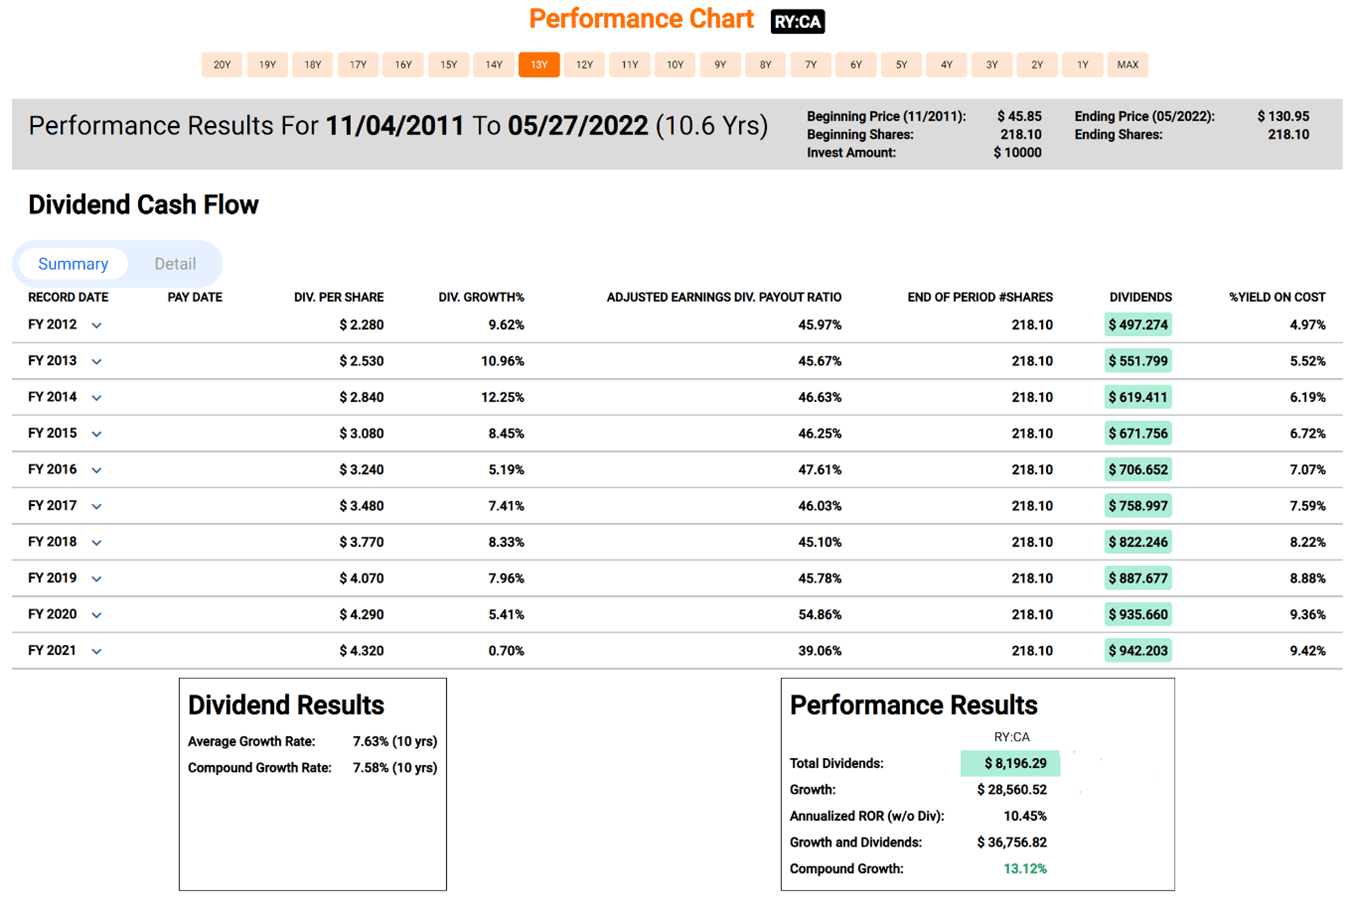
Comments:
Royal Bank has had an average annualized dividend growth rate of 7.63% over the last ten years. The company also has an annualized total return of 13.12% over that same period. RY-T recently announced a dividend increase of ~7.0%, bringing their 2022 growth rate to 14.8%. This increase helps make up for the restrictions imposed in March of 2020 by regulators not to allow banks and insurers to raise dividends or do share buybacks due to the stimulus provided by the Bank of Canada during the pandemic.
Estimated Earnings:
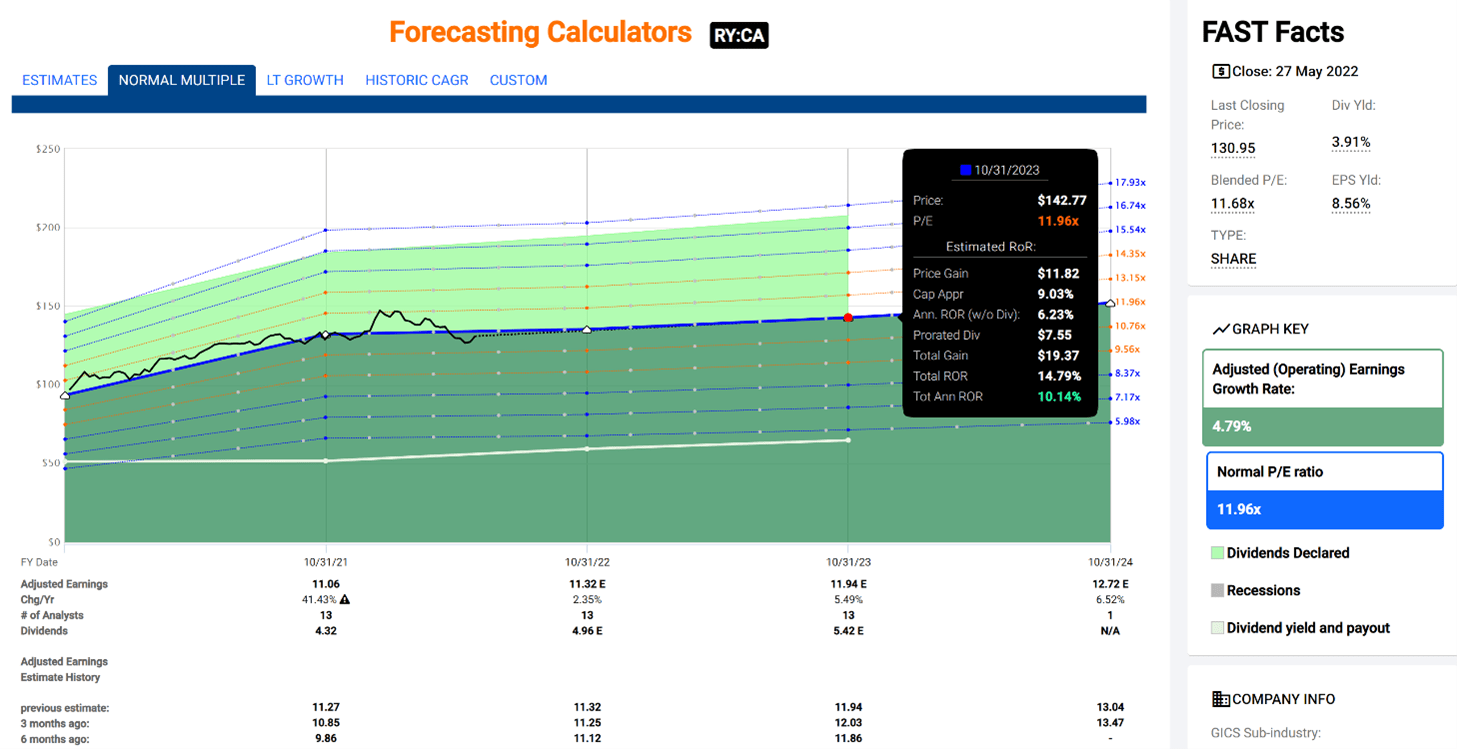
Comments:
Using the “Normal Multiple’ estimating tool from FASTgraphs, we see a blended P/E average over the last five years of 11.68. Based on Analysts’ forecasts one and a half years out, they are estimating an annualized return, based on today’s price, of 10.14% should RY-T trade at its five-year average blended P/E.
Blended P/E is based upon a weighted average of the most recent actual value and the closest forecast value.
Of importance is that analysts have been revising their estimates for 2023 and beyond downwards recently. This year, analysts do not see a pullback in earnings but are being a bit cautious on earnings growth for RY-T twelve to eighteen months out.
Analyst Scorecard:

Comments:
Analyst performance on hitting estimates over the years is above average on one and two-year earnings projections. Analysts’ forecasts have hit or beat ~85% of the time on one-year estimates and ~92% on two-year forecasts.
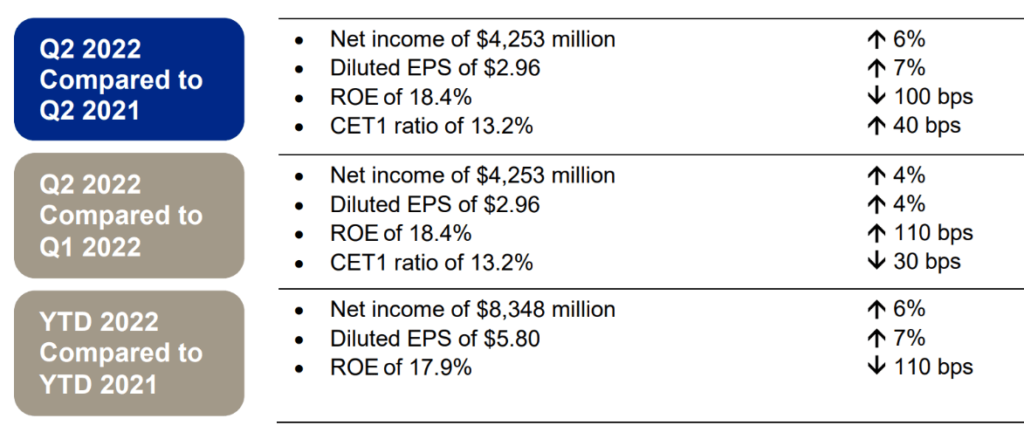
Recent Earnings Report-Q2 2022:
“The resilience of our diversified business model, prudent risk and capital management, and strategic investments in talent and technology continued to define our performance in the second quarter. We remain well-positioned for future growth, and to deliver differentiated long-term value for our clients, employees and shareholders. At a time when geopolitical tensions, inflationary pressures and global supply chain issues are creating an uncertain macroeconomic backdrop, I’m proud of how RBC employees continue to drive positive change in our communities and deliver trusted advice and insights for those we serve. We will continue to leverage our scale and financial strength, and the powerful combination of our people and culture, to play a leading role in shaping a thoughtful transition to net zero and an inclusive post-pandemic future.”
– Dave McKay, RBC President and Chief Executive Officer
Highlights:

Outlook:
“Inflation has surged higher and unemployment rates have continued to fall, prompting central banks in Canada, the U.S. and the United Kingdom (U.K.) to increase interest rates and to reduce asset holdings. The conflict between Russia and Ukraine has exacerbated global supply chain challenges and pushed key commodity prices higher, intensifying inflationary pressures. The economic impact from the COVID-19 pandemic has eased in most regions with recoveries in travel and hospitality sectors contributing to near-term growth momentum. However, the COVID-19 pandemic continues to impact goods manufacturing and supply, including economic disruptions in China resulting from stringent efforts to control virus spread. Low unemployment and strong demand for workers are driving wages higher. Central banks are expected to continue raising interest rates at the most aggressive pace in decades, which is expected to slow GDP growth later this year and into calendar 2023.”
Summary:
Royal Bank is a high-quality Canadian dividend growth stock, as shown by every metric we use to assess quality. Valuation is a little high based on today’s price but not frothy. Rising interest rates are generally suitable for bank stocks, but loan and mortgage defaults are not. Entering a position now is not a terrible idea, but given the volatility of the markets lately, we are hoping for a better entry point.