Last updated by BM on April 29, 2022
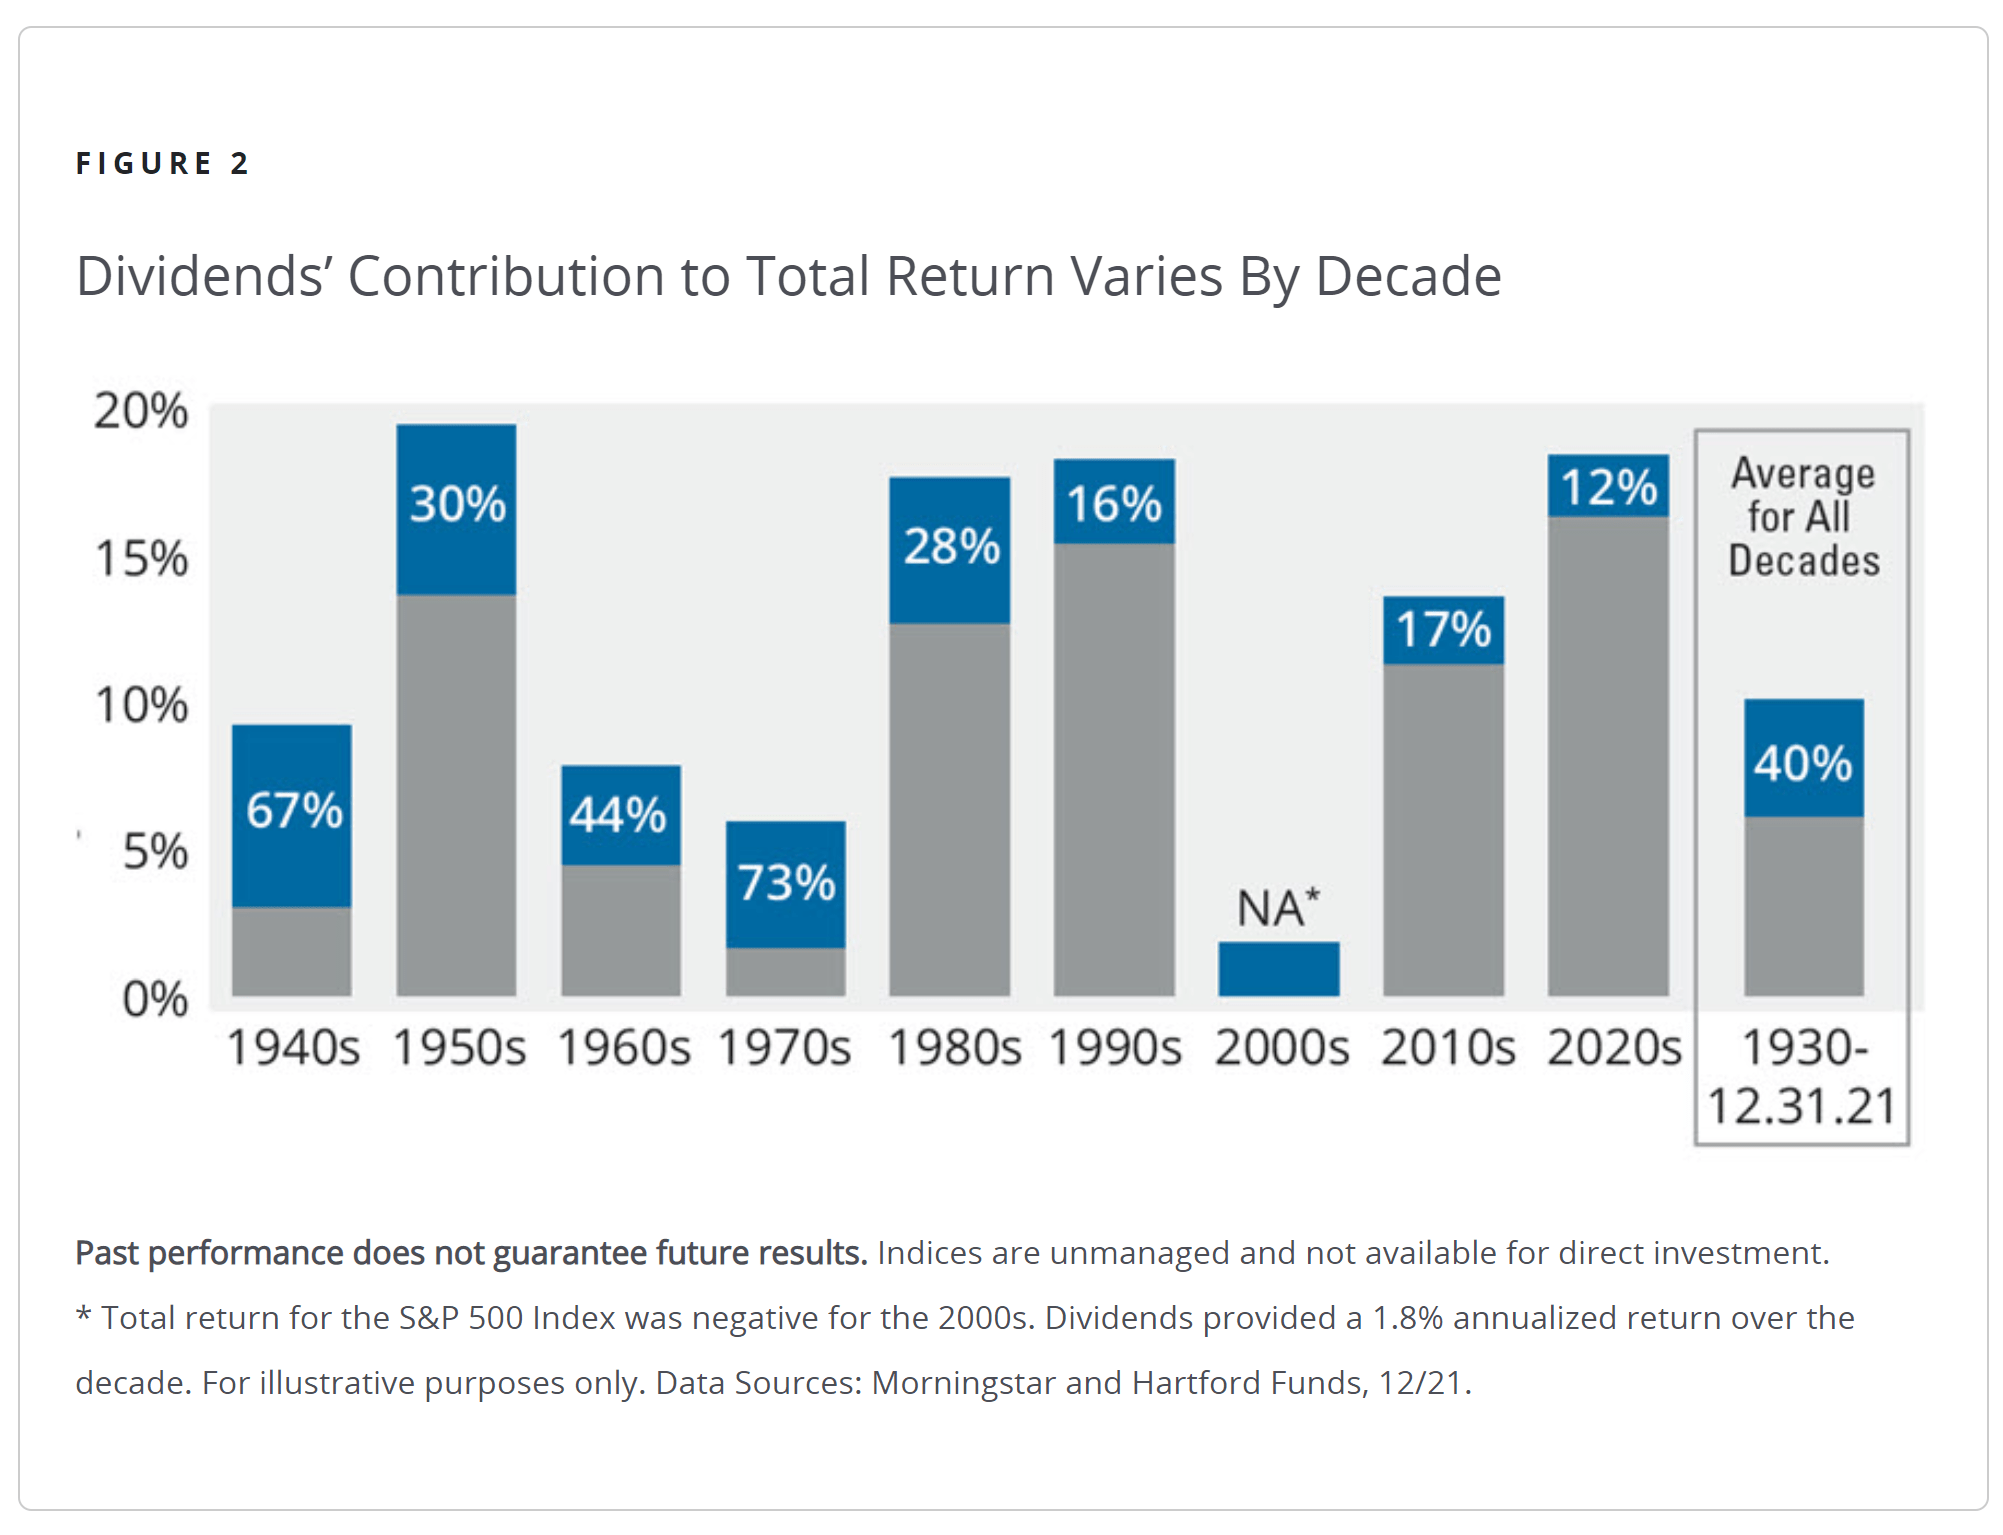
“From 2000 to 2009, a period often referred to as the “lost decade,” the S&P 500 Index produced a negative return. Largely as a result of the bursting of the dot-com bubble in March 2000, stock investors once again turned to fundamentals such as P/E ratios and dividend yields.” Hartford Funds
We couldn’t help but notice the uptick in the number of articles published on dividend and dividend growth investing (DGI) over the past few weeks. The tech stocks are officially in crash mode, and the likelihood of a further market pullback increases with each interest rate hike. Investors are looking for alternative strategies to weather the storm.
The ‘lost decade’ (2000-2009) first piqued our interest in DGI. As the quote at the top demonstrates, many mutual fund and index investors lost money over the course of that decade. We were in that camp. In the 1970s, which was our last period of high inflation, dividends accounted for 73% of the market’s total return.
Performance of ‘The List’
Last week, ‘The List’ was down with a minus -0.9% YTD price return (capital). Dividend growth of ‘The List’ remains at 9.2% YTD, demonstrating the rise in income over the last year.
The best performers last week on ‘The List’ were Enghouse Systems Limited (ENGH-T), up 2.0%; Metro (MRU-T), up 1.1%; and Alimentation Couche-Tard Inc. (ATD-T), up .9%.
TC Energy Corp. (TRP-T) was the worst performer last week, down -6.3%.
Recent News
Market Chatter: Alimentation Couche-Tard, EG Group in Deal Talks
“Two of the world’s biggest convenience-store chains are discussing a deal that would combine BP gas stations, roadside Starbucks, Circle K minimarts and Cumberland Farms grocery stores among a handful of other retail brands, The Wall Street Journal is reporting Friday.
It reported Alimentation Couche-Tard Inc. (ATD-T), which runs 7,000 convenience stores in the U.S. and as many abroad, and British retailer EG Group have traded proposals in recent weeks that would value EG at roughly US$16 billion or more including debt, people familiar with the matter said. The talks have so far failed to produce a deal and they may not lead to one, some of the people said.”
Alimentation Couche-Tard (ATD-T) is rumored to be involved in a few deals as of late. If the price is right, it could be a catalyst to the stock, or like their failed takeover bid for Carrefour last year, it could be an excellent time to load up on this quality dividend grower as we did in January 2021. Having a process prevents you from chasing all the market chatter. We have a sensible price in mind for (ATD-T) regardless of the short-term narrative.
Five reasons dividends are an investor’s best friend was an article in the Globe & Mail we read over the weekend.
The third reason will probably resonate with most people. Dividends keep you out of trouble. Buying quality companies with a growing dividend seems to have a built-in floor for stock prices. A rising yield attracts buyers, which limits the price downside. Quality dividend growth stocks have historically fared much better in bear markets than non-dividend paying stocks. Another reason dividend growth stocks keep you out of trouble is because you don’t ever have to sell them to raise income. The dividends take care of that.
Eight companies on ‘The List’ are due to report earnings this week.
Waste Connections (WCN-N) will release its first-quarter 2022 results on Tuesday, May 3, 2022, after markets close.
Brookfield Infrastructure Partners (BIP-N) will release its first-quarter 2022 results on Wednesday, May 4, 2002, before markets open.
Fortis Inc. (FTS-T) will release its first-quarter 2022 results on Wednesday, May 4, 2022, before markets open.
Loblaws (L-T) will release its first-quarter 2022 results on Wednesday, May 4, 2022, before markets open.
Franco Nevada (FNV-N) will release its first-quarter 2022 results on Wednesday, May 4, 2022, after markets close.
Bell Canada (BCE-T) will release its first-quarter 2022 results on Thursday, May 5, 2022, before markets open.
Telus (T-T) will release its first-quarter 2022 results on Friday, May 6, 2022, before markets open.
Enbridge Inc. (ENB-T) will release its first-quarter 2022 results on Friday, May 6, 2022, before markets open.
Dividend Increases
There were no companies on ‘The List’ that announced a dividend increase last week.
Earnings Releases
Last week was a busy week with six companies on ‘The List’ reporting their Q1 Fiscal 2022 earnings. Let’s get the ball rolling with (CNR-T).
Canadian National Railway (CNR-T)
“CN has an incredible tri-coastal network, the best on the continent. Our team of experienced railroaders demonstrated resilience in the first quarter, managing through severe winter weather conditions and supply chain disruptions to deliver solid results. I am encouraged by the cadence that we developed at the end of the quarter as we lifted out of winter operations. Looking ahead, our immediate focus is on restoring CN’s network to its full capacity and running a scheduled railroad with an emphasis on velocity. I am confident that we will have a strong year and deliver on our 2022 financial outlook.”
– Tracy Robinson, President and Chief Executive Officer, CN
Highlights:
- Revenues of C$3,708 million, an increase of C$173 million or 5%.
- Operating income of C$1,227 million, a decrease of 8%, and adjusted operating income of C$1,237 million, an increase of 4%.
- Diluted EPS of C$1.31, a decrease of 4%, and adjusted diluted EPS of C$1.32, an increase of 7%.
- Operating ratio, defined as operating expenses as a percentage of revenues, of 66.9%, an increase of 4.4-points, and adjusted operating ratio of 66.6%, an increase of 0.3-points.
- Free cash flow for the first three months of 2022 was C$571 million compared to C$539 million for the same period in 2021.
- Injury frequency rate improved by 18% and the accident rate increased by 93%.
- Car velocity (car miles per day) decreased by 12%.
- Fuel efficiency remained flat at 0.910 US gallons of locomotive fuel consumed per 1,000 gross ton miles (GTMs).
Outlook:
Due to challenging operating conditions in the first quarter as well as worldwide economic uncertainty, CN now expects to deliver approximately 15-20% adjusted diluted EPS growth (compared to its January 25, 2022 target of 20%). CN is now targeting an operating ratio below 60% for 2022 (compared to its January 25, 2022 target of approximately 57%) as well as approximately 15% of ROIC. CN is also now targeting free cash flow in the range of C$3.7 billion – C$4.0 billion in 2022 (compared to its January 25, 2022 target of approximately C$4.0 billion).
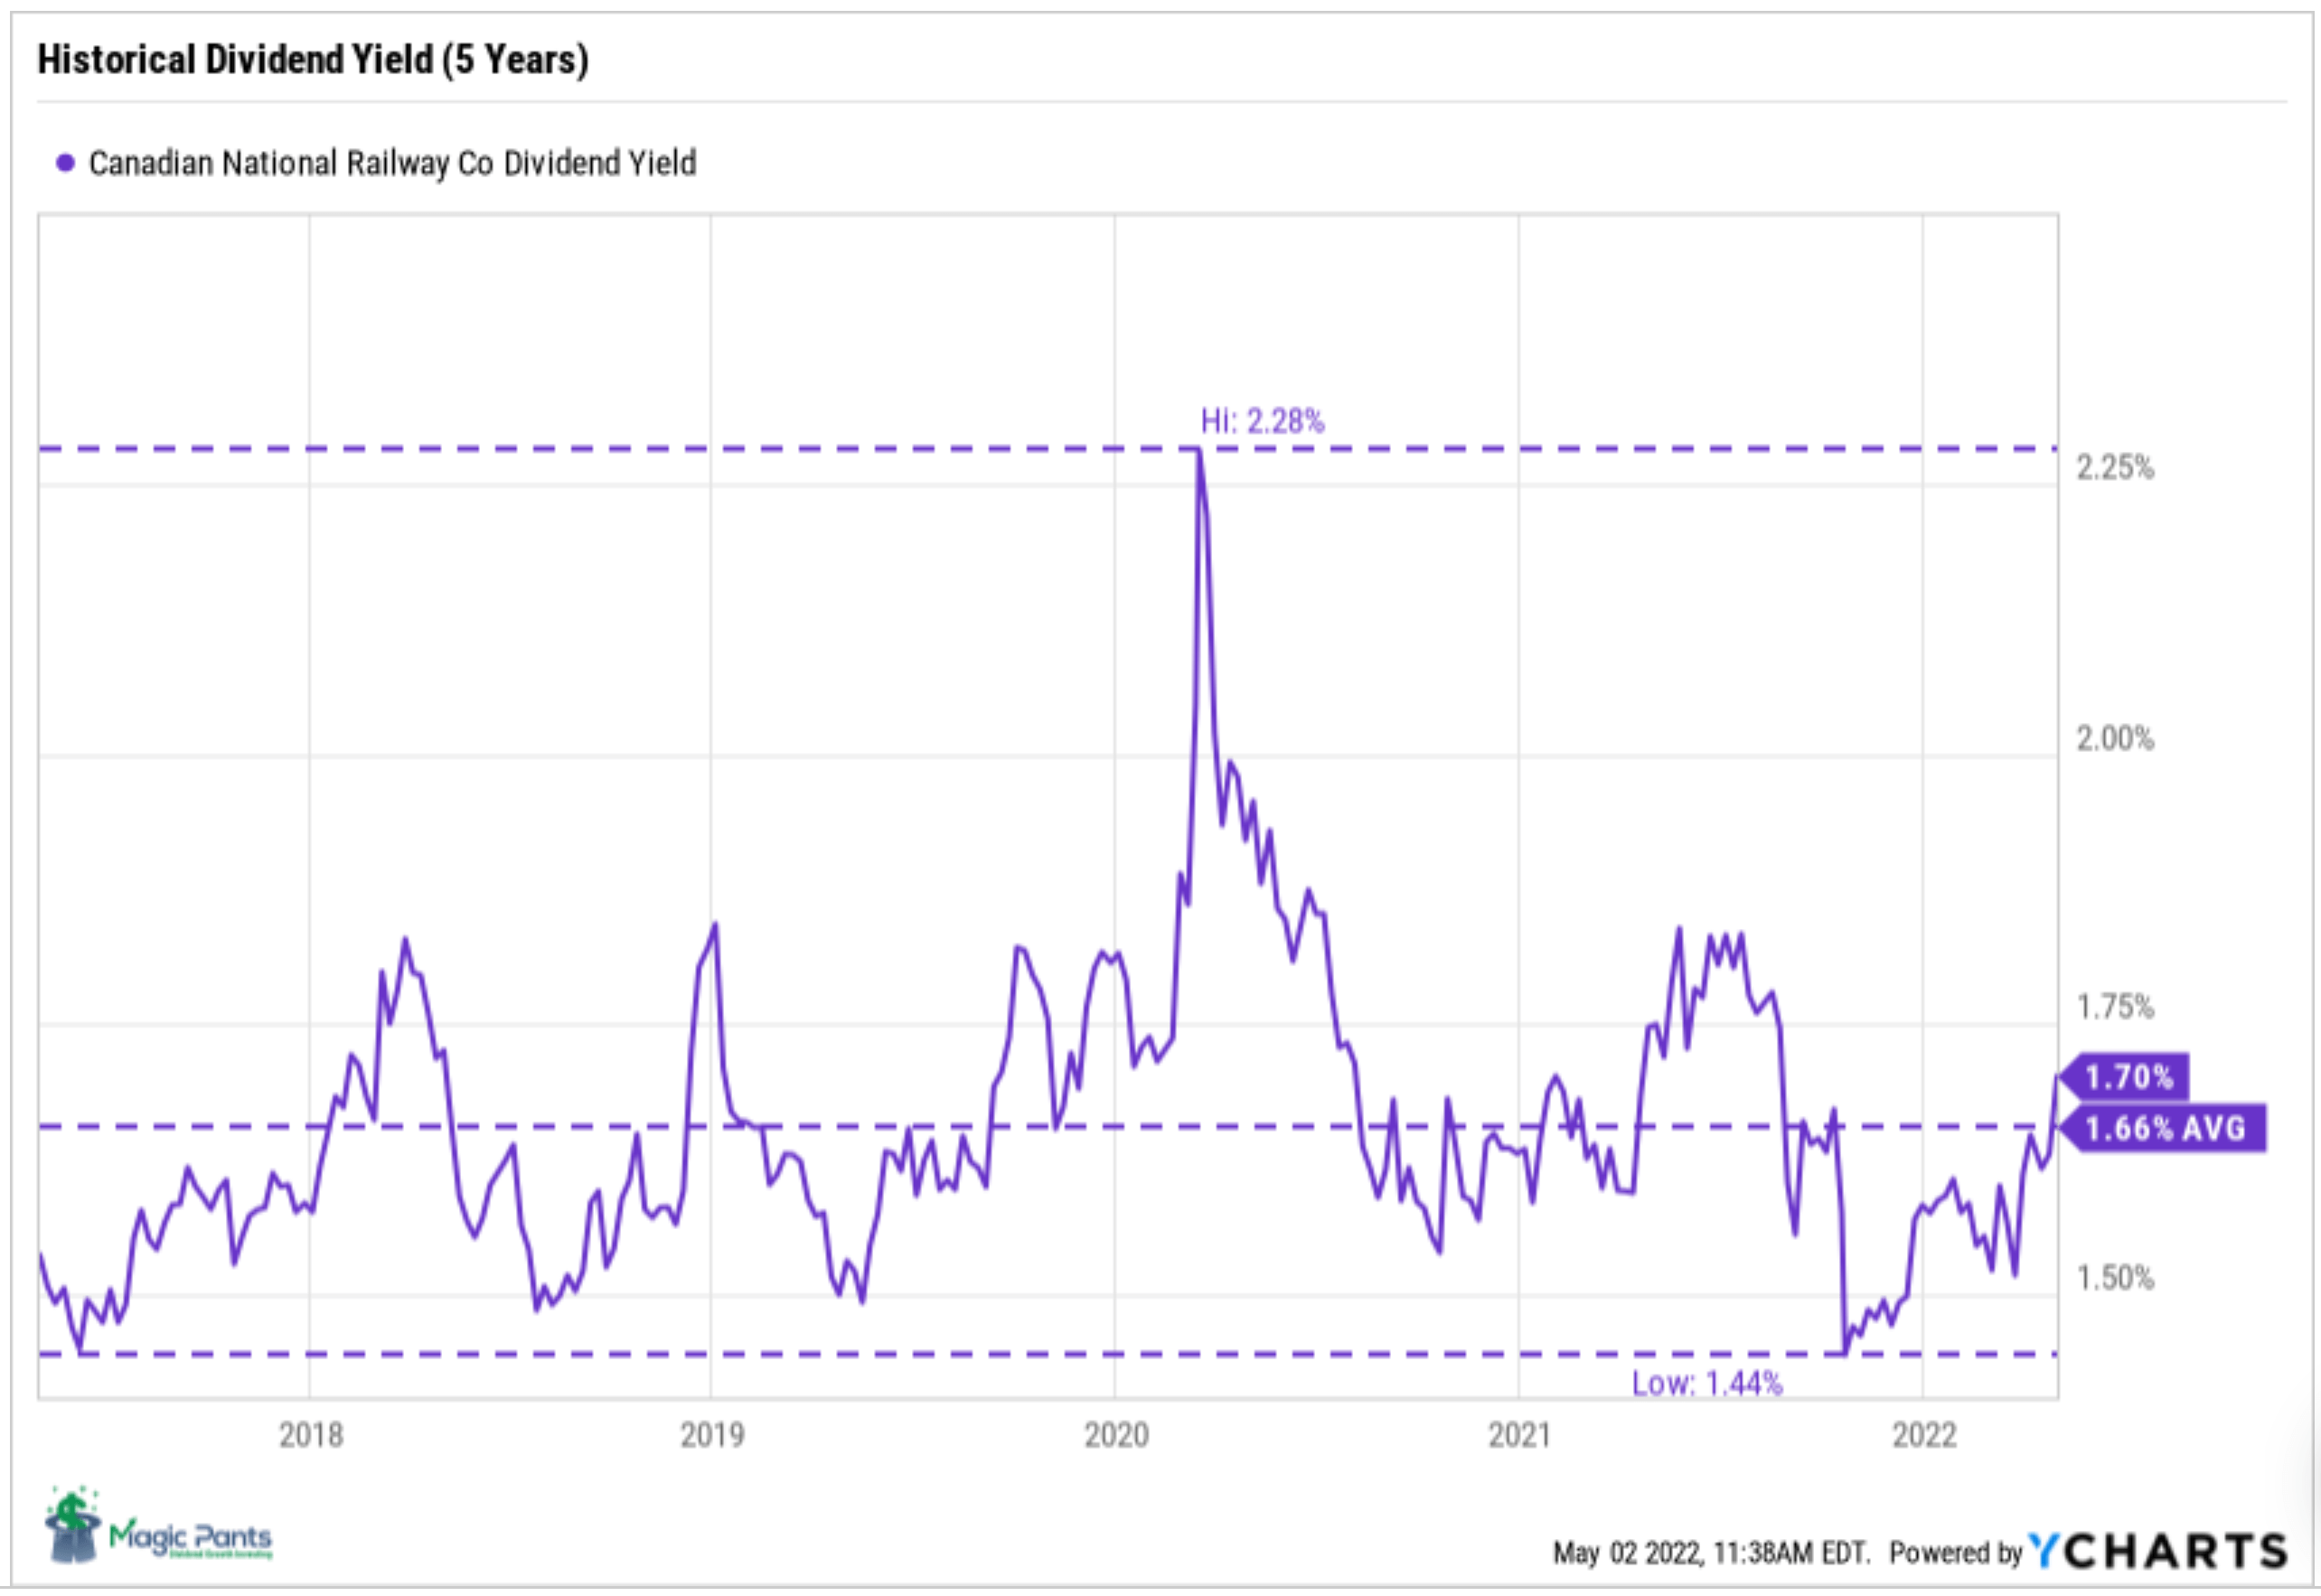
After reading Hunter Harrison’s book, Railroader, I learned a lot about operating ratios. According to Harrison, it is the gold standard in evaluating a railroad’s efficiency. In its earnings release, CNR-T has backed off its target of 57% and lowered its free cash flow range. The stock was a little pricey for us back at the beginning of 2022 but according to its historical dividend yield, it seems to be aligning itself better now.
Canadian Utilities (CU-T)
“Canadian Utilities achieved adjusted earnings of $219 million or $0.81 per share in the first quarter of 2022. This is $28 million or $0.11 per share higher than the first quarter of last year. The $28 million year-over-year increase in the first quarter earnings was a result of cost efficiencies, rate-based growth, and the timing of expenditures in our Alberta utilities, along with stronger contributions from our LUMA Energy investment, and our first full quarter of earnings from the Alberta Hub natural gas storage facility, which was acquired in December of 2021.
While our business overall performed very well in the first quarter of this year, this growth in year-over year earnings was primarily driven by the exceptional performance of our Alberta-based distribution utilities, the gas distribution utility in particular.”
Brian Shkrobot, EVP & CFO, Canadian Utilities
Highlights:
- On April 14, 2022, a joint settlement agreement was filed with the AUC with respect to the AUC enforcement proceeding with an agreed administrative penalty of $31 million. Customers were never impacted as these costs were not included in customer rates and the administrative penalty and excluded project costs will not be recovered from customers.
- Invested $263 million in capital projects of which 83 per cent was invested in regulated utilities and 17 per cent mainly in Energy Infrastructure.
- Entered into a share purchase agreement with Denendeh Investments Incorporated (DII) to increase DII’s ownership interest from 14 per cent to 50 per cent in Northland Utilities Enterprises Ltd. (NUE). NUE is an electric utility company operating in the Northwest Territories, Canada and a subsidiary of ATCO Electric Ltd. The transaction results in ATCO Electric Ltd. and DII each having a 50 per cent ownership interest in NUE and highlights our continued commitment to foster community ownership and self-sustaining economic development.
- Closed the transaction to transfer a 30-km segment of the Pioneer Natural Gas Pipeline to Nova Gas Transmission Ltd. for $63 million in the Natural Gas Transmission business on February 25, 2022.
- Announced a 15-year power purchase agreement with Microsoft Corporation to purchase all renewable energy generated by ATCO’s Deerfoot solar project in Calgary, Alberta. Once operational, the Deerfoot solar project will be one of the largest solar installations in a major urban centre in Western Canada, at 37-MW.
- On April 14, 2022, Canadian Utilities declared a second quarter dividend of 44.42 cents per share or $1.78 per Class A non-voting and Class B common share on an annualized basis.
(CU-T) is one of those companies that you can sleep well at night owning. It has the longest dividend growth streak in Canada (50 years)! It has an excellent starting yield but slow growth (less than 1% annually over the past ten years). The business seems to be doing well, but we like a few of the other utilities on ‘The List’ with more growth.
Always remember Jack Bogle’s formula for estimating returns, Future Market Returns = Dividend Yield + Earnings Growth +/- Change in P/E Ratio.
TFI International (TFII-N)
“The year is off to a strong start for TFI International as we capitalize on favorable trends across our highly diverse end markets and our own internal opportunities to drive synergies and operational enhancements,” said Alain Bédard, Chairman, President and Chief Executive Officer. “During the first quarter, we more than doubled both our operating income and adjusted diluted EPS, with favorable contributions from all four of our business segments thanks to the focus and dedication of our talented team across North America. Through adherence to TFI’s longstanding operating principles that emphasize continual focus on the customer, an asset-light approach, and ‘freight that fits’, we are confident in our ability to navigate uncertain economic times, while also executing on multiple opportunities to streamline operations and drive further synergies related to the ongoing successful integration of TForce Freight. During the quarter we also further bolstered our very solid balance sheet, even while investing in our fleet and returning capital to shareholders, which furthers our financial flexibility and opportunities to enhance long-term growth through attractive acquisitions.”
Highlights:
- First quarter operating income of $219.8 million increased 116% from $101.7 million in the same quarter prior year
- First quarter net income of $147.7 million increased 121% compared to $66.9 million in Q1 2021, while adjusted net income1 of $157.6 million increased 114% compared to $73.6 million in Q1 2021
- First quarter diluted earnings per share (diluted “EPS”) of $1.57 increased 124% compared to $0.70 in Q1 2021, while adjusted diluted EPS1 of $1.68 increased 118% compared to $0.77 in Q1
(TFII-N) has been a high growth company recently and is therefore a little bit more difficult to value than some of our other quality dividend growers. We wrote about (TFII-N) in our Portfolio Review-April (2022) article and not much has changed since then. We liked the earnings report but are cautious in reading too much into the numbers as the YoY comparisons are distorted due to the UPS Freight acquisition (now TForce Freight) in April of last year. The key to initiating a position here will be whether we believe there is enough of a ‘margin of safety’ to withstand the inevitable slow down in the economy over the next few quarters.
Magna International (MGA-N)
“First quarter results came in ahead of our expectations, with our sales again outpacing global light vehicle production. However, due to current geopolitical events and COVID-19 lockdowns in China, industry estimates for vehicle production have been lowered, and we are facing inflation and commodity headwinds. While these factors negatively impact our outlook, we remain committed to managing through short term industry adversity and investing for our future.”
– Swamy Kotagiri, Magna’s Chief Executive Officer
Highlights:
- Global light vehicle production was down 7%, largely due to 16% decrease in Europe
- Sales of $9.6 billion decreased 5%
- Diluted earnings per share and adjusted diluted earnings per share decreased 40% and 31%, respectively
- Reduced 2022 outlook to reflect expected lower light vehicle production assumptions and an increase in production input costs
Outlook:
Magna’s operations in Russia remain substantially idled. These operations currently consist of six facilities and approximately 2,000 employees which generated sales of $371 million in 2021, substantively to Hyundai and Volkswagen. As at March 31, 2022, our consolidated balance sheet included $440 million related to our investment in Russia, including $160 million of net assets and $280 million of deferred cumulative translation losses in accumulated other comprehensive loss. In addition to the risk factors discussed in our Annual Information Form and Annual Report on Form 40-F in respect of the year ended December 31, 2021, the continuing conflict is creating or exacerbating a broad range of risks, including with respect to:
- global economic growth;
- global vehicle production volumes;
- inflationary pressures, including in energy, commodities, and transportation/logistics;
- energy security in Western Europe, particularly in Germany and Austria where we have significant operations; and
- supply chain fragility.
A material deterioration in any of the foregoing could have a material adverse effect on our business and results of operations.
Additionally, the sanctions regime imposed by G7 and other countries includes a range of measures which reduce the ability of companies from such sanctioning countries to fund or provide products or services to or through their Russian operations. The combination of continuing suspensions of production by western OEMs in Russia, as well as our own continuing idling of operations, may result in material charges to income for amounts recorded on our consolidated balance sheet related to our investment in Russia.
(MGA-N) reported earnings in line with what we expected. The problems in the short term for Magna are well documented. Unless there is a quick fix to the items mentioned in their Q1 Outlook section above, we are not expecting much out of Magna until Q1 2023. However, we like the long-term potential and would be willing to grow our position on further price weakness.
TC Energy Corp. (TRP-T)
“During the first three months of 2022, our diversified and opportunity-rich portfolio of essential energy infrastructure assets continued to deliver strong results and reliably meet North America’s growing demand for energy. Comparable earnings of $1.12 per common share and comparable funds generated from operations of $1.9 billion reflect the solid performance of our assets and the utility-like nature of our business together with contributions from projects that entered service in 2021. The global environment continues to be complex, representing an urgent need to develop greater energy security. Now more than ever, we understand the importance of North America’s role in securing global energy supply. By working closely with our customers, we continue to develop innovative energy solutions to move, generate and store the energy people need daily while also advancing our shared goals for sustainability.”
François Poirier, President and Chief Executive Officer
Highlights:
- First quarter 2022 results were underpinned by solid utilization and reliability across our assets, further supported by the constructive fundamental outlook for North American energy. The growing need for energy security has placed renewed focus on the long-term role our infrastructure will play in responsibly fulfilling North America’s energy demands:
- The NGTL System had its highest average winter demand since 2000 of 14.2 Bcf/d ◦ U.S. Natural Gas Pipelines reached average flows of 30 Bcf/d, up five per cent compared to first quarter 2021, including an all-time daily system delivery record of nearly 35 Bcf in January 2022
- ◦ Today, around a quarter of the U.S. LNG export volumes travel through our U.S. Natural Gas Pipelines • First quarter 2022 financial results
- ◦ Net income attributable to common shares of $0.4 billion or $0.36 per common share compared to a net loss of $1.1 billion or a loss of $1.11 per common share in 2021. Comparable earnings1 of $1.1 billion or $1.12 per common share compared to $1.1 billion or $1.16 per common share in 2021
- ◦ Segmented earnings of $1.2 billion compared to segmented losses of $0.9 billion in 2021 and comparable EBITDA1 of $2.4 billion compared to $2.5 billion in 2021
- ◦ Net cash provided by operations of $1.7 billion was consistent with 2021 results and comparable funds generated from operations1 was $1.9 billion compared to $2.0 billion in 2021
- Declared a quarterly dividend of $0.90 per common share for the quarter ending June 30, 2022
- Consistent with our 2021 Annual Report outlook, 2022 comparable EBITDA is expected to be modestly higher than 2021, while 2022 comparable earnings per common share are expected to be consistent with 2021
- Continued to advance our $25 billion secured capital program by investing $1.7 billion in various growth projects • Filed ANR rate case with FERC in January and filed Great Lakes unopposed rate settlement in March 2022
- Received FERC approval for Alberta XPress and North Baja XPress projects in April 2022
- Received verification of final cost and schedule estimates for the Bruce Power Unit 3 MCR program from IESO in March
- To date in 2022, finalized contracts for approximately 160 MW and 240 MW from our wind energy and solar projects, respectively, following the RFI process initiated in 2021. Expect to finalize additional contracts in 2022
- Received notice on March 29, 2022 from the Government of Alberta that the Final Project Proposal to build and operate the Alberta Carbon Grid, a joint-venture with Pembina Pipeline Corporation, moves forward to the next stage
- Announced a plan to evaluate a hydrogen production hub in Crossfield, Alberta in April 2022
- Issued US$800 million of Junior Subordinated Notes through TransCanada Trust in March 2022.
Outlook:
Our overall comparable EBITDA and comparable earnings per common share outlook for 2022 remains consistent with the 2021 Annual Report. 2022 comparable EBITDA is expected to be modestly higher than 2021, and 2022 comparable earnings per common share outlook is expected to be consistent with 2021. Please refer to the 2021 Annual Report for additional details. We continue to monitor the impact of changes in energy markets, our construction projects and regulatory proceedings as well as COVID-19 for any potential effect on our 2022 comparable EBITDA and comparable earnings per common share.
(TRP-T) is executing on their projections for 2022 and is meeting expectations. With governments under a lot of political pressure to not build any more pipelines, we like TC Energy’s long-term prospects.
Toromont Industries (TIH-T)
“We are pleased with our operating performance and financial results, through a challenging business environment. While end market activity levels remained solid as pandemic restrictions eased in some markets, persistent supply constraint pressures and inflation contribute to a fluid, complex and uncertain operating environment. The Equipment Group reported good activity in rental and product support, while global supply chain challenges persist and continue to impact timing of equipment deliveries. CIMCO revenues decreased in the quarter on timing of project construction schedules, while product support activity improved. Across the organization, we are continuing to leverage the learnings from the past year and maintain our operating disciplines, while incorporating new ways to do business with uncertain conditions.”
Highlights:
- Toromont’s share price of $118.51 at the end of March 2022, translated to a market capitalization of $9.8 billion and a total enterprise value of $9.6 billion.
- The Company maintained a very strong financial position. Leverage as represented by the net debt to total capitalization ratio was -8% at the end March 2022, compared to -16% at the end of December 2021 and 2% at the end of March 2021.
- The Board of Directors approved a quarterly dividend of $0.39 cents per share, payable on July 5, 2022 to shareholders on record on June 9, 2022.
- The Company’s return on opening shareholders’ equity was 19.7% at the end of March 2022, on a trailing twelve-month basis, compared to 19.6% at the end of December 2021 and 16.7% at the end of March 2021. Trailing twelve month pre-tax return on capital employed was 27.4% at the end of March 2022, compared to 26.6% at the end of December 2020 and 21.5% at the end of March 2021.
- Revenues increased 7% in the quarter versus the same period last year reflecting solid activity levels in most areas and good execution from our teams. Product support revenues were 10% higher on increased demand and technician headcount, while rental revenues grew 29% on a larger fleet and higher utilization. Equipment sales were relatively unchanged compared to prior year with Equipment Group growth of 4% largely offset by weaker CIMCO package revenues down 7%, as construction projects schedules and deliveries in both cases were deferred due to supply chain constraints.
- Operating income increased 23% on higher revenues and gross margins. Expense levels were up slightly at 14.8% of revenue, reflecting continued cost focus in an inflationary environment, consistent with gradual business openings.
- Net earnings increased $11.6 million or 24% in the quarter versus a year ago to $59.5 million or $0.72 EPS.
- Bookings were 16% lower compared to the similar period last year. The Equipment Group received several large construction and mining orders in the first quarter of 2021. Backlogs were $1.5 billion at March 31, 2022, compared to $911.5 million at March 31, 2021, reflecting strong order activity and supply constraints through the latter part of 2021.
Outlook:
The emergency measures enacted in early 2020, to combat the spread of COVID-19, continue to affect economies and disrupt business operations around the world. Staff shortages, reduced customer activity and demand, product availability and other supplier constraints, cost increases and increased government regulations or intervention, are some of the factors that have and may continue to negatively impact our business, consolidated financial results and conditions of the Company. While generally the situation is improving, there is ongoing concern and uncertainty regarding potential new COVID-19 variants. As a result, it is not possible to reliably estimate the length and severity of these developments as well as the impact on the consolidated financial results and condition of the Company in future periods.
We are closely monitoring global economic factors, in particular, inflationary pressures from price and wage increases, including price increases from our key suppliers. Initiatives are underway across all of our operations to improve efficiency and leverage the learnings from the last two years, including use of technology and innovative ways to engage with customers, employees and other partners with reduced discretionary spending.
The ongoing challenges in the global supply chain have resulted in delivery date delays for equipment, components and parts and this is expected to continue. We continue to actively manage supply chain constraints by taking appropriate mitigation steps in collaboration with our key suppliers and our customers, such as actively sourcing used equipment, optimizing preparation time on equipment, and offering rebuilds and rental options. We expect a tight supply environment to continue.
Another good earnings report for Toromont Industries (TIH-T). Not all companies are affected by what is happening in the world. Analysts believe favorable demand trends and supply chain tightness are a net positive for equipment dealers. These factors resulted in a profitable mix, primarily in used, rental, and product support, and also aided margins across the board, with gross margins increasing 160 basis points.
It seems we never get a chance to enter a position in (TIH-T). The stock price continues to climb higher.
Below is a snapshot of ‘The List’ from last Friday’s close. For a sortable version of ‘The List’, please click on The List menu item.
‘The List’ is not meant to be a template for investors to copy exactly. Rather, its purpose is to provide investment ideas and a real-time illustration of dividend growth investing in action. It is not a ‘Buy List’ nor does it reflect the composition or returns of our Magic Pants Wealth-Builder (CDN) Portfolio. It is only a starting point for our analysis and discussion.
The List (2022)
Last updated by BM on April 29, 2022
*Note: The following graph is wide, you can scroll to the right on your device to see more of the data.
| SYMBOL | COMPANY | YLD | PRICE | YTD % | DIV | YTD % | STREAK |
|---|---|---|---|---|---|---|---|
| AQN-N | Algonquin Power & Utilities | 4.7% | $14.45 | 0.7% | $0.68 | 2.3% | 11 |
| ATD-T | Alimentation Couche-Tard Inc. | 0.8% | $57.19 | 9.8% | $0.44 | 18.1% | 12 |
| BCE-T | Bell Canada | 5.4% | $68.30 | 3.6% | $3.68 | 5.1% | 13 |
| BIP-N | Brookfield Infrastructure Partners | 3.5% | $62.43 | 2.2% | $2.16 | 5.9% | 14 |
| CCL-B-T | CCL Industries | 1.7% | $56.01 | -17.4% | $0.96 | 14.3% | 20 |
| CNR-T | Canadian National Railway | 1.9% | $151.08 | -2.5% | $2.93 | 19.1% | 26 |
| CTC-A-T | Canadian Tire | 2.9% | $176.95 | -3.4% | $5.20 | 10.6% | 11 |
| CU-T | Canadian Utilities Limited | 4.6% | $38.62 | 5.5% | $1.78 | 1.0% | 50 |
| DOL-T | Dollarama Inc. | 0.3% | $71.42 | 12.6% | $0.22 | 9.2% | 11 |
| EMA-T | Emera | 4.3% | $62.03 | -0.9% | $2.65 | 2.9% | 15 |
| ENB-T | Enbridge Inc. | 6.1% | $56.06 | 13.2% | $3.44 | 3.0% | 26 |
| ENGH-T | Enghouse Systems Limited | 2.0% | $36.13 | -21.2% | $0.72 | 16.3% | 15 |
| FNV-N | Franco Nevada | 0.8% | $151.16 | 11.1% | $1.28 | 10.3% | 14 |
| FTS-T | Fortis | 3.4% | $62.51 | 3.4% | $2.14 | 2.9% | 48 |
| IFC-T | Intact Financial | 2.2% | $179.72 | 9.8% | $4.00 | 17.6% | 17 |
| L-T | Loblaws | 1.2% | $117.51 | 14.4% | $1.46 | 6.6% | 10 |
| MGA-N | Magna | 3.0% | $60.27 | -26.1% | $1.80 | 4.7% | 12 |
| MRU-T | Metro | 1.6% | $70.61 | 5.3% | $1.10 | 12.2% | 27 |
| RY-T | Royal Bank of Canada | 3.7% | $129.75 | -5.2% | $4.80 | 11.1% | 11 |
| SJ-T | Stella-Jones Inc. | 2.3% | $35.50 | -12.7% | $0.80 | 11.1% | 17 |
| STN-T | Stantec Inc. | 1.2% | $58.97 | -16.0% | $0.71 | 6.8% | 10 |
| TD-T | TD Bank | 3.8% | $92.79 | -6.6% | $3.56 | 12.7% | 11 |
| TFII-N | TFI International | 1.3% | $80.48 | -27.3% | $1.08 | 12.5% | 11 |
| TIH-T | Toromont Industries | 1.3% | $113.09 | -0.5% | $1.52 | 15.2% | 32 |
| TRP-T | TC Energy Corp. | 5.3% | $67.95 | 13.8% | $3.57 | 4.4% | 21 |
| T-T | Telus | 4.1% | $32.14 | 8.0% | $1.31 | 4.4% | 18 |
| WCN-N | Waste Connections | 0.7% | $137.97 | 2.9% | $0.92 | 8.9% | 12 |
| Averages | 2.7% | -0.9% | 9.2% | 18 |
