Toronto-Dominion Bank: Time To Supercharge Your Dividend Growth Investing (DGI) Returns
Last updated by BM on April 13, 2023
Summary
- The banking crisis of 2023 has now spread to global banks.
- Are Canadian banks such as Toronto-Dominion Bank vulnerable?
- How does Toronto-Dominion’s pending acquisition of First Horizon Corporation (FHN-N) impact our decision?
- Our DGI process is simple and intuitive. We review ‘quality’ indicators and ‘valuation’ metrics that are readily available and easy to understand.
- In this article, we make the case that an investment in Toronto-Dominion Bank today will help ‘supercharge’ your investment returns in the future.

Background
In mid-March, we sent out a DGI-Alert to all our paid subscribers confirming a transaction. As you may recall, the banking sector faced significant turmoil after Silicon Valley Bank in the United States and Credit Suisse in Europe encountered some issues. We utilize such circumstances to guide our readers through our methodology, ensuring a more rational approach to opportunities when they arise.
This article substantiates our quality and valuation analysis of Toronto-Dominion Bank at that time. We also wanted to give all our readers the inside scoop on our process in action. We used the closing price of $79.65 from last week for our analysis here.
Always be sure that any purchase you make meets your own personal objectives and risk tolerances.
If you have not yet joined as a subscriber of the blog to receive DGI Alerts on the activity in our model portfolio, it’s not too late. Click Here.
Intro
“Be fearful when others are greedy and greedy when others are fearful.”
– Warren Buffett
As we grow older, we tend to accumulate a wealth of experience that we can draw upon. During the first decade of our journey as dividend growth investors, we experienced the ups and downs that are typical of the market. However, we were fortunate to learn from our mistakes and document five valuable lessons in our post, MP Wealth-Builder Portfolio (CDN); The First Ten Years. Recently, we put one of these lessons into practice by purchasing Toronto-Dominion Bank’s stock for our model portfolio.
Lesson #5
Supercharge your returns by having the confidence in a market sell-off to purchase the quality companies on your list. We had a few opportunities over the last ten years to either initiate or add to our core positions at a steep discount. We ended up being too conservative when the opportunities presented themselves and our returns were not as good as they could have been. Have a chat with yourself prior to a sell-off on what your strategy would be and try and eliminate the emotion for when the time comes. Trust the process.
Investment Thesis
Toronto-Dominion Bank’s stock has been impacted by the recent barrage of negative news surrounding the banking industry, credit delinquencies and concerns over the First Horizon Corporation acquisition. In our opinion, Canadian banks are distinct from other banks worldwide. Canadian banks are well-capitalized and enjoy oligopoly power in Canada, with dominant positions in deposit-taking, lending, investment banking, insurance and wealth management.
We also believe that the acquisition or non-acquisition of First Horizon Corporation is only a short-term issue. If the bank can renegotiate the deal to more favourable terms, this could be seen as a positive development and could potentially boost investor confidence in the company. On the other hand, if the bank decides to walk away from the deal entirely, this could also be seen as a positive development if investors believe it will be in the company’s best interest in the long run. Either way, the share price should regain support.
Given the current price, we believe that (TD-T) stock is being unjustly penalized, presenting an excellent opportunity to purchase this quality dividend grower at a discount.
About
Toronto-Dominion Bank is one of Canada’s two largest banks and operates three business segments: Canadian retail banking, U.S. retail banking, and wholesale banking. The bank’s U.S. operations span from Maine to Florida, with a strong presence in the Northeast. It also has a 13% ownership stake in Charles Schwab.
Not only is The Toronto-Dominion the biggest bank in Canada in terms of assets and deposits, but it also ranks as the sixth largest bank in North America in terms of assets and the fifth largest in terms of market capitalization.
TD operates as a global bank, with 60% of its operations in Canada, 37% in the United States, and the remaining 3% overseas. It has a significant presence with 2,220 retail locations in Canada and the U.S. and 16 offices worldwide.
Our Process
The process we use is a ‘rules-based’ process. It is a repeatable process in all markets that tilts the odds of making a good investment decision in our favour. We will review the first two rules in our process to see if now is the time to add Toronto-Dominion Bank to our DGI portfolios.
- Quality; only buy large-cap companies with a long dividend growth streak and good financial safety metrics in an industry that is stable and growing.
- Valuation; look to buy a company that is sensibly priced or undervalued by looking at a company’s track record. Undervaluation introduces a margin of safety. You are in essence, tilting the odds in your favour that future price movements will be upwards.
- Monitor; keep an eye on your dividend growers, especially the current yield; fluctuations in yields send signals. The consistency of a firm’s dividend growth is the best measure of management’s confidence in the long-term growth outlook for a company.
Quality
To assess the quality in the dividend growth stocks we follow, we look at several indicators. A company we invest in rarely satisfies all of our criteria, but the more ‘indicators’ we check off, the higher the quality of the business.
Dividend Growth Streak
We begin assessing quality with a streak of dividend increases of at least 10 years. The longer streak, the higher the ‘quality’.
Toronto-Dominion Bank had a dividend growth streak of 12 years coming into 2022. An increase already in this fiscal year (2023) means the streak will continue.
Growth Yield
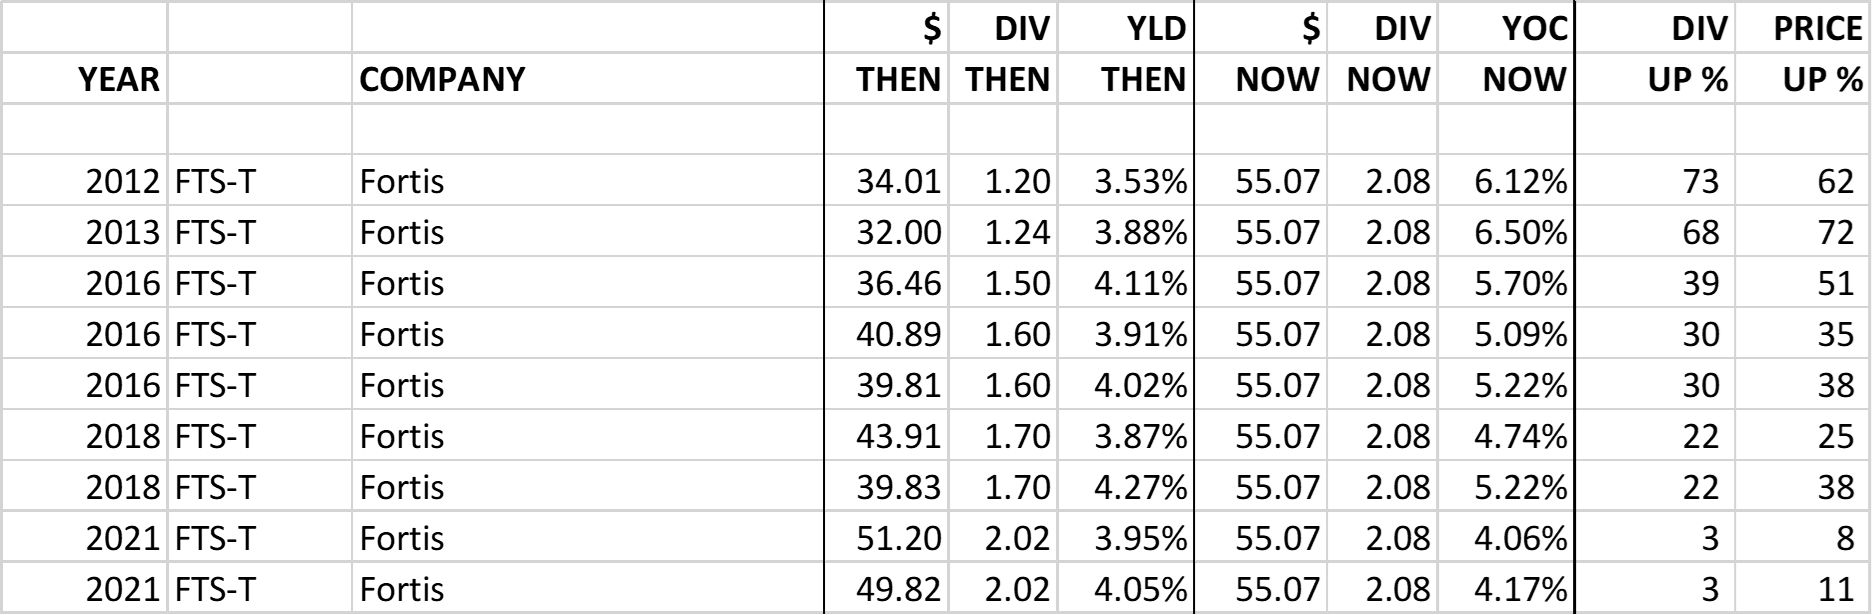
Growth yield refers to the yield on cost of a stock, which takes into account the current annualized dividend payments in relation to the original cost basis of the investment. We like the term growth yield better as it proves that growth (a key part of our strategy) has indeed happened and highlights the yield you are now making on dividends alone. The magic of growth yield is typically lost in all statements and conversations about investing. Knowing the subtle difference between a good yield and growing yield is fundamental in what we do.
According to our experience, creating a stock portfolio with an average estimated growth yield and historical growth yield of greater than 7% after ten years has proven to be a reliable indicator of quality.
Historical growth yield calculation for Toronto-Dominion Bank:
Current Dividend / Price Jan. 1, 2013, = Historical Growth Yield
$3.84/$41.60 = 9.2%
Estimated growth yield calculation for Toronto-Dominion Bank:
Current Yield * Average Annual Forward Dividend Growth Rate ^ Period = Estimated Growth Yield
4.9% * 1.08 ^ 10 = 10.6%
In this instance, the Toronto-Dominion Bank satisfies our minimum growth yield criteria regarding historical and projected figures. The historical growth yield was based on a tangible value from an investment in TD Bank ten years ago, whereas the estimated growth yield is a forecasted figure for the next ten years.
Dividend Growth Rates (5YR and 10YR)
We are looking for consistent dividend increases. The lower the starting yield, the higher the growth rate and time horizon required to achieve our income goals.
Toronto-Dominion Bank has a good dividend growth rate for an above-average yielding stock. Toronto-Dominion Bank has a 10YR average annual growth rate of 9.5% and a 5YR average of 8.7%
Recent Dividend Increase
This is a positive statement by management that they have confidence in the business going forward.
The Toronto-Dominion Bank has declared a dividend boost of +7.87% for the year 2023, signifying the bank’s 13th uninterrupted year of increasing dividends and 166th year of maintaining a consistent dividend payment record.

Source: TD Bank Q1 2023 Investor Presentation (March 2, 2023)
Dividend Growth and Price Growth Alignment
Identifying companies whose dividend growth aligns closely with price growth can considerably enhance the predictability of future returns. With the exception of a few abnormalities, such as the pandemic in 2020 and banking concerns in early 2023, the dividend growth of Toronto-Dominion Bank closely corresponds with its price growth. Moreover, the dip in price in 2020 turned out to be a favourable buying opportunity. Toronto-Dominion’s dividend continues to grow. Dividend growth investors know that the dividend drives the price in a predictable way, not the other way around.
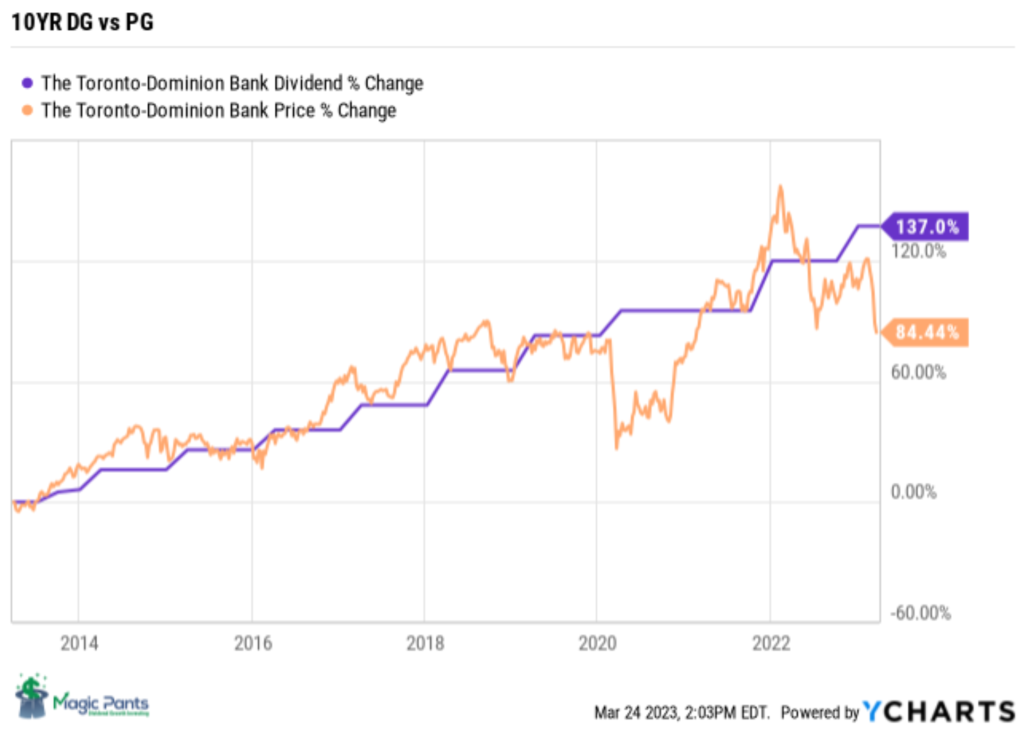
Source: YCHARTS
Payout Ratio (Dividends vs Earnings)
Low-payout dividend payers have traditionally done better than companies with high or negative payout ratios. Figure out the industry and company averages and measure against them. Low payout ratios protect your dividend.
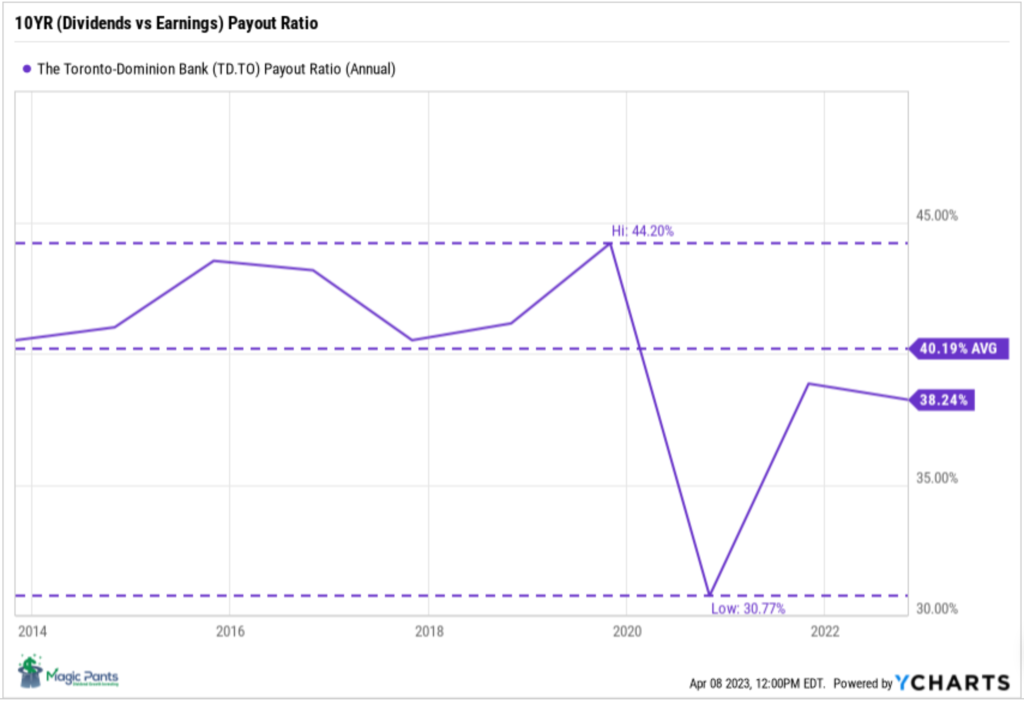
Source: YCHARTS
With payout ratios below historical averages, there is ample room for further dividend growth at Toronto-Dominion Bank without adversely affecting financial health even if earnings are impacted in the short term, as its payout ratio currently sits comfortably below its ten-year average.
Independent Research
Although we review the above indicators as they are readily available for all the stocks we invest in, we find the independent research from services that sell information for a living to be the most informative. Value Line (VL) and S&P ratings can typically be found with a little digging.
Value Line’s Safety Rank
Measures the total risk of a stock relative to approximately 1,700 other stocks covered by Value Line. The safest stocks are assigned a rank of 1, whereas the riskiest stocks are assigned a rank of 5.
Toronto-Dominion Bank has a VL Safety Rank of 2.
Value Line Financial Strength
Ratings, from A++ to C in nine steps. The lowest rating is reserved for companies in serious financial difficulty. Factors considered in assigning ratings include balance sheet strength, corporate performance, market capitalization, and stability of returns.
Toronto-Dominion Bank has a VL Financial Strength Rating of A.
S&P Credit Ratings
Help investors determine investment risks. Ratings are either investment grade (AAA through BBB–) or speculative (BB+ through D).
Toronto-Dominion Bank has an S&P Credit Rating of AA-.
Market Cap
Market capitalization is also an important indicator to consider when evaluating a company’s quality. It represents the total value of a company’s outstanding shares of stock and is calculated by multiplying the number of outstanding shares by the current market price per share. Companies with larger market capitalizations generally have more resources, a more established track record, and less volatility than smaller companies. Toronto-Dominion Bank has a market cap of $145 billion dollars making it the second-largest company in Canada.
Quality Summary
Toronto-Dominion Bank is one of Canada’s highest-quality dividend growth companies, ranking highly on almost every quality indicator we use. Quality companies have historically been good investments when purchased at a sensible price.
Valuation
Irrespective of the superior quality of our dividend growers, we exercise caution and do not initiate or augment a position unless the stock is ‘sensibly priced’. To evaluate valuation, we utilize a few different metrics.
Historical Fundamentals
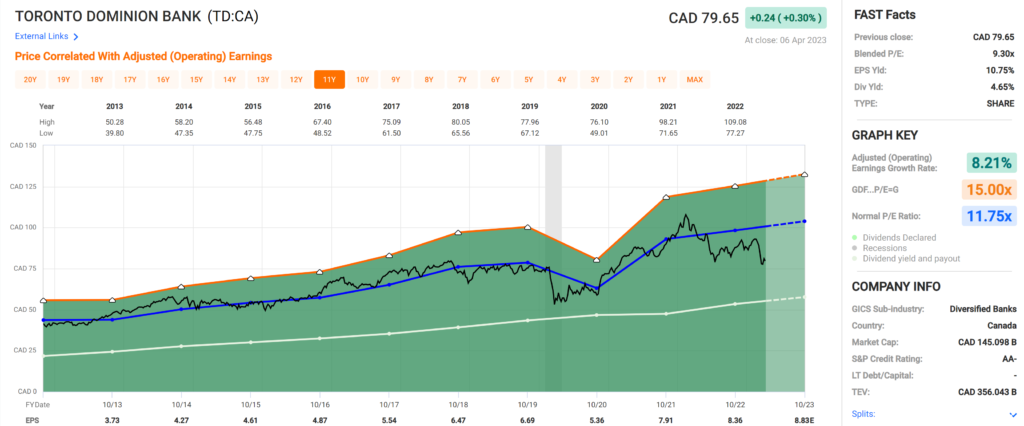
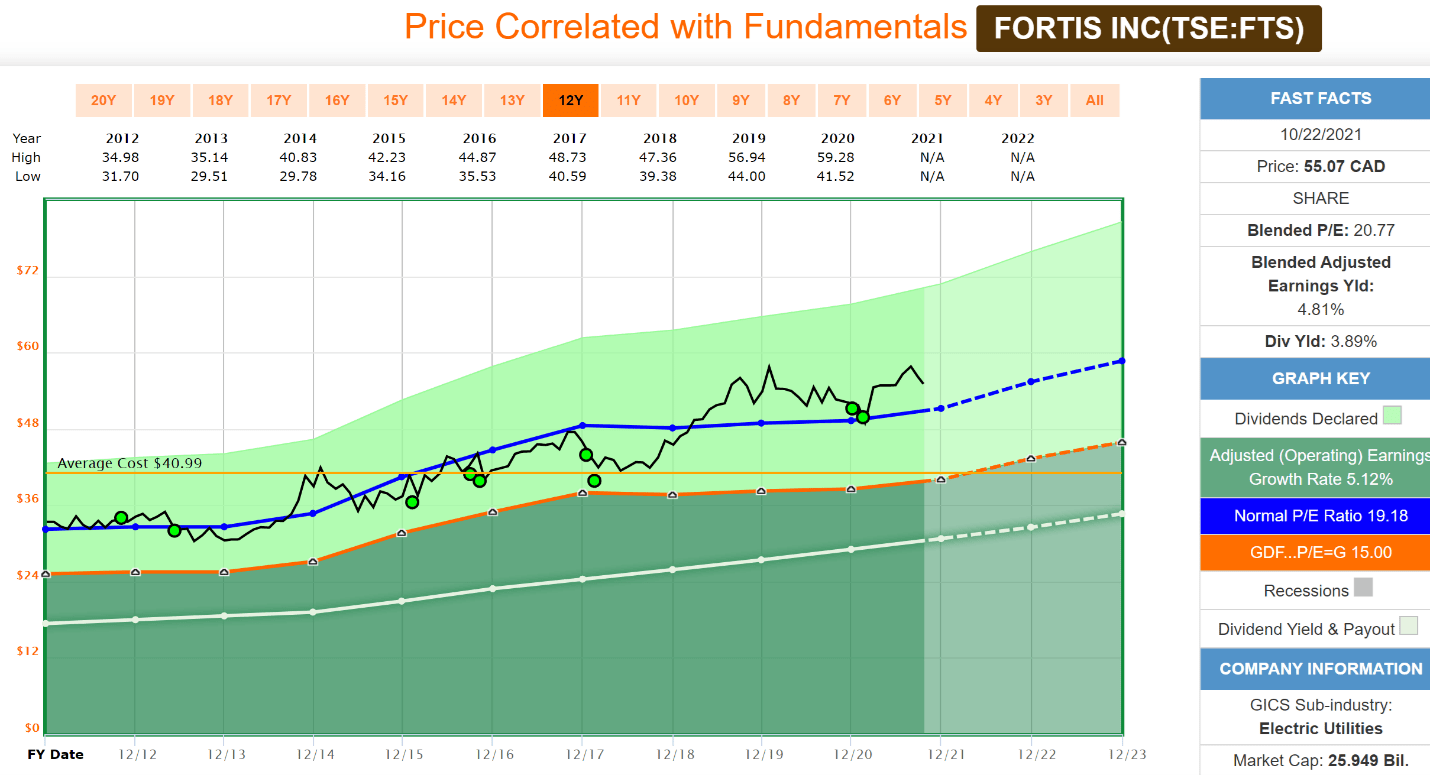
Source: FAST Graphs
When we review the fundamentals FAST Graphs chart of Toronto-Dominion Bank, we notice that Price (Black Line) has historically followed its Normal P/E (Blue Line). Recent price weakness has it separating from its normal trading range. A narrow valuation corridor (a stock price that follows a path that rarely deviates from its trading range ie P/E ratio in this case) shows the predictability of this stock’s price movements.
We are below the Normal P/E of 11.75, which points to undervaluation at the current price. The current level is now ~ 30% below this level, which gives us the margin of safety we are looking for in this market.
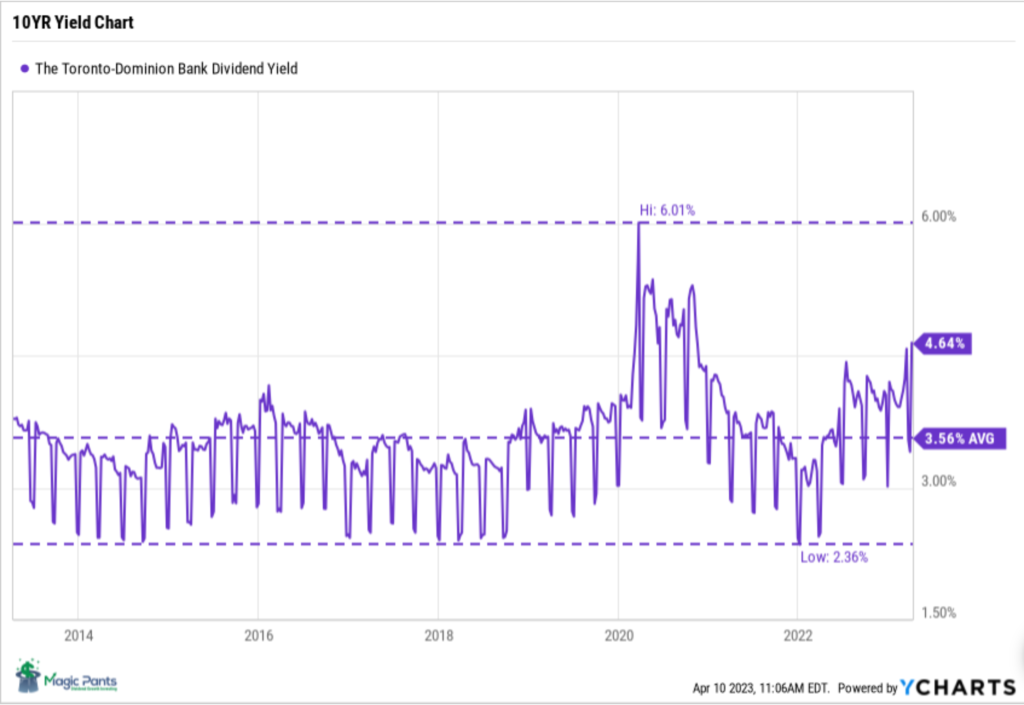
Dividend Yield Theory
The dividend yield theory is a simple and intuitive approach to valuing dividend growth stocks. It suggests that the dividend yield of quality dividend growth stocks tends to revert to the mean over time, assuming that the underlying business model remains stable.
In practical terms, this means that if a stock is currently paying a dividend yield above its ten-year average annual yield, there is a higher probability that its price will increase to bring the yield back to its historical average.
Source: YCHARTS
CAPE
The cyclically adjusted price-to-earnings CAPE ratio can assist investors in determining whether a stock is appropriately valued (sensibly priced). By averaging earnings over a longer period, such as ten years, the CAPE ratio helps smooth out short-term fluctuations. It provides a more reliable individual measure of a company’s earnings potential. When the CAPE ratio is low, it may suggest that the stock is undervalued and could be a good investment opportunity. Conversely, when the CAPE ratio is high, it may indicate that the stock is overvalued and could be a potential risk for investors. It is also important to consider the specific industry and market conditions that may affect a company’s earnings potential.
We typically look for stocks with a cyclically adjusted price-to-earnings ratio CAPE under 20. We calculate the CAPE by taking the average of the last ten years of a company’s earnings and dividing it by the current price.
Toronto-Dominion Bank’s CAPE ratio is ~13.8, representing undervaluation at today’s price.
Graham Value
The Graham number is a formula developed by Benjamin Graham, the father of value investing, to determine the intrinsic value of a stock. The formula uses a combination of a company’s earnings per share (EPS) and book value per share (BVPS) to calculate the fair value of a stock.
The Graham value/price we use: square root of (( average of last three years earnings per share * book value per share) * 22.5). The multiplier 22.5 is what Graham believed was appropriate for a company with a price-to-earnings (P/E) ratio of 15 and a price-to-book ratio of 1.5.
According to Graham’s theory, any stock price below the calculated Graham number is considered undervalued and thus worth investing in.
When we compute Toronto-Dominion Bank’s Graham number, we arrive at a price of $94.85. Given last Friday’s price of $79.65, we have a margin of safety here of ~19%, according to Graham, for this quality dividend grower.
Valuation Summary
Purchasing stocks at a ‘sensible price’ is as important as selecting quality companies in what we do. There is no one metric we rely on completely. The primary valuation indicators we use (Dividend Yield Theory, CAPE and Graham Value) all point to the undervaluation of Toronto-Dominion’s stock price at current levels. The historical fundamentals chart from FAST Graphs provides support for our hypothesis.
Forecast
“You can learn from the past, but you make money on the future.”
– Chuck Carnevale
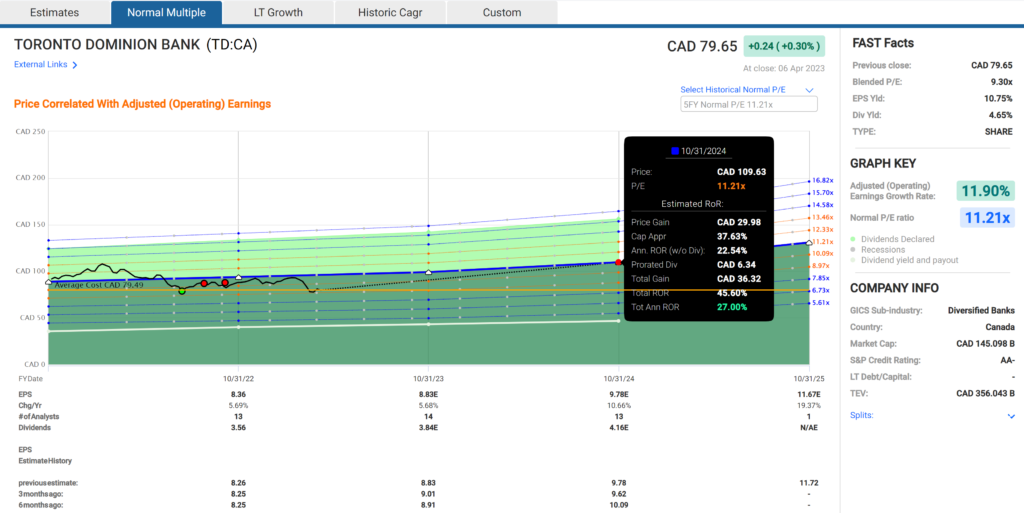
Source: FAST Graphs
Using the “Normal Multiple’ estimating tool from FAST Graphs, we see a normal P/E average over the last five years of 11.21. Based on analyst forecasts for eighteen months out, we estimate an annualized return, based on today’s price, of 27.0% should Toronto-Dominion Bank trade at its five-year normal P/E.
Analyst Scorecard
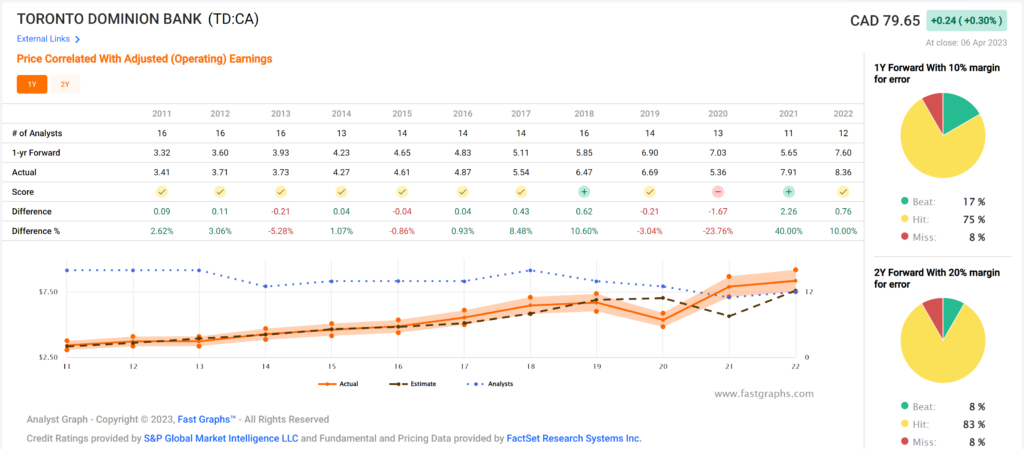
Source: FAST Graphs
To provide weight to the estimated earnings component of our analysis, we review the analysts’ historical track record covering this stock. You can see from the data that analysts have an above-average record of predicting earnings both one year (1Y) and two years (2Y) out. They have beaten or hit estimates on 1Y estimates 82% of the time and 91% on 2Y timeframes.
Forecast Summary
Due to the predictive power of dividend growth, its narrow historical valuation corridor, its historical track record of analysts’ forward earnings estimates and the conservative assumption that Toronto-Dominion Bank will trade again at its normal (P/E), we believe we have a high probability of above-average returns eighteen months out and beyond on an investment today.
News
TORONTO, March 2, 2023 – TD Bank Group (“TD” or the “Bank”) today announced its financial results for the first quarter January 31, 2023. Reported earnings were $1.6 billion, down 58% compared with the first quarter last year, and adjusted earnings were $4.2 billion, up 8%.
“TD had a strong start to 2023 with Canadian and U.S. retail businesses delivering robust revenue growth and record earnings, demonstrating the benefits of our diversified business mix,” said Bharat Masrani, Group President and Chief Executive Officer, TD Bank Group. “We continued to invest to strengthen our businesses and deliver the legendary customer experiences our customers and clients have come to expect from TD.”
“Yesterday, we announced the close of the Cowen Inc. acquisition, an important step forward in the expansion of our global dealer. TD Securities now has 6,500 colleagues in 40 cities around the world and is able to serve clients with an even broader product and services offering,” added Masrani.
Acquisition of Cowen Inc.
On March 1, 2023, the Bank completed the acquisition of Cowen Inc. (“Cowen”). The results of the acquired business will be consolidated by the Bank from the closing date and primarily reported in the Wholesale Banking segment.
Pending Acquisition of First Horizon Corporation
On February 28, 2022, the Bank and First Horizon Corporation (ׅ“First Horizon”) announced a definitive agreement for the Bank to acquire First Horizon in an all cash transaction valued at US$13.4 billion, or US$25.00 for each common share of First Horizon.
On February 9, 2023, the parties announced they had mutually agreed to extend the outside date to May 27, 2023, in accordance with the terms of the merger agreement. The closing of the transaction is subject to customary closing conditions, including approvals from U.S. and Canadian regulatory authorities, which now are not expected to be obtained prior to May 27, 2023. Regulatory approvals are not within the Bank’s control. If the merger does not close by May 27, 2023, then an amendment to the merger agreement would be required to further extend the outside date. TD and First Horizon are discussing a potential further extension.
Source: TD Earnings Release Q1 2023 (March 2, 2023)
The recent challenges facing the global banking system and the pending acquisition of First Horizon Corporation have harmed Toronto-Dominion Bank’s investors in recent weeks. Although there is an increased likelihood of additional banks being affected by these challenges, we remain confident that Toronto-Dominion Bank will weather the current financial storm and make prudent decisions for investors regarding the First Horizon Corp. acquisition. The bank’s successful track record of sound financial management over three centuries provides us with additional reassurance.
Conclusion
Utilizing our quality indicators and valuation metrics while drawing from our experience as dividend growth investors over the past decade, we have learned the significance of utilizing market sell-offs to acquire high-quality companies at reduced prices. Accumulating this high-quality, sensibly priced dividend grower today is an opportunity that will end up supercharging your DGI returns for years to come.