“You have a pair of pants. In the left pocket, you have $100. You take $1 out of the left pocket and put in the right pocket. You now have $101. There is no diminution of dollars in your left pocket. That is one magic pair of pants.”

MP Market Review – March 28, 2024

Last updated by BM on April 1, 2024

Summary


This is a weekly installment of our MP Market Review series, which provides updates on the financial markets and Canadian dividend growth companies we monitor on ‘The List’.

  • Find out how to beat the Taxman and put more money in your pocket.
  • Last week, dividend growth stayed the same and has increased by +7.4% YTD, highlighting the dependable growth in our income.
  • The YTD price return of ‘The List’ was up from the previous week with a return of +4.3% (capital).
  • Last week, there were no dividend announcements from companies on ‘The List’.
  • Last week, there were no earnings reports from companies on ‘The List’.
  • One company on ‘The List’ is due to report earnings this week.

DGI Clipboard


“It’s not enough to be smart about investing; you also need to be smart about taxes.”

 – Joel Greenblatt

Beating the Taxman: How Dividend Growth Investing (DGI) Saves You Money

Understanding the Tax Advantages of Dividend Growth Investing

As savvy investors, our goal is to achieve our investment objectives and maximize our post-tax returns. One effective strategy is investing in dividend-paying companies that offer capital gains and tax benefits.

In Canada, dividends from these companies are taxed more favourably thanks to the dividend tax credits available at both federal and provincial levels. These credits prevent double taxation since the dividends are paid from the company’s after-tax profits. As a result, these credits often surpass the tax benefits associated with other investment returns.

How Dividends are Taxed

When a company pays you a dividend, it distributes after-tax profits, meaning shareholders like you shouldn’t be taxed again on this income. To address this, the government uses a specific formula to calculate taxes on eligible dividends, effectively avoiding double taxation. This process involves grossing up your eligible dividend income by 1.38 to align with the correct tax bracket, followed by applying for the dividend tax credits, significantly reducing the amount of tax owed.

The two charts below show the taxes paid (highlighted in green) on four actual before-tax incomes, demonstrating how much more money you can keep in your pocket when investing in dividend-paying companies compared to other forms of income.
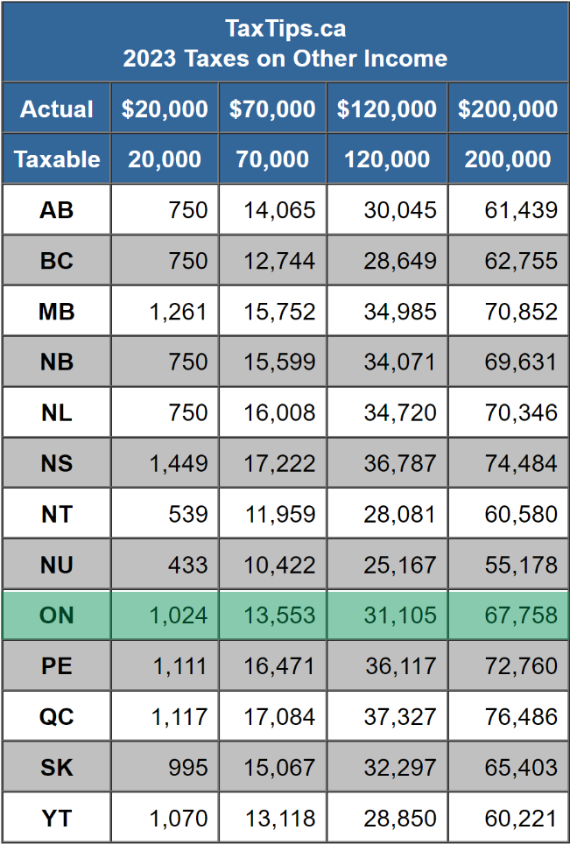
Source: Taxtips.ca

Visualizing the Savings

The accompanying charts illustrate the tax differences on four hypothetical incomes, highlighting the substantial savings when earning from dividend-paying companies compared to other income types like salaries or bonds. For instance, earning $70,000 from eligible Canadian dividends could save you nearly $10,000 in taxes compared to the same amount from other income sources.

Resources for Calculating Your Tax Benefits

For those looking to calculate specific tax scenarios, websites like EY’s Personal Tax Calculator and TaxTips.ca provide valuable tools and comparisons:

Long-Term Benefits of DGI

Another advantage of dividend growth investing is the potential to defer taxes on increasing capital through unrealized capital gains while simultaneously earning inflation-protected income. By holding onto high-quality dividend growers for an extended period, you can potentially fund your retirement with tax-efficient dividend income instead of depleting your capital and incurring capital gains taxes.

Conclusion

The tax savings from dividend growth investing are substantial, allowing you to reinvest more or enjoy a financially secure retirement. Smart tax planning is crucial for maximizing investment returns, proving once again that a strategic approach to investing and taxes is essential for long-term success.
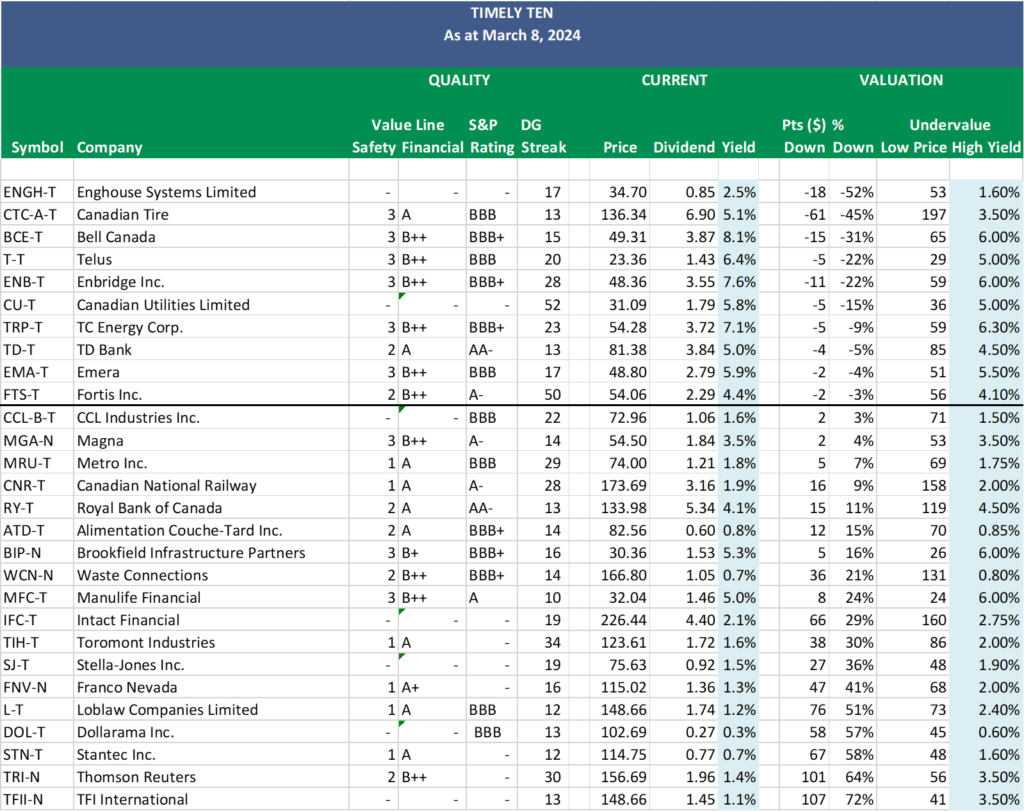
DGI Scorecard

 
The List (2024)


The Magic Pants 2024 list includes 28 Canadian dividend growth stocks. Here are the criteria to be considered a candidate on ‘The List’:

  1. Dividend growth streak: 10 years or more.
  2. Market cap: Minimum one billion dollars.
  3. Diversification: Limit of five companies per sector, preferably two per industry.
  4. Cyclicality: Exclude REITs and pure-play energy companies due to high cyclicality.

Based on these criteria, companies are added or removed from ‘The List’ annually on January 1. Prices and dividends are updated weekly.

While ‘The List’ is not a standalone portfolio, it functions admirably as an initial guide for those seeking to broaden their investment portfolio and attain superior returns in the Canadian stock market. Our newsletter provides readers with a comprehensive insight into the implementation and advantages of our Canadian dividend growth investing strategy. This evidence-based, unbiased approach empowers DIY investors to outperform both actively managed dividend funds and passively managed indexes and dividend ETFs over longer-term horizons.

For those interested in something more, please upgrade to a paid subscriber; you get the enhanced weekly newsletter, access to premium content, full privileges on the new Substack website magicpants.substack.com and DGI alerts whenever we make stock transactions in our model portfolio.

Performance of ‘The List’


Last week, dividend growth stayed the same and has increased by +7.4% YTD, highlighting the dependable growth in our income.

The YTD price return of ‘The List’ was up from the previous week with a return of +4.3% (capital).

Last week’s best performers on ‘The List’ were Brookfield Infrastructure Partners (BIP-N), up +6.12%; Franco Nevada. (FNV-N), up +4.18%; and Manulife Financial (MFC-T), up +3.58%.

Stantec Inc. (STN-T) was the worst performer last week, down -3.86%.

SYMBOL COMPANY YLD PRICE YTD % DIV YTD % STREAK
ATD-T Alimentation Couche-Tard Inc. 0.9% $77.31 0.7% $0.70 17.4% 14
BCE-T Bell Canada 8.7% $46.03 -15.0% $3.99 3.1% 15
BIP-N Brookfield Infrastructure Partners 5.2% $31.21 1.7% $1.62 5.9% 16
CCL-B-T CCL Industries Inc. 1.7% $69.23 19.7% $1.16 9.4% 22
CNR-T Canadian National Railway 1.9% $178.37 6.9% $3.38 7.0% 28
CTC-A-T Canadian Tire 5.2% $135.10 -2.5% $7.00 1.4% 13
CU-T Canadian Utilities Limited 5.8% $30.85 -4.0% $1.79 0.0% 52
DOL-T Dollarama Inc. 0.3% $103.19 8.6% $0.28 5.8% 13
EMA-T Emera 6.0% $47.67 -6.1% $2.87 3.0% 17
ENB-T Enbridge Inc. 7.5% $48.95 1.1% $3.66 3.1% 28
ENGH-T Enghouse Systems Limited 3.3% $30.53 -10.1% $1.00 18.3% 17
FNV-N Franco Nevada 1.2% $119.16 8.2% $1.44 5.9% 16
FTS-T Fortis Inc. 4.4% $53.52 -2.4% $2.36 3.3% 50
IFC-T Intact Financial 2.2% $220.04 8.2% $4.84 10.0% 19
L-T Loblaw Companies Limited 1.2% $150.10 16.8% $1.78 2.4% 12
MFC-T Manulife Financial 4.7% $33.83 17.1% $1.60 9.6% 10
MGA-N Magna 3.5% $54.48 -1.8% $1.90 3.3% 14
MRU-T Metro Inc. 1.8% $72.72 6.1% $1.34 10.7% 29
RY-T Royal Bank of Canada 4.0% $136.62 2.7% $5.52 3.4% 13
SJ-T Stella-Jones Inc. 1.4% $79.00 3.1% $1.12 21.7% 19
STN-T Stantec Inc. 0.7% $112.46 7.5% $0.83 7.8% 12
T-T Telus 6.9% $21.67 -8.6% $1.50 5.2% 20
TD-T TD Bank 5.0% $81.75 -3.5% $4.08 6.3% 13
TFII-N TFI International 1.0% $159.46 21.5% $1.60 10.3% 13
TIH-T Toromont Industries 1.5% $130.35 15.6% $1.92 11.6% 34
TRI-N Thomson Reuters 1.4% $155.83 8.7% $2.16 10.2% 30
TRP-T TC Energy Corp. 7.1% $54.44 4.1% $3.84 3.2% 23
WCN-N Waste Connections 0.7% $172.01 16.1% $1.14 8.6% 14
Averages 3.4% 4.3% 7.4% 21

Note: Stocks ending in “-N” declare earnings and dividends in US dollars. To achieve currency consistency between dividends and share price for these stocks, we have shown dividends in US dollars and share price in US dollars (these stocks are listed on a US exchange). The dividends for their Canadian counterparts (-T) would be converted into CDN dollars and would fluctuate with the exchange rate.

Check us out on magicpants.substack.com for more info in this week’s issue….

MP Market Review – March 22, 2024

Last updated by BM on March 25, 2024

Summary


This is a weekly installment of our MP Market Review series, which provides updates on the financial markets and Canadian dividend growth companies we monitor on ‘The List’.

  • Last week, dividend growth stayed the same and has increased by +7.4% YTD, highlighting the dependable growth in our income.
  • The YTD price return of ‘The List’ was up from the previous week with a return of +4.0% (capital).
  • Last week, there was one dividend announcement from a company on ‘The List’.
  • Last week, there was one earnings report from a company on ‘The List’.
  • No companies on ‘The List’ are due to report earnings this week.

DGI Scorecard

 
The List (2024)


The Magic Pants 2024 list includes 28 Canadian dividend growth stocks. Here are the criteria to be considered a candidate on ‘The List’:

  1. Dividend growth streak: 10 years or more.
  2. Market cap: Minimum one billion dollars.
  3. Diversification: Limit of five companies per sector, preferably two per industry.
  4. Cyclicality: Exclude REITs and pure-play energy companies due to high cyclicality.

Based on these criteria, companies on ‘The List’ are added or removed annually on Jan. 1. Prices and dividends are updated weekly.

While ‘The List’ is not a standalone portfolio, it functions admirably as an initial guide for those seeking to broaden their investment portfolio and attain superior returns in the Canadian stock market. Our newsletter provides readers with a comprehensive insight into the implementation and advantages of our Canadian dividend growth investing strategy. This evidence-based, unbiased approach empowers DIY investors to outperform both actively managed dividend funds and passively managed indexes and dividend ETFs over longer-term horizons.

For those interested in something more, please upgrade to a paid subscriber; you get the enhanced weekly newsletter, access to premium content, full privileges on the new Substack website magicpants.substack.com and DGI alerts whenever we make stock transactions in our model portfolio.

Performance of ‘The List’


Last week, dividend growth stayed the same and has increased by +7.4% YTD, highlighting the dependable growth in our income.

The YTD price return of ‘The List’ was up from the previous week with a return of +4.0% (capital).

The best performers last week on ‘The List’ were TFI International (TFII-N), up +6.59%; Stella-Jones Inc. (SJ-T), up +4.72%; and Magna (MGA-N), up +4.38%.

Alimentation Couche-Tard Inc. (ATD-T) was the worst performer last week, down -6.95%.

SYMBOL COMPANY YLD PRICE YTD % DIV YTD % STREAK
ATD-T Alimentation Couche-Tard Inc. 0.9% $77.90 1.5% $0.70 17.4% 14
BCE-T Bell Canada 8.7% $45.86 -15.4% $3.99 3.1% 15
BIP-N Brookfield Infrastructure Partners 5.5% $29.41 -4.2% $1.62 5.9% 16
CCL-B-T CCL Industries Inc. 1.6% $71.14 23.0% $1.16 9.4% 22
CNR-T Canadian National Railway 1.9% $179.28 7.4% $3.38 7.0% 28
CTC-A-T Canadian Tire 5.2% $133.51 -3.7% $7.00 1.4% 13
CU-T Canadian Utilities Limited 5.8% $30.77 -4.2% $1.79 0.0% 52
DOL-T Dollarama Inc. 0.3% $101.32 6.6% $0.28 5.8% 13
EMA-T Emera 6.0% $47.68 -6.1% $2.87 3.0% 17
ENB-T Enbridge Inc. 7.6% $48.21 -0.4% $3.66 3.1% 28
ENGH-T Enghouse Systems Limited 3.2% $31.57 -7.1% $1.00 18.3% 17
FNV-N Franco Nevada 1.3% $114.38 3.9% $1.44 5.9% 16
FTS-T Fortis Inc. 4.4% $53.79 -1.9% $2.36 3.3% 50
IFC-T Intact Financial 2.2% $219.30 7.9% $4.84 10.0% 19
L-T Loblaw Companies Limited 1.2% $152.83 18.9% $1.78 2.4% 12
MFC-T Manulife Financial 4.9% $32.66 13.1% $1.60 9.6% 10
MGA-N Magna 3.5% $54.82 -1.2% $1.90 3.3% 14
MRU-T Metro Inc. 1.8% $72.48 5.8% $1.34 10.7% 29
RY-T Royal Bank of Canada 4.1% $135.26 1.7% $5.52 3.4% 13
SJ-T Stella-Jones Inc. 1.4% $77.62 1.3% $1.12 21.7% 19
STN-T Stantec Inc. 0.7% $116.98 11.8% $0.83 7.8% 12
T-T Telus 6.9% $21.76 -8.3% $1.50 5.2% 20
TD-T TD Bank 5.0% $81.27 -4.0% $4.08 6.3% 13
TFII-N TFI International 1.0% $161.03 22.7% $1.60 10.3% 13
TIH-T Toromont Industries 1.5% $127.49 13.0% $1.92 11.6% 34
TRI-N Thomson Reuters 1.4% $156.36 9.1% $2.16 10.2% 30
TRP-T TC Energy Corp. 7.0% $54.97 5.1% $3.84 3.2% 23
WCN-N Waste Connections 0.7% $170.88 15.3% $1.14 8.6% 14
Averages 3.4% 4.0% 7.4% 21

Note: Stocks ending in “-N” declare earnings and dividends in US dollars. To achieve currency consistency between dividends and share price for these stocks, we have shown dividends in US dollars and share price in US dollars (these stocks are listed on a US exchange). The dividends for their Canadian counterparts (-T) would be converted into CDN dollars and would fluctuate with the exchange rate.

DGI Clipboard


“The market is a distraction to the business of investing.”

– John C. Bogle

The DGI ‘Double-Double’ Strategy

The “double-double” is a uniquely Canadian term that most of us attribute to Tim Hortons. It will get you a coffee with two creams and two sugars (or double cream, double sugar). If it were up to us, we would also add the term “double-double” to the growing list of all the things we have found magical about dividend growth investing (DGI).

By tracking the dividend growth rates of our quality dividend growers, we have found it easy to predict when both our income and capital will double in value. After all, if we get the dividend growth right, the price growth will follow.

Let’s look at the dividend growth rates of ‘The List’ over the last ten years to illustrate.

The ‘Total’ row shows the value of owning one share in each company beginning in 2014. Although not every stock on the list doubled its dividend, the list in aggregate more than doubled, with the dividends growing from $28 in 2014 to over $62 in 2023 for an annualized growth rate of 9.6%. The same holds for the price of the stocks. One share in each company on ‘The List’ was worth ~ $1000 in 2014 and is now worth almost $2500 at the end of 2023. They, too, grew on average at an annualized rate of 9.1%, which again more than doubled our investment. Our annualized total return is even higher at 11.2%, as it contains both the dividends paid and price increases. 

From an earlier post on The Rule of 72, we know that any investment with a rate of return equal to 7.2% or higher will double in value every ten years. Knowing this, we only have to pay attention to the annual dividend growth rate to predict our probable returns over a longer-term horizon.

Our dividend growth rate is already 7.4% in 2024 (See the ‘Performance of The List’ chart earlier in this post). If this growth rate continues and we apply the Rule of 72, our income and capital should double again over the next decade.

If our dividends double and our capital doubles every ten years, we will outperform most investing strategies. Dividend growth investors call this a ‘double-double’. By paying attention to the dividend growth rate from quality companies purchased at sensible prices, we can sleep easy at night, knowing our investment returns will eventually follow.

Dividend growth investing is simple to understand but not easy to do. Ignoring the noise and narratives of the financial markets is the hard but necessary part of our work.

Check us out on magicpants.substack.com for more info in this week’s issue….

MP Market Review – March 15, 2024

Last updated by BM on March 18, 2024

Summary


This is a weekly installment of our MP Market Review series, which provides updates on the financial markets and Canadian dividend growth companies we monitor on ‘The List’.

  • Last week, ‘The List’ was down from the previous week with a YTD price return of +3.8% (capital). Dividends were up and have increased by +7.4% YTD, highlighting the dependable growth in our income.
  • Last week, there was one dividend announcement from a company on ‘The List’.
  • Last week, there was one earnings report from a company on ‘The List’.
  • One company on ‘The List’ is due to report earnings this week.

DGI Scorecard

 
The List (2024)


The Magic Pants 2024 list includes 28 Canadian dividend growth stocks. Here are the criteria to be considered a candidate on ‘The List’:

  1. Dividend growth streak: 10 years or more.
  2. Market cap: Minimum one billion dollars.
  3. Diversification: Limit of five companies per sector, preferably two per industry.
  4. Cyclicality: Exclude REITs and pure-play energy companies due to high cyclicality.

Based on these criteria, companies on ‘The List’ are added or removed annually on Jan. 1. Prices and dividends are updated weekly.

While ‘The List’ is not a standalone portfolio, it functions admirably as an initial guide for those seeking to broaden their investment portfolio and attain superior returns in the Canadian stock market. Our newsletter provides readers with a comprehensive insight into the implementation and advantages of our Canadian dividend growth investing strategy. This evidence-based, unbiased approach empowers DIY investors to outperform both actively managed dividend funds and passively managed indexes and dividend ETFs over longer-term horizons.

For those interested in something more, please upgrade to a paid subscriber; you get the enhanced weekly newsletter, access to premium content, full privileges on the new Substack website magicpants.substack.com and DGI alerts whenever we make stock transactions in our model portfolio.

Performance of ‘The List’


Last week, ‘The List’ was down from the previous week with a YTD price return of +3.8% (capital). Dividends were up and have increased by +7.4% YTD, highlighting the dependable growth in our income.

The best performers last week on ‘The List’ were Toromont Industries (TIH-T), up +3.74%; Dollarama Inc. (DOL-T), up +2.56%; and Waste Connections (WCN-N), up +2.48%.

Enghouse Systems Limited (ENGH-T) was the worst performer last week, down -11.04%.

SYMBOL COMPANY YLD PRICE YTD % DIV YTD % STREAK
ATD-T Alimentation Couche-Tard Inc. 0.8% $83.72 9.1% $0.70 17.4% 14
BCE-T Bell Canada 8.6% $46.61 -14.0% $3.99 3.1% 15
BIP-N Brookfield Infrastructure Partners 5.5% $29.44 -4.1% $1.62 5.9% 16
CCL-B-T CCL Industries Inc. 1.6% $71.35 23.4% $1.16 9.4% 22
CNR-T Canadian National Railway 1.9% $174.28 4.4% $3.38 7.0% 28
CTC-A-T Canadian Tire 5.3% $131.88 -4.8% $7.00 1.4% 13
CU-T Canadian Utilities Limited 5.8% $30.70 -4.4% $1.79 0.0% 52
DOL-T Dollarama Inc. 0.3% $105.32 10.8% $0.28 5.8% 13
EMA-T Emera 6.0% $47.70 -6.1% $2.87 3.0% 17
ENB-T Enbridge Inc. 7.6% $48.06 -0.7% $3.66 3.1% 28
ENGH-T Enghouse Systems Limited 3.2% $30.87 -9.1% $1.00 18.3% 17
FNV-N Franco Nevada 1.3% $114.48 3.9% $1.44 5.9% 16
FTS-T Fortis Inc. 4.4% $53.80 -1.9% $2.36 3.3% 50
IFC-T Intact Financial 2.2% $224.96 10.6% $4.84 10.0% 19
L-T Loblaw Companies Limited 1.2% $150.64 17.2% $1.78 2.4% 12
MFC-T Manulife Financial 4.9% $32.67 13.1% $1.60 9.6% 10
MGA-N Magna 3.6% $52.52 -5.4% $1.90 3.3% 14
MRU-T Metro Inc. 1.8% $73.92 7.9% $1.34 10.7% 29
RY-T Royal Bank of Canada 4.1% $134.63 1.2% $5.52 3.4% 13
SJ-T Stella-Jones Inc. 1.5% $74.12 -3.2% $1.12 21.7% 19
STN-T Stantec Inc. 0.7% $114.93 9.8% $0.83 7.8% 12
T-T Telus 6.7% $22.42 -5.5% $1.50 5.2% 20
TD-T TD Bank 5.0% $81.37 -3.9% $4.08 6.3% 13
TFII-N TFI International 1.1% $151.08 15.2% $1.60 10.3% 13
TIH-T Toromont Industries 1.5% $128.23 13.7% $1.92 11.6% 34
TRI-N Thomson Reuters 1.4% $157.35 9.8% $2.16 10.2% 30
TRP-T TC Energy Corp. 7.0% $54.49 4.2% $3.84 3.2% 23
WCN-N Waste Connections 0.7% $170.93 15.4% $1.14 8.6% 14
Averages 3.4% 3.8% 7.4% 21

Note: Stocks ending in “-N” declare earnings and dividends in US dollars. To achieve currency consistency between dividends and share price for these stocks, we have shown dividends in US dollars and share price in US dollars (these stocks are listed on a US exchange). The dividends for their Canadian counterparts (-T) would be converted into CDN dollars and would fluctuate with the exchange rate.

DGI Clipboard


“A true investor buys for the dividend return and it’s growth.”

– Tom Connolly

How Dividend Growth Companies Pay You Back – Big Time!

When I was first introduced to the dividend growth investing strategy, I was no different than most investors. I wanted to know how much total return I would make annually if I invested in dividend growth companies. However, what truly astonished me was not the gain derived from the rise in stock prices but the substantial income gained solely from dividends. I had not anticipated that a significant portion of my initial investment would be repaid through dividends, making my original investment progressively safer as time passed.

Below is a chart of ‘The List’ we follow showing the ten-year total dividends paid for each company on ‘The List’.

The first takeaway is just how much of our original investment is returned to us in dividends alone.

About a third of ‘The List’ returns over half our money in just ten years. On average that number is ~42% or $4,194 if you take into account all the companies on ‘The List’. This is money we can reinvest, pay bills with or have fun with regardless of what the stock market is doing.

The second key point, which we frequently emphasize in our strategy, underscores that the compound annual dividend growth rate (CAGR 10Y DG) is driving the compound annual price growth rate (CAGR 10Y PG). With an average dividend growth rate of 9.5% and an average price growth rate of 9.1% over the last decade, this correlation is unmistakable.

Lastly, attention should be drawn to the positioning of companies on the chart. Those with higher initial yields tend to dominate the upper half, while those with lower starting yields occupy the lower half—a logical arrangement when you are sorting based on dividends paid over a shorter time period. To demonstrate how our strategy works over a longer investment horizon we have added a couple of extra columns to the far right of the chart. These columns display the dividend return from our original investment after ten years (10Y DIV RETURN) and the dividend return after twenty years (20Y DIV RETURN). This number is calculated by dividing the current dividend in 2024 and the projected dividend in 2034 by your original investment (PRICE 2014) using the actual dividend growth rate (CAGR 10Y DG) as our estimate. It is worth noting that many companies with initially low yields but high dividend growth rates would now sit at the top of the chart and generate more dividend income than those with higher starting yields and lower dividend growth rates.

Crafting a portfolio with a balanced mix of starting yields—some high, some low—is pivotal. With this approach, we avoid prematurely selling high dividend growth companies, safeguarding total returns, and vice versa, retaining high dividend payers to ensure sufficient retirement income until the low yield high growth companies catch up.

Check us out on magicpants.substack.com for more info in this week’s issue….

MP Market Review – March 8, 2024

Last updated by BM on March 11, 2024

Summary


This is a weekly installment of our MP Market Review series, which provides updates on the financial markets and Canadian dividend growth companies we monitor on ‘The List’.

  • Last week, ‘The List’ was up from the previous week with a YTD price return of +4,6% (capital). Dividends were up and have increased by +6.8% YTD, highlighting the dependable growth in our income.
  • Last week, there were no dividend announcements from companies on ‘The List’.
  • Last week, there was one earnings report from companies on ‘The List’.
  • One company on ‘The List’ is due to report earnings this week.

DGI Scorecard

 
The List (2024)


The Magic Pants 2024 list includes 28 Canadian dividend growth stocks. Here are the criteria to be considered a candidate on ‘The List’:

  1. Dividend growth streak: 10 years or more.
  2. Market cap: Minimum one billion dollars.
  3. Diversification: Limit of five companies per sector, preferably two per industry.
  4. Cyclicality: Exclude REITs and pure-play energy companies due to high cyclicality.

Based on these criteria, companies on ‘The List’ are added or removed annually on Jan. 1. Prices and dividends are updated weekly.

While ‘The List’ is not a standalone portfolio, it functions admirably as an initial guide for those seeking to broaden their investment portfolio and attain superior returns in the Canadian stock market. Our newsletter provides readers with a comprehensive insight into the implementation and advantages of our Canadian dividend growth investing strategy. This evidence-based, unbiased approach empowers DIY investors to outperform both actively managed dividend funds and passively managed indexes and dividend ETFs over longer-term horizons.

For those interested in something more, please upgrade to a paid subscriber; you get the enhanced weekly newsletter, access to premium content, full privileges on the new Substack website magicpants.substack.com and DGI alerts whenever we make stock transactions in our model portfolio.

Performance of ‘The List’


Last week, ‘The List’ was up from the previous week with a YTD price return of +4.6% (capital). Dividends were up and have increased by +6.8% YTD, highlighting the dependable growth in our income.

The best performers last week on ‘The List’ were Franco Nevada (FNV-N), up +7.51%; Canadian National Railway (CNR-T), up +4.63%; and Brookfield Infrastructure Partners (BIP-N), up +4.62%.

Enghouse Systems Limited (ENGH-T) was the worst performer last week, down -3.21%.

SYMBOL COMPANY YLD PRICE YTD % DIV YTD % STREAK
ATD-T Alimentation Couche-Tard Inc. 0.8% $82.56 7.6% $0.70 17.4% 14
BCE-T Bell Canada 8.1% $49.31 -9.0% $3.99 3.1% 15
BIP-N Brookfield Infrastructure Partners 4.4% $30.36 -1.1% $1.62 5.9% 15
CCL-B-T CCL Industries Inc. 1.6% $72.96 26.1% $1.16 9.4% 22
CNR-T Canadian National Railway 1.9% $173.69 4.1% $3.38 7.0% 28
CTC-A-T Canadian Tire 5.1% $136.34 -1.6% $7.00 1.4% 13
CU-T Canadian Utilities Limited 5.8% $31.09 -3.2% $1.79 0.0% 52
DOL-T Dollarama Inc. 0.3% $102.69 8.1% $0.28 5.8% 13
EMA-T Emera 5.9% $48.80 -3.9% $2.87 3.0% 17
ENB-T Enbridge Inc. 7.6% $48.36 -0.1% $3.66 3.1% 28
ENGH-T Enghouse Systems Limited 2.5% $34.70 2.1% $0.88 4.1% 17
FNV-N Franco Nevada 1.3% $115.02 4.4% $1.44 5.9% 16
FTS-T Fortis Inc. 4.4% $54.06 -1.4% $2.36 3.3% 50
IFC-T Intact Financial 2.1% $226.44 11.4% $4.84 10.0% 19
L-T Loblaw Companies Limited 1.2% $148.66 15.6% $1.78 2.4% 12
MFC-T Manulife Financial 5.0% $32.04 10.9% $1.60 9.6% 10
MGA-N Magna 3.4% $54.50 -1.8% $1.84 0.0% 14
MRU-T Metro Inc. 1.8% $74.00 8.0% $1.34 10.7% 29
RY-T Royal Bank of Canada 4.1% $133.98 0.7% $5.52 3.4% 13
SJ-T Stella-Jones Inc. 1.5% $75.63 -1.3% $1.12 21.7% 19
STN-T Stantec Inc. 0.7% $114.75 9.6% $0.83 7.8% 12
T-T Telus 6.4% $23.36 -1.5% $1.50 5.2% 20
TD-T TD Bank 5.0% $81.38 -3.9% $4.08 6.3% 13
TFII-N TFI International 1.1% $148.66 13.3% $1.60 10.3% 13
TIH-T Toromont Industries 1.6% $123.61 9.6% $1.92 11.6% 34
TRI-N Thomson Reuters 1.4% $156.69 9.3% $2.16 10.2% 30
TRP-T TC Energy Corp. 7.1% $54.28 3.8% $3.84 3.2% 23
WCN-N Waste Connections 0.7% $166.80 12.6% $1.14 8.6% 14
Averages 3.3% 4.6% 6.8% 21

Note: Stocks ending in “-N” declare earnings and dividends in US dollars. To achieve currency consistency between dividends and share price for these stocks, we have shown dividends in US dollars and share price in US dollars (these stocks are listed on a US exchange). The dividends for their Canadian counterparts (-T) would be converted into CDN dollars and would fluctuate with the exchange rate.

DGI Clipboard


“Current yield, using its own historic yield as a guide, is, in my view, a fine valuation measure.” 

– Tom Connolly

Unlocking Value: How Dividend Yield Theory Powers Our Timely Ten Selections

Step three in our process involves monitoring our quality dividend growers regularily, which can become quite challenging depending on the number of companies we track. Fortunately, we rely on ‘The List’ instead of the vast array of stocks in the index, which streamlines our task. Nevertheless, we continually seek methods to enhance our efficiency. Through dividend yield theory, we’ve discovered an approach that has proven remarkably effective over the years in aiding us with our efforts.

Dividend yield theory is a simple and intuitive approach to valuing dividend growth stocks. It suggests that the dividend yield of quality dividend growth stocks tends to revert to the mean over time, assuming that the underlying business model remains stable. In practical terms, if a stock pays a dividend yield above its ten-year average annual yield, its price will likely increase to return the yield to its historical average. Knowing that price and yield go in opposite directions, this theory helps us find stocks that are poised for a positive price correction.

We have already pre-screened our candidates using the criteria we laid out in building ‘The List’ initially. This helps us considerably narrow the universe of investable stocks.

  1. Dividend growth streak: 10 years or more.
  2. Market cap: Minimum one billion dollars.
  3. Diversification: Limit of five companies per sector, preferably two per industry.
  4. Cyclicality: Exclude REITs and pure-play energy companies due to high cyclicality.

We then sort ‘The List’ by how far they are from the undervalue price (Low Price) using dividend yield theory. The stocks above the line are the ones that are at or below our undervalue price. These companies make up this month’s‘ Timely Ten’.

We are always looking for ideas to put our hard earned capital to work. Let’s walk through our approach to see how we came up with this month’s ‘Timely Ten’ data.

The undervalue yield (High Yield) is where we start. Companies on ‘The List’ are given a value based on the historical yields they have traded at over the last ten years. The undervalue yield will be one at the top end of this range. This value is then used to calculate the undervalue price required (Low Price) to achieve that yield. The logic is that if the company ever reaches the undervalue yield, then the price has fallen enough and may be in line for a correction. These companies warrant further research.

Points down (Pts $ Down),  or dollar amount down to the undervalue price. A negative number indicates how many points the stock is below its theoretical undervalue price. Percentage down (% Down) , represents the percentage points to the undervalue price. What we are looking for here is simply the magnitude of the undervaluation.

Looking at this spreadsheet version, we can see that half of the ‘Timely Ten’ have double digits of ‘downside risk’ already built into their current price. These companies stand out as being the most ‘sensibly priced’. The other observation is that these same companies also have lower safety ratings (Value Line Safety) than others in the Timely Ten.

We always prioritize quality over price in our work. Although not as undervalued (by our dividend yield theory metric), TD Bank and Fortis Inc. would be safer candidates for further research based on their higher quality ratings.

Using historical yield as a guide, we can quickly assess the valuation for the companies we track and identify candidates for further research.

Check us out on magicpants.substack.com for more info in this week’s issue….

MP Market Review – March 1, 2024

Last updated by BM on March 4, 2024

Summary


This is a weekly installment of our MP Market Review series, which provides updates on the financial markets and Canadian dividend growth companies we monitor on ‘The List’.

  • Last week, ‘The List’ was down from the previous week with a YTD price return of +3.8% (capital). Dividends were up and have increased by +6.8% YTD, highlighting the dependable growth in our income.
  • Last week, there were two dividend announcements from companies on ‘The List’.
  • Last week, there were six earnings reports from companies on ‘The List’.
  • One company on ‘The List’ are due to report earnings this week.

DGI Scorecard

 
The List (2024)


The Magic Pants 2024 list includes 28 Canadian dividend growth stocks. Here are the criteria to be considered a candidate on ‘The List’:

  1. Dividend growth streak: 10 years or more.
  2. Market cap: Minimum one billion dollars.
  3. Diversification: Limit of five companies per sector, preferably two per industry.
  4. Cyclicality: Exclude REITs and pure-play energy companies due to high cyclicality.

Based on these criteria, companies on ‘The List’ are added or removed annually on Jan. 1. Prices and dividends are updated weekly.

While ‘The List’ is not a standalone portfolio, it functions admirably as an initial guide for those seeking to broaden their investment portfolio and attain superior returns in the Canadian stock market. Our newsletter provides readers with a comprehensive insight into the implementation and advantages of our Canadian dividend growth investing strategy. This evidence-based, unbiased approach empowers DIY investors to outperform both actively managed dividend funds and passively managed indexes and dividend ETFs over longer-term horizons.

For those interested in something more, please upgrade to a paid subscriber; you get the enhanced weekly newsletter, access to premium content, full privileges on the new Substack website magicpants.substack.com and DGI alerts whenever we make stock transactions in our model portfolio.

Performance of ‘The List’


Last week, ‘The List’ was down from the previous week with a YTD price return of +3.8% (capital). Dividends were up and have increased by +6.8% YTD, highlighting the dependable growth in our income.

The best performers last week on ‘The List’ were Enghouse Systems Limited (ENGH-T), up +2.08%; CCL Industries Inc. (CCL-B-T), up +1.15%; and Canadian Utilities Limited (CU-T), up +0.68%.

Stella-Jones Inc. (SJ-T) was the worst performer last week, down -7.52%.

SYMBOL COMPANY YLD PRICE YTD % DIV YTD % STREAK
ATD-T Alimentation Couche-Tard Inc. 0.8% $84.02 9.5% $0.70 17.4% 14
BCE-T Bell Canada 8.0% $50.15 -7.4% $3.99 3.1% 15
BIP-N Brookfield Infrastructure Partners 4.4% $29.02 -5.4% $1.62 5.9% 15
CCL-B-T CCL Industries Inc. 1.7% $69.73 20.6% $1.16 9.4% 22
CNR-T Canadian National Railway 1.9% $176.69 5.9% $3.38 7.0% 28
CTC-A-T Canadian Tire 5.1% $138.23 -0.3% $7.00 1.4% 13
CU-T Canadian Utilities Limited 5.8% $30.99 -3.5% $1.79 0.0% 52
DOL-T Dollarama Inc. 0.3% $104.26 9.7% $0.28 5.8% 13
EMA-T Emera 6.0% $47.90 -5.7% $2.87 3.0% 17
ENB-T Enbridge Inc. 7.8% $47.19 -2.5% $3.66 3.1% 28
ENGH-T Enghouse Systems Limited 2.5% $35.85 5.5% $0.88 4.1% 17
FNV-N Franco Nevada 1.3% $106.99 -2.9% $1.44 5.9% 16
FTS-T Fortis Inc. 4.5% $52.28 -4.7% $2.36 3.3% 50
IFC-T Intact Financial 2.1% $227.52 11.9% $4.84 10.0% 19
L-T Loblaw Companies Limited 1.2% $145.13 12.9% $1.78 2.4% 12
MFC-T Manulife Financial 4.9% $32.38 12.1% $1.60 9.6% 10
MGA-N Magna 3.4% $54.05 -2.6% $1.84 0.0% 14
MRU-T Metro Inc. 1.8% $73.45 7.2% $1.34 10.7% 29
RY-T Royal Bank of Canada 4.2% $131.94 -0.8% $5.52 3.4% 13
SJ-T Stella-Jones Inc. 1.5% $72.82 -4.9% $1.12 21.7% 19
STN-T Stantec Inc. 0.7% $110.78 5.8% $0.83 7.8% 12
T-T Telus 6.3% $23.83 0.5% $1.50 5.2% 20
TD-T TD Bank 5.0% $81.31 -4.0% $4.08 6.3% 13
TFII-N TFI International 1.1% $148.37 13.1% $1.60 10.3% 13
TIH-T Toromont Industries 1.5% $125.30 11.1% $1.92 11.6% 34
TRI-N Thomson Reuters 1.4% $159.29 11.1% $2.16 10.2% 30
TRP-T TC Energy Corp. 7.1% $53.92 3.1% $3.84 3.2% 23
WCN-N Waste Connections 0.7% $165.40 11.6% $1.14 8.6% 14
Averages 3.3% 3.8% 6.8% 21

Note: Stocks ending in “-N” declare earnings and dividends in US dollars. To achieve currency consistency between dividends and share price for these stocks, we have shown dividends in US dollars and share price in US dollars (these stocks are listed on a US exchange). The dividends for their Canadian counterparts (-T) would be converted into CDN dollars and would fluctuate with the exchange rate.

DGI Clipboard


“The big money is not in the buying and selling. But in the waiting.” 

– Charlie Munger

Dividends: The Silent Wealth Builders

One of the significant challenges I’ve faced while introducing subscribers to dividend growth investing (DGI) is steering them away from the fixation on short-term results to focus on long-term wealth creation.

During the weekend, I distributed the quarterly review of our Magic Pants Wealth-Builder Model Portfolio (CDN) to our paid subscribers. This portfolio aligns with the business plan we introduced to these subscribers in May 2022, outlining our approach to creating and managing a dividend growth portfolio.

Below are a couple of charts and excerpts from the review demonstrating the success of our process and how wealth-building works.

Note: Total return is calculated using the ‘Modified Dietz Return,’ which considers the timing of cash inflows and outflows (including dividends). Cash that is yet to be deployed (as per the business plan) is not included in this calculation.

Our overall returns continue to outperform the more ‘passive’ benchmarks. We cautioned our paid subscribers against becoming overly fixated on the ups and downs of individual trades. Instead, we asked them to look deeper into the numbers and begin to see the gradual accumulation of wealth.

During the quarter, every company in our model portfolio announced a dividend increase; there will be more in 2024.

Waste Connections (WCN-T) .255 to .285, up 11.76%, payable on November 28, 2023

Fortis Inc. (FTS-T) .565 to .59, up 4.42%, payable on December 1, 2023

Alimentation Couche-Tard (ATD-T) .14 to .175, up 25.0%, payable on December 21, 2023

Telus (T-T) .3636 to .3761, up 3.4%, payable January 2, 2024

TFI International (TFII-N) .35 to .40, up 14%, payable on January 15, 2024

TD Bank (TD-T) .96 to 1.02, up 6.3%, payable January 31, 2024

Royal Bank of Canada (RY-T) 1.35 to 1.38, up 2.0%, payable February 23, 2024

Metro Inc. (MRU-T) .3025 to .3350, up 10.7%, payable March 05, 2024

Magna (MGA-N) .46 to .475, up 3.3%, payable March 8, 2024

Canadian National Railway (CNR-T) .79 to .845, up 7%, payable March 28, 2024

Franco Nevada (FNV-T) .34 to .36, up 5.88%, payable March 28, 2024

CCL Industries (CCL-B-T) .265 to .29, up 9.4%, payable March 28, 2024

TC Energy Corp. (TRP-T) .93 to .96, up 3.2%, payable April 30, 2024

Toromont Industries (TIH-T) .43 to .48, up 11.6%, payable April 4, 2024

Bell Canada (BCE-T) .9675 to .9975, up 3.1%, payable April 15, 2024

There are two takeaways from this chart. First, regardless of what the stock market is doing, our strategy produces – we are receiving dividends, and our dividends are growing. Our average starting yield of 3.50% grew to 3.76% on our original investments. Projecting this growth forward, we will beat the market from dividend return alone within the decade.

Secondly, as yields build, our companies become more valuable. With average dividend growth already at 10% and average price growth at 3%, the price has some catching up to do. This is where we sit tight, as we know the price growth will eventually track the dividend growth.

Capital growth (prices) driven by income growth (dividends) is the wealth-building we are talking about, and it happens all because of the dividends.

Most people (Advisors included) have still not made the connection between dividends and capital gains. Uncle Charlie was right, the big money is yet to come.

Check us out on magicpants.substack.com for more info in this week’s issue….

We buy quality individual dividend growth stocks when they are sensibly priced and hold for the growing income.