MP Market Review – September 22, 2023
Last updated by BM on September 25, 2023
Summary
- This is a weekly installment of our MP Market Review series, which provides updates on the financial markets and Canadian dividend growth companies we monitor on ‘The List’.
- Last week, ‘The List’ was up with a YTD price return of +1.3% (capital). Dividend growth was up based on two dividend announcements and is now at +8.5% YTD, highlighting growth in income over the past year.
- Last week, two dividend increases from companies on ‘The List’.
- Last week, no earnings report from a company on ‘The List’.
- No companies on ‘The List’ are due to report earnings this week.
- If you’re interested in creating your own dividend growth income portfolio, consider subscribing to our premium service, which grants you access to the MP Wealth-Builder Model Portfolio (CDN) and exclusive subscriber-only content. Learn More

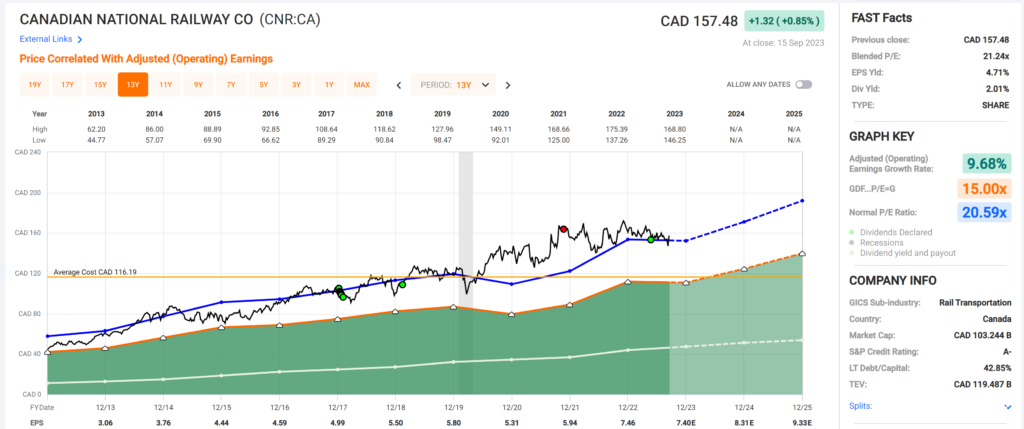
Identifying companies whose dividend growth aligns closely with price growth can considerably enhance the predictability of future returns. Dividend growth investors know that the dividend drives the price in a predictable way, not the other way around. Fortis Inc. (FTS-T) is another company on ‘The List’ that aligns very closely with this dividend growth vs price growth pattern we like to see.
Introduction
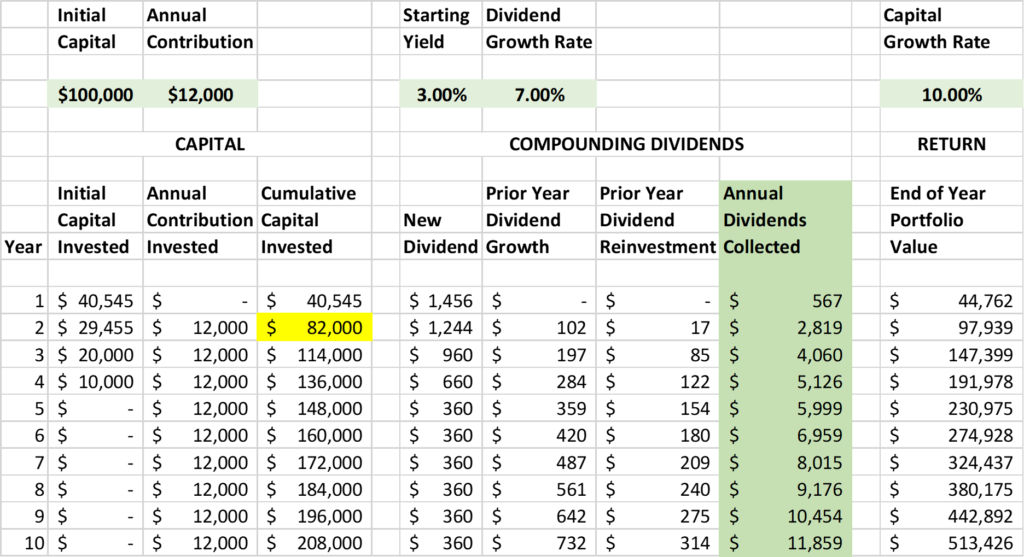
“You have a pair of pants. In the left pocket, you have $100. You take $1 out of the left pocket and put it in the right pocket. You now have $101. There is no diminution of dollars in your left pocket. That is one magic pair of pants.”
This ‘magic pants’ analogy was from a Seeking Alpha article on dividend investing I read about a decade ago and was one of the catalysts for me to take a closer look at this type of investing and see if it truly was magical.
After conducting additional research, I have shifted towards utilizing a dividend growth investing (DGI) strategy as my primary investment approach. While I maintain portfolios consisting of high-quality dividend growers from both the United States and Canada, I have opted to concentrate on Canadian (CDN) dividend growth companies in this blog. This is due to several reasons, including a smaller pool of DGI companies to track, a lack of coverage for the DGI strategy by the North American investment media, and a tendency for those who do cover DGI to narrowly focus on only a handful of sectors (Energy and Financials).
While ‘The List’ is not a portfolio in itself, it serves as an excellent initial reference for individuals seeking to diversify their investments and attain higher returns in the Canadian stock market. Through our blog, we provide weekly updates on ‘The List’ and offer valuable perspectives and real-life examples of the dividend growth investing strategy in practice. This helps readers gain a deeper understanding of how to implement and benefit from this investment approach.
DGI Thoughts
“When CAPE is high, it tells you that the market is expensive, and future returns are likely to be lower. When it’s low, it tells you the market is cheap, and future returns are likely to be higher.”
– Charles Ellis, Winning the Loser’s Game: Timeless Strategies for Successful Investing
Today, we look at another one of our valuation metrics, the cyclically adjusted price-to-earnings ratio (CAPE ratio).
CAPE ratio, also known as the Shiller P/E ratio, is a widely used valuation metric in finance that aims to provide a more accurate and stable measure of a stock or market’s price relative to its earnings over an extended period. Developed by Nobel laureate Robert Shiller, this ratio has gained prominence for its ability to account for the cyclicality of economic and earnings cycles, offering investors a more comprehensive view of the market’s valuation.
Traditional price-to-earnings (P/E) ratios focus on a company’s or market’s current earnings in relation to its current stock price. While these ratios are simple to calculate and provide a snapshot of valuation, they can be highly susceptible to short-term fluctuations in earnings caused by economic cycles.
Investors and analysts use the CAPE ratio to assess whether a market or individual stocks are overvalued or undervalued. Historically, CAPE ratios have shown a strong correlation with long-term stock market returns. When the CAPE ratio is high, suggesting that stocks are expensive relative to their long-term earnings potential, subsequent market returns tend to be lower. Conversely, when the CAPE ratio is low, suggesting that stocks are cheap relative to their long-term earnings potential, subsequent market returns tend to be higher.
It’s important to note that the CAPE ratio, like any financial metric, has its limitations. It can’t predict short-term market movements, and it doesn’t account for changes in accounting standards or the unique circumstances of individual companies. Additionally, some critics argue that it may not be as relevant in today’s rapidly changing economic landscape.
In our process of discovering a ‘sensible price’, we typically look for stocks with a CAPE under 20. We calculate the CAPE by taking the average of the last ten years of a company’s earnings and dividing it by the current price. While it has its limitations, it remains a valuable tool for investors seeking to gauge the relative attractiveness of stocks and markets over the long term.
Here is ‘The List’ sorted by CAPE as of last Friday. The companies above the line meet our CAPE criteria:

If you have not yet joined as a paid subscriber of the blog to receive DGI Alerts on the activity and content related to our model portfolio, it’s not too late. Click Here.
Recent News
FORTIS INC. ANNOUNCES NEW $25 BILLION FIVE YEAR CAPITAL OUTLOOK AND 4.4% INCREASE IN FOURTH QUARTER DIVIDEND MARKING 50 YEARS OF DIVIDEND INCREASES
“Our Board of Directors declared a fourth quarter dividend representing a 4.4% increase that will mark 50 years of consecutive increases in dividends paid,” said David Hutchens, President and CEO, Fortis Inc.
“This makes Fortis one of only two companies listed on the Toronto Stock Exchange to reach this significant milestone.”
“Our sustainable regulated growth strategy is focused on delivering cleaner energy that remains affordable and reliable for our customers while supporting annual dividend growth of 4-6% through 2028,” said Mr. Hutchens.
For me, discovering how many companies in Canada with ten years of consecutive dividend growth or more was a revelation on my journey to uncover the secret of wealth-building (DGI). To find those that have been doing it for five decades and counting is truly magical!
The List (2023)
Last updated by BM on September 22, 2023
The Magic Pants List contains 27 Canadian dividend growth stocks. ‘The List’ contains Canadian companies that have raised their dividend yearly for at least the last ten years and have a market cap of over a billion dollars. Below is each stock’s symbol, name, current yield, current price, price return year-to-date, current dividend, dividend growth year-to-date and current dividend growth streak. Companies on ‘The List’ are added or subtracted once a year, on January 1. After that, ‘The List’ is set for the next twelve months. Prices and dividends are updated weekly.
| SYMBOL | COMPANY | YLD | PRICE | YTD % | DIV | YTD % | STREAK |
|---|---|---|---|---|---|---|---|
| AQN-N | Algonquin Power & Utilities | 7.4% | $6.87 | 2.1% | $0.51 | -29.0% | 12 |
| ATD-T | Alimentation Couche-Tard Inc. | 0.8% | $70.73 | 17.6% | $0.56 | 19.1% | 13 |
| BCE-T | Bell Canada | 7.1% | $53.74 | -10.8% | $3.82 | 5.0% | 14 |
| BIP-N | Brookfield Infrastructure Partners | 4.4% | $30.71 | 5.2% | $1.44 | 6.3% | 15 |
| CCL-B-T | CCL Industries | 1.9% | $57.08 | -1.7% | $1.06 | 10.4% | 21 |
| CNR-T | Canadian National Railway | 2.1% | $148.52 | -8.8% | $3.16 | 7.8% | 27 |
| CTC-A-T | Canadian Tire | 4.7% | $147.76 | 0.8% | $6.90 | 17.9% | 12 |
| CU-T | Canadian Utilities Limited | 5.9% | $30.22 | -18.2% | $1.79 | 1.0% | 51 |
| DOL-T | Dollarama Inc. | 0.3% | $93.61 | 17.2% | $0.27 | 23.8% | 12 |
| EMA-T | Emera | 5.5% | $50.58 | -3.9% | $2.76 | 3.0% | 16 |
| ENB-T | Enbridge Inc. | 7.6% | $46.54 | -12.7% | $3.55 | 3.2% | 27 |
| ENGH-T | Enghouse Systems Limited | 2.8% | $29.79 | -16.6% | $0.85 | 18.2% | 16 |
| FNV-N | Franco Nevada | 1.0% | $140.68 | 1.8% | $1.36 | 6.3% | 15 |
| FTS-T | Fortis Inc. | 4.2% | $54.36 | -1.8% | $2.29 | 5.3% | 49 |
| IFC-T | Intact Financial | 2.2% | $199.81 | 2.1% | $4.40 | 10.0% | 18 |
| L-T | Loblaws | 1.5% | $113.05 | -6.1% | $1.74 | 10.3% | 11 |
| MGA-N | Magna | 3.5% | $53.33 | -7.3% | $1.84 | 2.2% | 13 |
| MRU-T | Metro | 1.7% | $71.86 | -4.8% | $1.21 | 10.0% | 28 |
| RY-T | Royal Bank of Canada | 4.4% | $120.19 | -6.1% | $5.34 | 7.7% | 12 |
| SJ-T | Stella-Jones Inc. | 1.4% | $64.31 | 29.7% | $0.92 | 15.0% | 18 |
| STN-T | Stantec Inc. | 0.9% | $88.59 | 35.6% | $0.77 | 8.5% | 11 |
| TD-T | TD Bank | 4.7% | $81.76 | -6.7% | $3.84 | 7.9% | 12 |
| TFII-N | TFI International | 1.1% | $130.56 | 30.4% | $1.40 | 29.6% | 12 |
| TIH-T | Toromont Industries | 1.5% | $111.14 | 13.7% | $1.68 | 10.5% | 33 |
| TRP-T | TC Energy Corp. | 7.5% | $49.06 | -8.0% | $3.69 | 3.4% | 22 |
| T-T | Telus Corp. | 6.2% | $22.90 | -13.0% | $1.43 | 7.4% | 19 |
| WCN-N | Waste Connections | 0.7% | $137.57 | 4.4% | $1.02 | 7.4% | 13 |
| Averages | 3.4% | 1.3% | 8.5% | 19 |
Six Canadian stocks on ‘The List’ declare earnings and dividends in US dollars and are inter-listed on a US exchange in US dollars. The simplest way to display dividend and price metrics for these stocks is to show their US exchange symbols along with their US dividends and price. The stocks I am referring to have a -N at the end of their symbols. You can still buy their Canadian counterparts (-T), but your dividends will be converted into CDN dollars and will fluctuate based on the exchange rate.
Note: When the dividend and share price currency match, the calculation is straightforward. But it’s not so simple when the dividend is declared in one currency, and the share price is quoted in another. Dividing the former by the latter would produce a meaningless result because it’s a case of apples and oranges. To calculate the yield properly, you must express the dividend and share price in the same currency.
Performance of ‘The List’
Feel free to click on this link, ‘The List’ for a sortable version from our website.
Last week, ‘The List’ was down with a YTD price return of +1.3% (capital). Dividend growth was up on two dividend announcements and is now at +8.5% YTD, highlighting growth in income over the past year.
The best performers last week on ‘The List’ were Intact Financial (IFC-T), down -0.04%; TFI International (TFII-N), down -0.43%; and Toromont Industries (TIH-T), down –1.13%.
Magna (MGA-N) was the worst performer last week, down -6.81%.
Dividend Increases
“The growth of dividend paying ability is of significance in the determination of a stock’s quality, or general safety…”
– Arnold Bernhard (the founder of Value Line)
“As a dividend increase is a positive sign of a company’s financial strength, the safest purchase, after research, is a stock with a recent dividend increase.”
– Tom Connolly (the founder of dividendgrowth.ca)
Last week, two dividend increases from companies on ‘The List’.
Emera Inc. (EMA-T) on Wednesday said it increased its 2023 quarterly dividend from $0..69 to $0.7175 per share, payable November 15, 2023, to shareholders of record on October 31, 2023.
This represents a dividend increase of +4.0%, marking the 17th straight year of dividend growth for this quality, regulated gas and electric utility.
Fortis Inc. (FTS-T) on Thursday said it increased its 2023 quarterly dividend from $0.565 to $0.59 per share, payable December 1, 2023, to shareholders of record on November 17, 2023.
This represents a dividend increase of +4.4%, marking the 50th straight year of dividend growth for this quality, regulated gas and electric utility.
Earnings Releases
Benjamin Graham once remarked that earnings are the principal factor driving stock prices.
Each quarter we will provide readers with weekly earnings updates of stocks on ‘The List’ during the calendar earnings season.
The updated earnings calendar can be found here.
Earnings growth and dividend growth tend to go hand in hand, so this information can tell us a lot about the future dividend growth of our quality companies. Monitoring our dividend growers periodically is part of the process, and reading the quarterly earnings releases is a good place to start.
No earnings reports from companies on ‘The List’ this week
Last week, no companies on ‘The List’ reported earnings.