MP Market Review – February 23, 2024
Last updated by BM on February 26, 2024
Summary
This is a weekly installment of our MP Market Review series, which provides updates on the financial markets and Canadian dividend growth companies we monitor on ‘The List’.
- Last week, ‘The List’ was up from the previous week with a YTD price return of +5.0% (capital). Dividends were up and have increased by +5.8% YTD, highlighting the dependable growth in our income.
- Last week, there was one dividend announcement from a company on ‘The List’.
- Last week, there were two earnings reports from companies on ‘The List’.
- Six companies on ‘The List’ are due to report earnings this week.
DGI Scorecard
The List (2024)
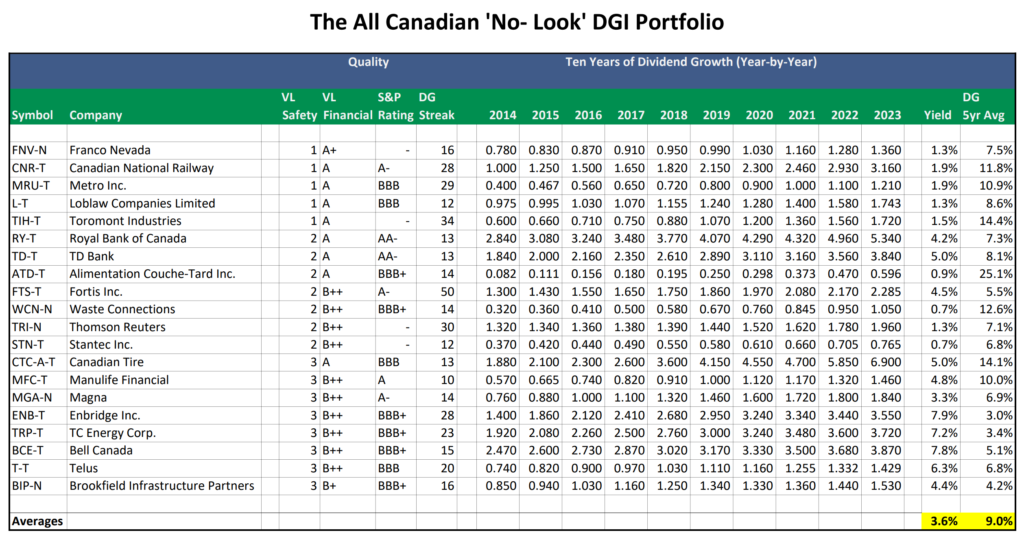
The Magic Pants 2024 list includes 28 Canadian dividend growth stocks. Here are the criteria to be considered a candidate on ‘The List’:
- Dividend growth streak: 10 years or more.
- Market cap: Minimum one billion dollars.
- Diversification: Limit of five companies per sector, preferably two per industry.
- Cyclicality: Exclude REITs and pure-play energy companies due to high cyclicality.
Based on these criteria, companies on ‘The List’ are added or removed annually on Jan. 1. Prices and dividends are updated weekly.
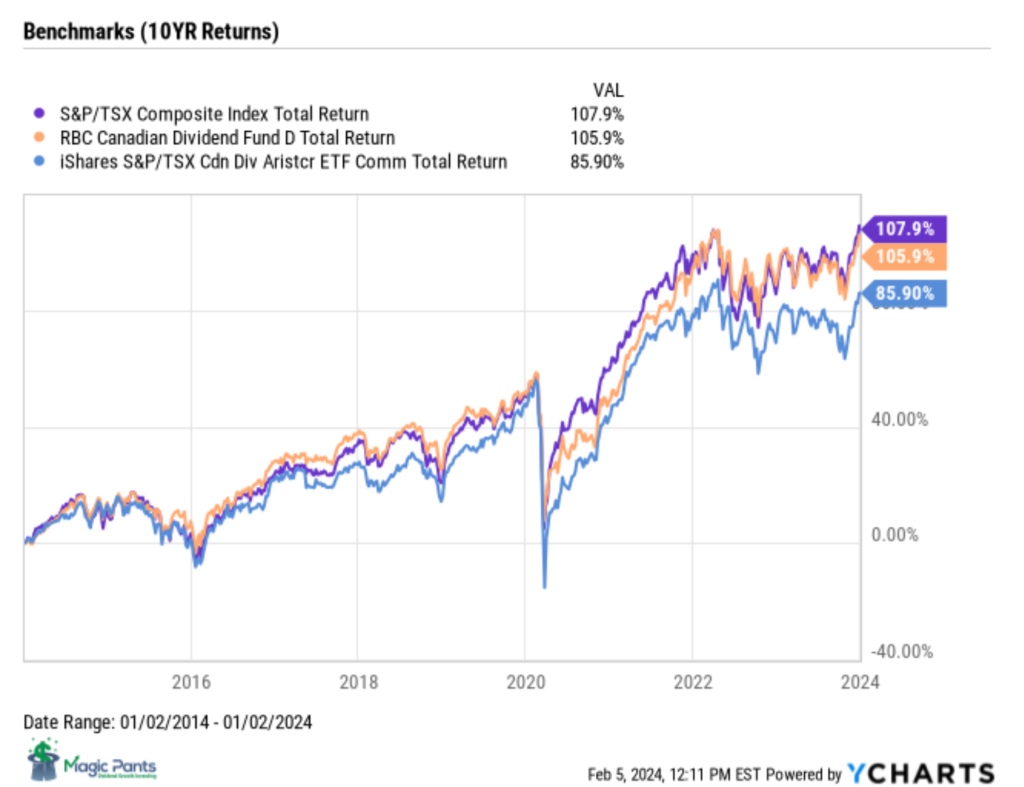
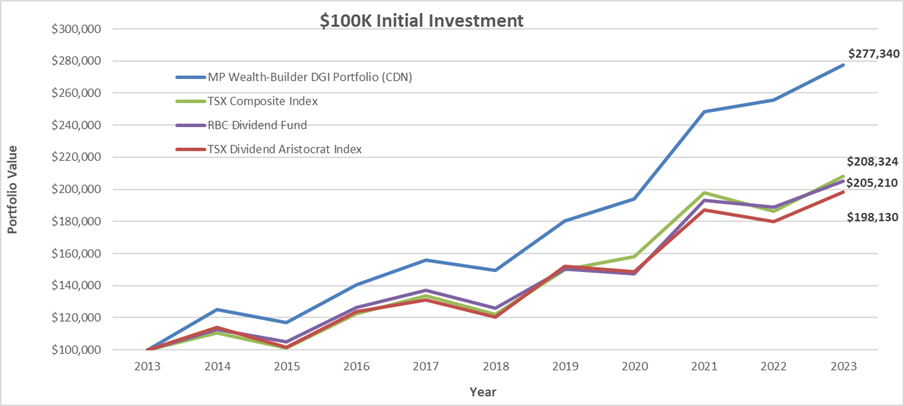
While ‘The List’ is not a standalone portfolio, it functions admirably as an initial guide for those seeking to broaden their investment portfolio and attain superior returns in the Canadian stock market. Our newsletter provides readers with a comprehensive insight into the implementation and advantages of our Canadian dividend growth investing strategy. This evidence-based, unbiased approach empowers DIY investors to outperform both actively managed dividend funds and passively managed indexes and dividend ETFs over longer-term horizons.
For those interested in something more, please upgrade to a paid subscriber; you get the enhanced weekly newsletter, access to premium content, full privileges on the new Substack website magicpants.substack.com and DGI alerts whenever we make stock transactions in our model portfolio.
Performance of ‘The List’
Last week, ‘The List’ was up from the previous week with a YTD price return of +5.0% (capital). Dividends were up and have increased by +5.8% YTD, highlighting the dependable growth in our income.
The best performers last week on ‘The List’ were CCL Industries Inc. (CCL-B-T), up +18.09%; Alimentation Couche-Tard Inc. (ATD-T), up +5.21%; and Loblaw Companies Limited (L-T), up +4.97%.
Brookfield Infrastructure Partners (BIP-N) was the worst performer last week, down -3.65%.
| SYMBOL | COMPANY | YLD | PRICE | YTD % | DIV | YTD % | STREAK |
|---|---|---|---|---|---|---|---|
| ATD-T | Alimentation Couche-Tard Inc. | 0.8% | $86.27 | 12.4% | $0.70 | 17.4% | 14 |
| BCE-T | Bell Canada | 7.9% | $50.76 | -6.3% | $3.99 | 3.1% | 15 |
| BIP-N | Brookfield Infrastructure Partners | 4.4% | $30.62 | -0.2% | $1.62 | 5.9% | 15 |
| CCL-B-T | CCL Industries Inc. | 1.7% | $68.94 | 19.2% | $1.16 | 9.4% | 22 |
| CNR-T | Canadian National Railway | 1.9% | $177.69 | 6.5% | $3.38 | 7.0% | 28 |
| CTC-A-T | Canadian Tire | 4.9% | $141.91 | 2.4% | $7.00 | 1.4% | 13 |
| CU-T | Canadian Utilities Limited | 5.8% | $30.78 | -4.2% | $1.79 | 0.0% | 52 |
| DOL-T | Dollarama Inc. | 0.3% | $105.69 | 11.2% | $0.28 | 5.8% | 13 |
| EMA-T | Emera | 5.9% | $48.56 | -4.4% | $2.87 | 3.0% | 17 |
| ENB-T | Enbridge Inc. | 7.8% | $47.00 | -2.9% | $3.66 | 3.1% | 28 |
| ENGH-T | Enghouse Systems Limited | 2.5% | $35.12 | 3.4% | $0.88 | 4.1% | 17 |
| FNV-N | Franco Nevada | 1.3% | $107.72 | -2.2% | $1.44 | 5.9% | 16 |
| FTS-T | Fortis Inc. | 4.4% | $53.17 | -3.1% | $2.36 | 3.3% | 50 |
| IFC-T | Intact Financial | 2.1% | $234.55 | 15.4% | $4.84 | 10.0% | 19 |
| L-T | Loblaw Companies Limited | 1.2% | $144.60 | 12.5% | $1.78 | 2.4% | 12 |
| MFC-T | Manulife Financial | 4.9% | $32.81 | 13.6% | $1.60 | 9.6% | 10 |
| MGA-N | Magna | 3.4% | $54.34 | -2.1% | $1.84 | 0.0% | 14 |
| MRU-T | Metro Inc. | 1.8% | $73.69 | 7.6% | $1.34 | 10.7% | 29 |
| RY-T | Royal Bank of Canada | 4.1% | $133.22 | 0.1% | $5.52 | 3.4% | 13 |
| SJ-T | Stella-Jones Inc. | 1.2% | $78.74 | 2.8% | $0.92 | 0.0% | 19 |
| STN-T | Stantec Inc. | 0.7% | $112.25 | 7.3% | $0.78 | 2.0% | 12 |
| T-T | Telus | 6.2% | $24.32 | 2.5% | $1.50 | 5.2% | 20 |
| TD-T | TD Bank | 5.0% | $81.62 | -3.6% | $4.08 | 6.3% | 13 |
| TFII-N | TFI International | 1.1% | $148.70 | 13.3% | $1.60 | 10.3% | 13 |
| TIH-T | Toromont Industries | 1.5% | $125.58 | 11.3% | $1.92 | 11.6% | 34 |
| TRI-N | Thomson Reuters | 1.4% | $158.29 | 10.4% | $2.16 | 10.2% | 30 |
| TRP-T | TC Energy Corp. | 7.2% | $53.70 | 2.7% | $3.84 | 3.2% | 23 |
| WCN-N | Waste Connections | 0.7% | $170.15 | 14.8% | $1.14 | 8.6% | 14 |
| Averages | 3.3% | 5.0% | 5.8% | 21 |
Note: Stocks ending in “-N” declare earnings and dividends in US dollars. To achieve currency consistency between dividends and share price for these stocks, we have shown dividends in US dollars and share price in US dollars (these stocks are listed on a US exchange). The dividends for their Canadian counterparts (-T) would be converted into CDN dollars and would fluctuate with the exchange rate.
DGI Clipboard
“Investing is the process of laying out money now to receive more money in the future. It’s like planting a seed and waiting for it to grow into a tree. Or, it’s like holding a beach ball underwater. The longer and harder you push it down, the higher and faster it will fly when you finally let it go.”
– Peter Lynch
The Beach Ball Effect: CCL Industries Inc.’s Price-Dividend Divergence
Have you ever tried sitting on a beach ball in your backyard pool? It is only a matter of time before you lose your balance, and it shoots several feet in the air! Much to the delight of your kids I might add.
This week’s post is about trying to hold a stock underwater when the fundamentals make it almost impossible to do so.
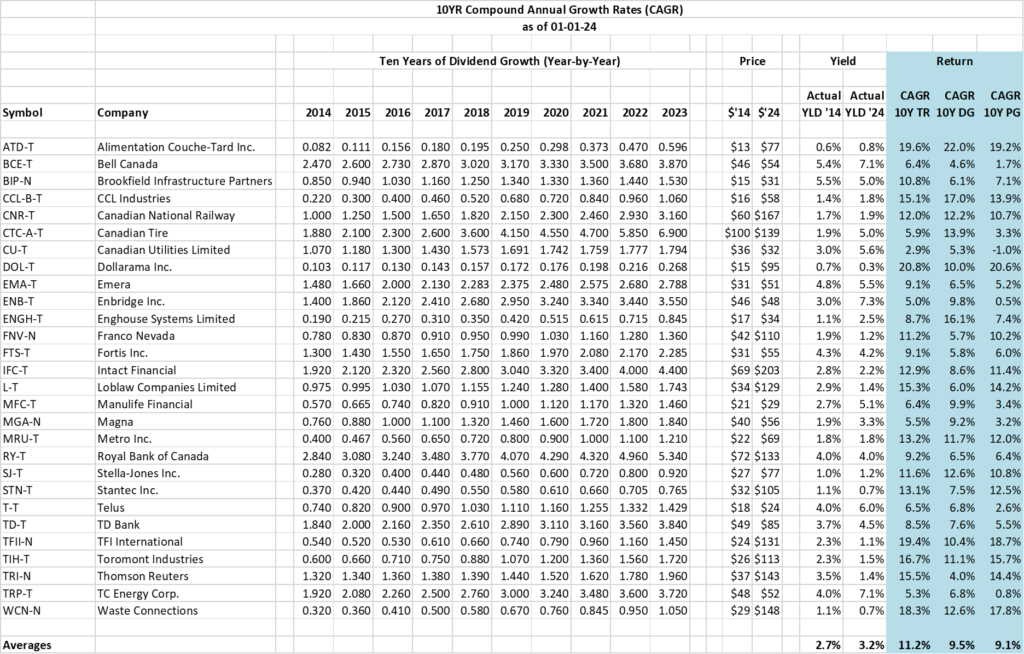
To identify stocks that may be ready to explode like our beachball, we first look for companies whose dividend growth has traditionally aligned closely with their price growth over the long term but for some reason are now disconnected.
One such company on ‘The List’ was CCL Industries Inc. When we ran a ten-year dividend growth vs price growth chart from YCHARTS for this quality dividend grower, we noticed something a bit odd. Up until 2020 the growth of the dividend and the price growth were closely aligned. COVID hit and the gap widened but returned to its historical alignment pattern shortly after. The divergence that caught our eye began in 2022 and continued for all of 2023. Up until last week, the gap between dividend growth and price growth was the largest it had been in ten years.
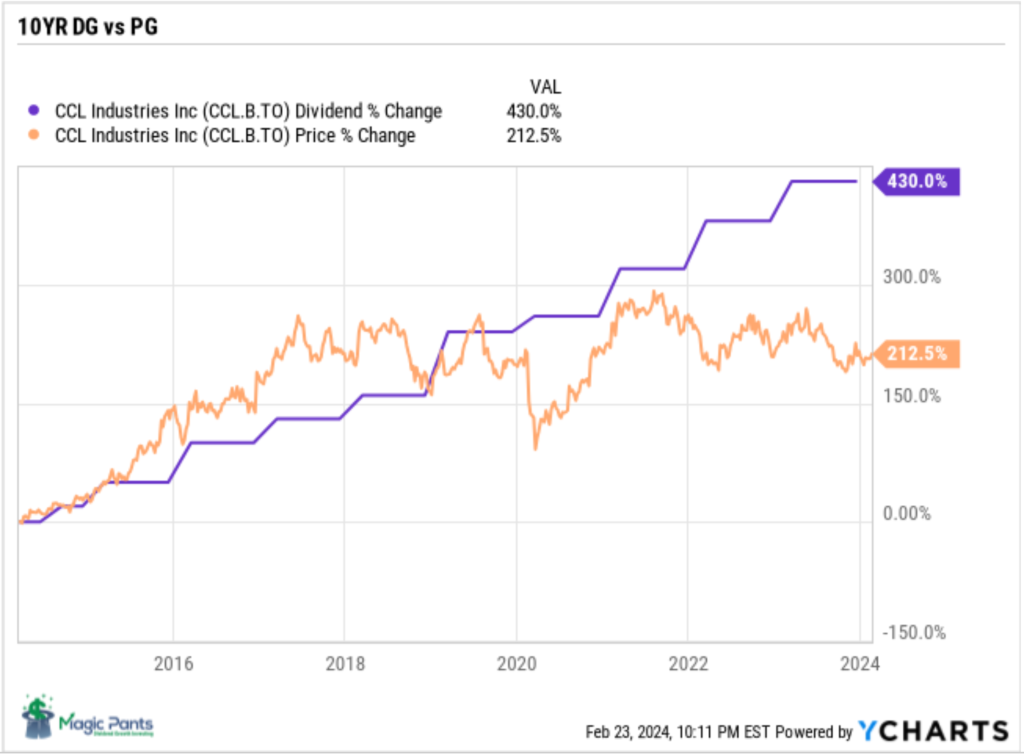
Source: YCHARTS
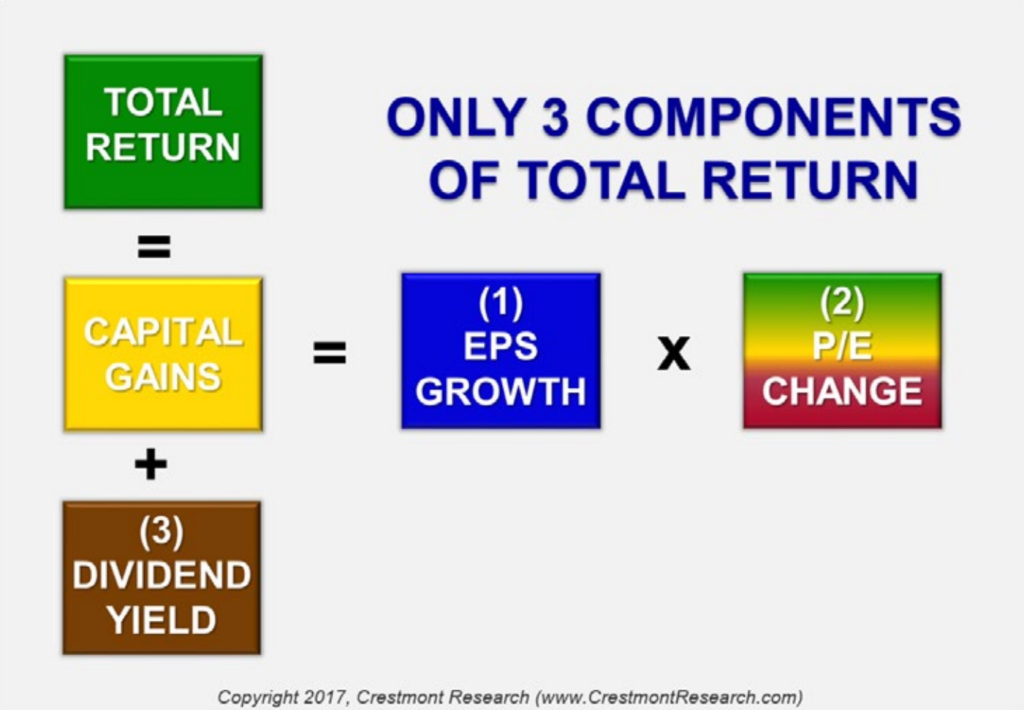
With CCL Industries Inc.’s dividend and fundamentals (operating earnings, operating cash flow, EBITDA and Sales) all increasing over the last few years we were at a loss as to why the price was not moving in tandem with the dividend and fundamentals.
We decided to run a ten-year yield chart on CCL Industries Inc. in YCHARTS to dig deeper into what we were seeing. This chart helps us test valuation based on a popular approach, dividend yield theory, coined by a company called IQ Trends in the 1960’s.
The dividend yield theory is a simple and intuitive approach to valuing dividend growth stocks. It suggests that the dividend yield of quality dividend growth stocks tends to revert to the mean over time, assuming that the underlying business model remains stable. In practical terms, this means that if a stock is currently paying a dividend yield above its ten-year average annual yield, there is a higher probability that its price will increase to bring the yield back to its historical average. Price and yield work in opposite directions.

Source: YCHARTS
The results confirmed our assumption that CCL Industries Inc. was significantly undervalued at its current price.
The disconnect between dividend growth and price growth shown in the 10YR DG vs PG chart and the much higher current yield of displayed in the 10YR Yield Chart along with strong fundamentals, signaled to us that any positive news coming out of the next earnings report could be just the catalyst needed to bring both metrics back in alignment by sending the stock price higher.
We were right. We sent out a DGI Alert to our paid subscribers to purchase CCL Industries Inc. two days before earnings were released. Since the earnings announcement and subsequent dividend increase, the stock has now shot up close to 20%!
The key takeaway is that our DGI valuation metrics worked but the precise timing of our purchases can be more challenging to predict. Quality dividend growth companies with strong fundamentals, rarely get out of alignment with their dividend growth and price growth and when they do, the price can behave like a ‘beach ball under water’ if the gap becomes too wide.
Having the patience to let our DGI process play out and not be distracted by the short-term volatility of the market has been the hallmark of our outperformance over the long term.
Check us out on magicpants.substack.com for more info in this week’s issue….