“You have a pair of pants. In the left pocket, you have $100. You take $1 out of the left pocket and put in the right pocket. You now have $101. There is no diminution of dollars in your left pocket. That is one magic pair of pants.”

Yield on Cost: Getting the Respect it Deserves

Posted by BM on August 27, 2021 

“We believe yield on cost (the indicated dividend divided by the per share purchase price) may be a more accurate measure of the long-term value of a dividend.”

-Standard and Poors Outlook, September 8, 2004

Yield on Cost (YOC) is a much-maligned term because it is not really the yield that the stock is trading at today. Many investors believe the only yield that really matters is the yield today.

Our two mentors use a different term for YOC. Tom Connolly calls it Greater Dividend Return and Chuck Carnevale calls it Growth Yield. Both agree that it clearly singles out the growing cash flow of our quality dividend growers and is therefore useful as a metric. Imagine beating the index from dividends alone after less than a decade of holding a good dividend grower.

“Some people who do not ‘believe’ in YOC argue that what happened ten or 15 years ago is not always a good indicator of the future. That’s true. I’m not saying that YOC is a good indicator of the future. However, if the dividend has grown since purchase, YOC is a good indicator the company is doing well. If a company has a ‘culture’ of increasing its dividend the pattern could easily continue. If folks are not using YOC to measure because it is rooted in the past, how do they measure their returns? Do they not use a past-connected number also? Growing yield is the essence of what the dividend growth strategy is about. Growing yield drives returns. If the yield does not grow, essentially, you have a bond.”

-Tom Connolly

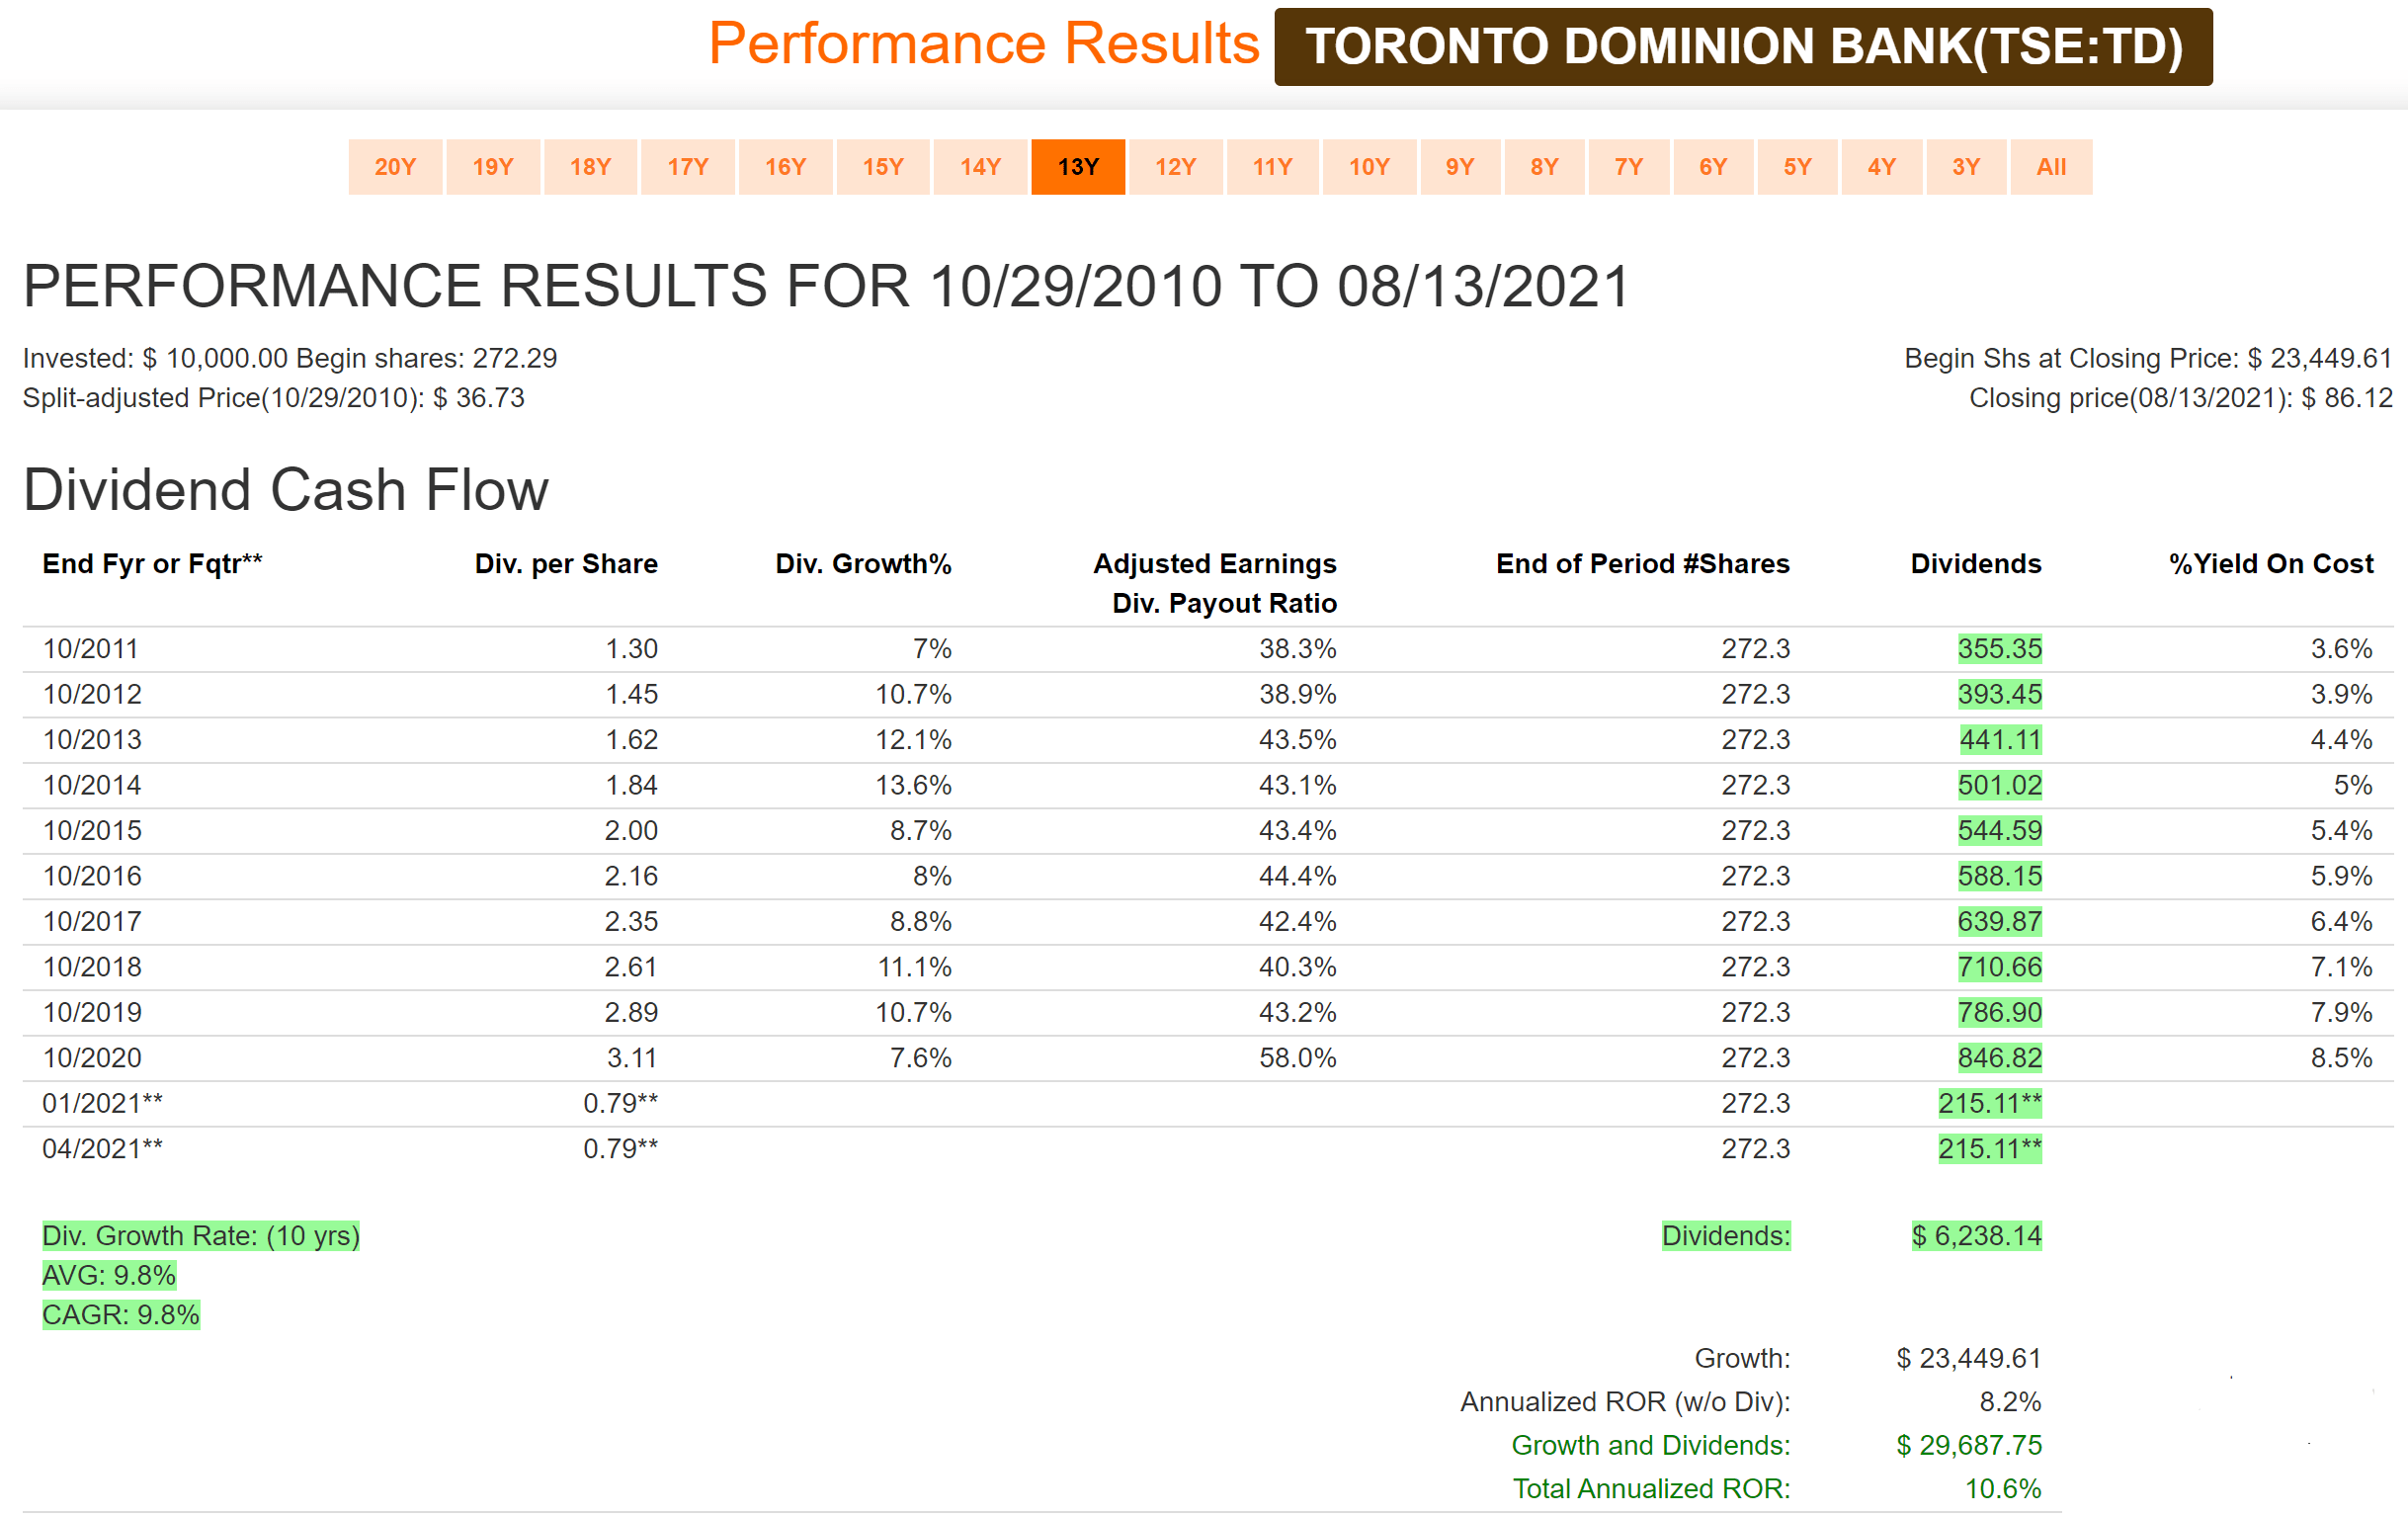
Whenever we analyze decade long returns of our quality dividend growers, we usually show a column for Yield on Cost (YOC). We use historical dividend growth rates to help estimate, based on a starting yield today, what return we can realistically expect to receive in the future from dividends alone. This is important for retirees who require a certain income in their retirement.

‘The List’ YOCs below (over the last decade) tell you a lot about the historical dividend growth of the underlying companies. 10YR_YOC-The List-01-01-2021

If you look closely at the data in the file you will find six companies that now return more than 10% on dividends alone. If you combine capital appreciation and dividends, you end up with a total return of ~15.5% annually over the past decade. I wonder what their fifteen- and twenty-year Greater Dividend Returns/Growth Yields will look like?

In addition to good total returns over time, one of the biggest benefits of the YOC metric is that by focusing on dividend growth returns alone an investor can navigate the short-term price volatility often found in the stock market and focus on building a sound income producing plan for their retirement.

Q2 2021 Earnings Calendar

Posted by JM on August 20, 2021 

Earnings are in! 

As expected, Q2 was a good quarter for the stocks on ‘The List’ with twenty two of our twenty-seven stocks exceeding expectations.

BIP-N was the big winner due to strong organic growth, the contribution from new investments and the recognition of gains on the sale of their Canadian district energy business and smart meter portfolio.

TFII-T gets honorable mention with a 50% beat on estimates.

On the losing side Enghouse Systems Limited (ENGH-T) missed analyst expectations by ~18% on reduced revenue. The shortfall can mainly be attributed to a decrease in licensing revenue from their Vidyo product. Video conferencing solutions like Vidyo saw record use during the early stages of COVID and are starting to taper off as business gets back to normal and more in-person communication. Nonetheless, ENGH-T is one company on ‘The List’ we will pay extra attention to in Q3.

DOL-T, CNR-T, FTS-T, MRU-T were all minor misses; some due to negative foreign exchange impacts while others were returning to pre COVID earnings after seeing an increase during COVID due to their business model.

As part of our process, we monitor earnings releases to make sure our good dividend growers are continuing to grow their earnings and that management continues to provide positive guidance going forward.

Here is ‘The List’ sorted by reporting date complete with the market’s consensus estimates and actual reported results.

SYMBOL COMPANY DATE ESTIMATE RESULT
RY-T Royal Bank of Canada 27-May $2.49 $2.79
TD-T TD Bank 27-May $1.76 $2.04
BNS-T Bank of Nova Scotia 1-Jun $1.76 $1.90
DOL-T Dollarama Inc. 9-Jun $0.38 $0.37
ENGH-T Enghouse Systems Limited 10-Jun $0.45 $0.37
ATD-B-T Alimentation Couche-Tard Inc. 29-Jun $0.42 $0.52
CNR-T Canadian National Railway 20-Jul $1.50 $1.49
TFII-T TFI International 26-Jul $0.96 $1.44
IFC-T Intact Financial 27-Jul $2.42 $3.26
TIH-T Toromont Industries 28-Jul $0.98 $1.02
EQB-T Equitable Group Inc 28-Jul $3.81 $4.05
CU-T Canadian Utilities Limited 29-Jul $0.39 $0.43
FTS-T Fortis 29-Jul $0.59 $0.55
TRP-T Trans Canada 29-Jul $0.96 $1.07
T-T Telus 29-Jul $0.26 $0.26
ENB-T Enbridge Inc. 30-Jul $0.57 $0.67
SJ-T Stella-Jones Inc. 3-Aug $1.47 $1.76
WCN-N Waste Connections 4-Aug $0.77 $0.81
CCL-B-T CCL Industries 5-Aug $0.77 $0.89
BIP-N Brookfield Infrastructure Partners 5-Aug $0.11 $0.61
BCE-T Bell Canada 5-Aug $0.78 $0.83
MGA-N Magna 6-Aug $1.39 $1.40
EMA-T Emera 10-Aug $0.54 $0.54
MRU-T Metro 10-Aug $1.13 $1.06
FNV-N Franco Nevada 11-Aug $0.92 $0.96
AQN-N Algonquin Power & Utilities 11-Aug $0.13 $0.15
CTC-A-T Canadian Tire 12-Aug $2.88 $3.72

‘The List’ – Portfolio Review (August 2021)

Posted by BM on August 15, 2021 

Each month I will walk through our valuation process using a stock on ‘The List’ that meets our minimum screen of 6.5% EPS Yld. This month it is Toronto Dominion Bank (TD-T).

Valuation is the second step in our three-step process. Buying when our quality stocks are sensibly priced will help ensure our future investment returns meet our expectations. We rely heavily on the fundamental analyzer software tool (FASTgraphs) to help us understand the fundamentals of the stocks we invest in and then read the company’s website for investor presentations and recent earnings reports to learn more.

Intro:

The Toronto-Dominion Bank (the Bank) operates as a bank in North America. The Company’s segments include Canadian Retail, U.S. Retail, Wholesale Banking and corporate. Canadian Retail segment serves customers in the Canadian personal and commercial banking, wealth, and insurance businesses. Personal Banking provides financial products and advice through its network of automated teller machines (ATM), telephone, digital and mobile banking. U.S. Retail comprises the Bank’s personal and business banking operations under the brand TD Bank and wealth management in the United States. Wholesale Banking offers a range of capital markets and corporate and investment banking services, including underwriting and distribution of new debt and equity issues, providing advice on strategic acquisitions and divestitures, and meeting the daily trading, funding, and investment needs of its clients.

TD is Canada’s second largest bank by market cap. Right behind Royal Bank.

Historical Graph:

Performance Results
Source: FASTgraphs

Comments:

Toronto Dominion tracks its average P/E very closely. As you can see from the Blue Line on the graph (Average P/E) and the Black Line (Price), there is typically very little variance. Investment opportunities occur when the Black Line falls below the Blue Line with this quality dividend grower. It’s dividend yield (~3.7%) and payout ratio (~40%) are both close to their averages over time, which gives us some comfort with the safety of the dividend at the current price.

Performance Graph:

Price Correlated with Fundamentals
Source: FASTgraphs

Comments:

Toronto Dominion has the best dividend growth rate (9.8%/year) of all the big banks in Canada over the last decade. An above average starting yield with a good dividend growth rate means it doesn’t take long for your income to compound and grow. Cash flow is all important in what we do.

It is relevant to note that the dividend was frozen in 2020 by regulators and TD has yet to announce an increase in 2021.

Note:

Regulators in many regions imposed limits or bans on dividends near the onset of the Covid-19 pandemic, anticipating that the sudden drop in economic activity could lead to cascading loan defaults that would diminish banks’ capital. Canadian lenders, like their U.S. peers, took large provisions for potential losses in the early days of the crisis, but have now returned to higher profit levels.

The Office of the Superintendent of Financial Institutions is expected to lift those restrictions in the second half, which would result in significant dividend hikes at most Big Six banks, according to an analysis by Bloomberg Intelligence.

Source: Bloomberg

Estimated Earnings:

Forecast
Source: FASTgraphs

Comments:

There are ~ twelve analysts covering Toronto Dominion in 2021/2022. Earnings in 2021 are expected to be up significantly over 2020 so this is a bit of an anomaly (Red Triangle). With most of the good news factored in already, analysts don’t see a lot of price appreciation out until the end of 2022.

Analyst Scorecard:

Analyst Scorecard
Source: FASTgraphs

Comments:

Analyst estimates over the years are quite accurate based on one and two-year earnings projections. Analysts projections have hit 83% of the time on one year estimates and 75% accuracy on two-year estimates.

Recent Earnings Report-Q2 2021:

Second Quarter Financial Highlights, compared with the second quarter last year:

Reported diluted earnings per share were $1.99, compared with $0.80.

Adjusted diluted earnings per share were $2.04, compared with $0.85.

Reported net income was $3,695 million, compared with $1,515 million.

Adjusted net income was $3,775 million, compared with $1,599 million.

Year-To-Date Financial Highlights, six months ended April 30, 2021, compared with the corresponding period last year:

Reported diluted earnings per share were $3.76, compared with $2.42.

Adjusted diluted earnings per share were $3.86, compared with $2.51.

Reported net income was $6,972 million, compared with $4,504 million.

Adjusted net income was $7,155 million, compared with $4,671 million.

“TD reported strong results in the second quarter, reflecting the underlying strength of our diversified businesses, improving economic conditions and our prudent approach to managing risk,” said Bharat Masrani, Group President and CEO, TD Bank Group. “We continued to invest in our people, capabilities and technology to position our business for growth as economies re-open and consumer and business activity recovers.”

“TD is strong and well-capitalized, and we continue to adapt and grow through this time of disruption. Our performance demonstrates the strength of our proven business model, brought to life through the efforts and resilience of our 90,000 colleagues across the globe who live our purpose and demonstrate a deep commitment to the Bank, those we serve, and the communities where we live and work,” concluded Masrani.

Summary:

The banks have been on fire in the last year with the sector up over 50% from their 2020 lows. Valuation is a bit ‘frothy’ compared to historical norms which limits short term upside on price appreciation. With that said, TD is one of the highest quality (Value Line Financial Rating of ‘A’) dividend growers in Canada with a stellar record of consecutive dividend payments.

“Valuations control long-term returns. The higher the price you pay today for each dollar you expect to receive in the future, the lower the long-term return you should expect from your investment.”

-John Hussman

Toronto Dominion reports it’s Q3 results on August 26, 2021 which will give us a better idea of when dividend increases will resume. 

We buy quality individual dividend growth stocks when they are sensibly priced and hold for the growing income.