“You have a pair of pants. In the left pocket, you have $100. You take $1 out of the left pocket and put in the right pocket. You now have $101. There is no diminution of dollars in your left pocket. That is one magic pair of pants.”

Dividend Yield Theory

Posted by BM on November 29, 2021 

“A stock is not a purchase until it’s yield reaches the buy range established by the stock’s own unique dividend yield history.”

– Anthony Spare, Relative Dividend Yield

How to identify value (sensible price) to maximize the return on our investment is key to our process. How do we know what a sensible price looks like? Dividend yields can help paint a picture for us.

Popularized by Investment Quality Trends (IQT) in the 1960’s, ‘Dividend Yield Theory’ is simple and intuitive. It basically says that for quality dividend growth stocks, meaning those with stable business models that don’t significantly change over time, dividend yields tend to revert to the mean.

What makes ‘Dividend Yield Theory’ simple to understand is that if the current yield is above the ‘historical yield’ (its mean), then the stock is likely undervalued and if it is below, it is likely overvalued.

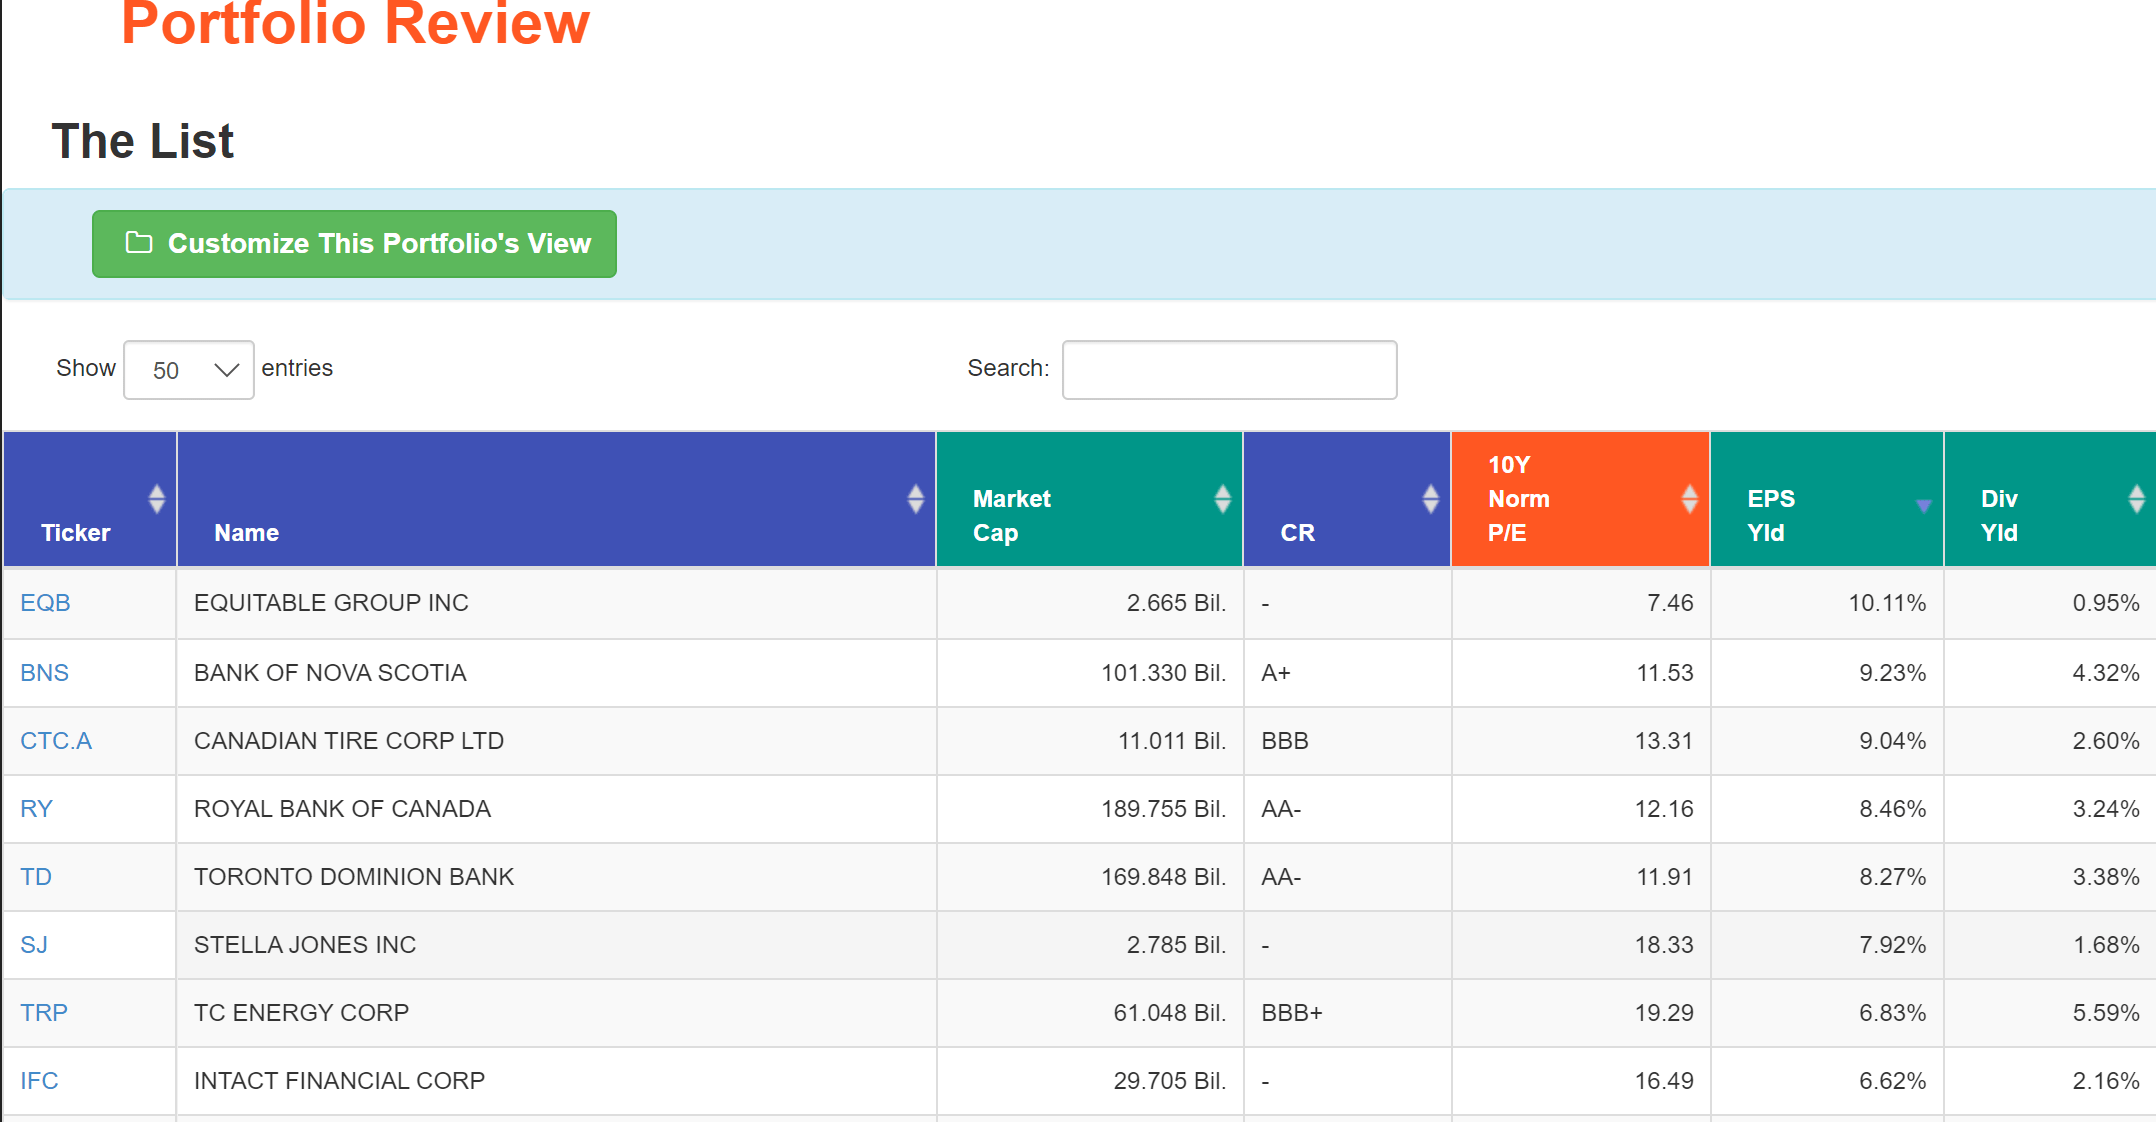
To explain, let’s begin with a yield chart of one of the stock’s on ‘The List’, Fortis Inc. (FTS.TO).

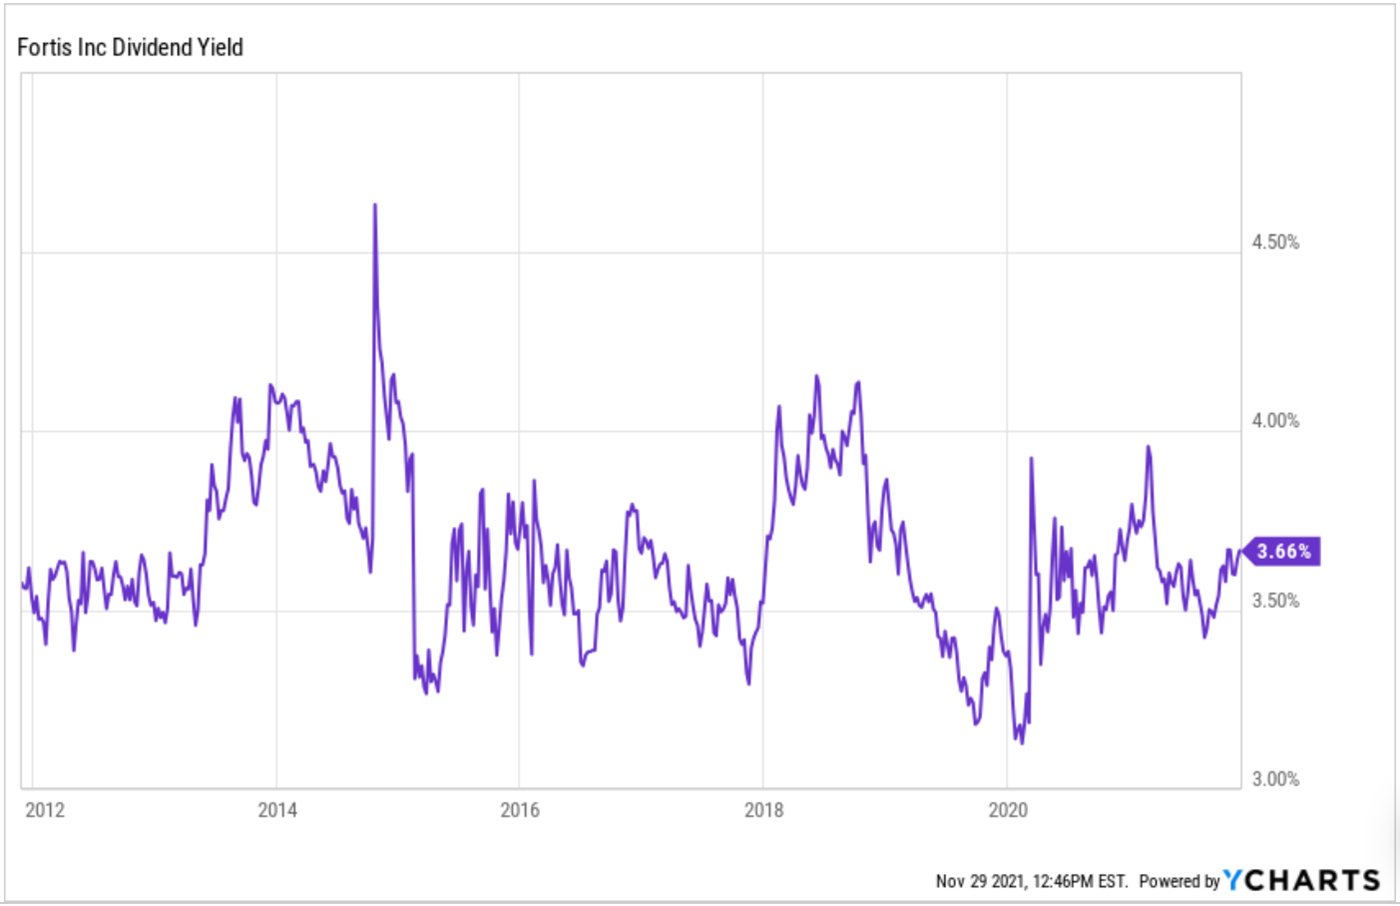
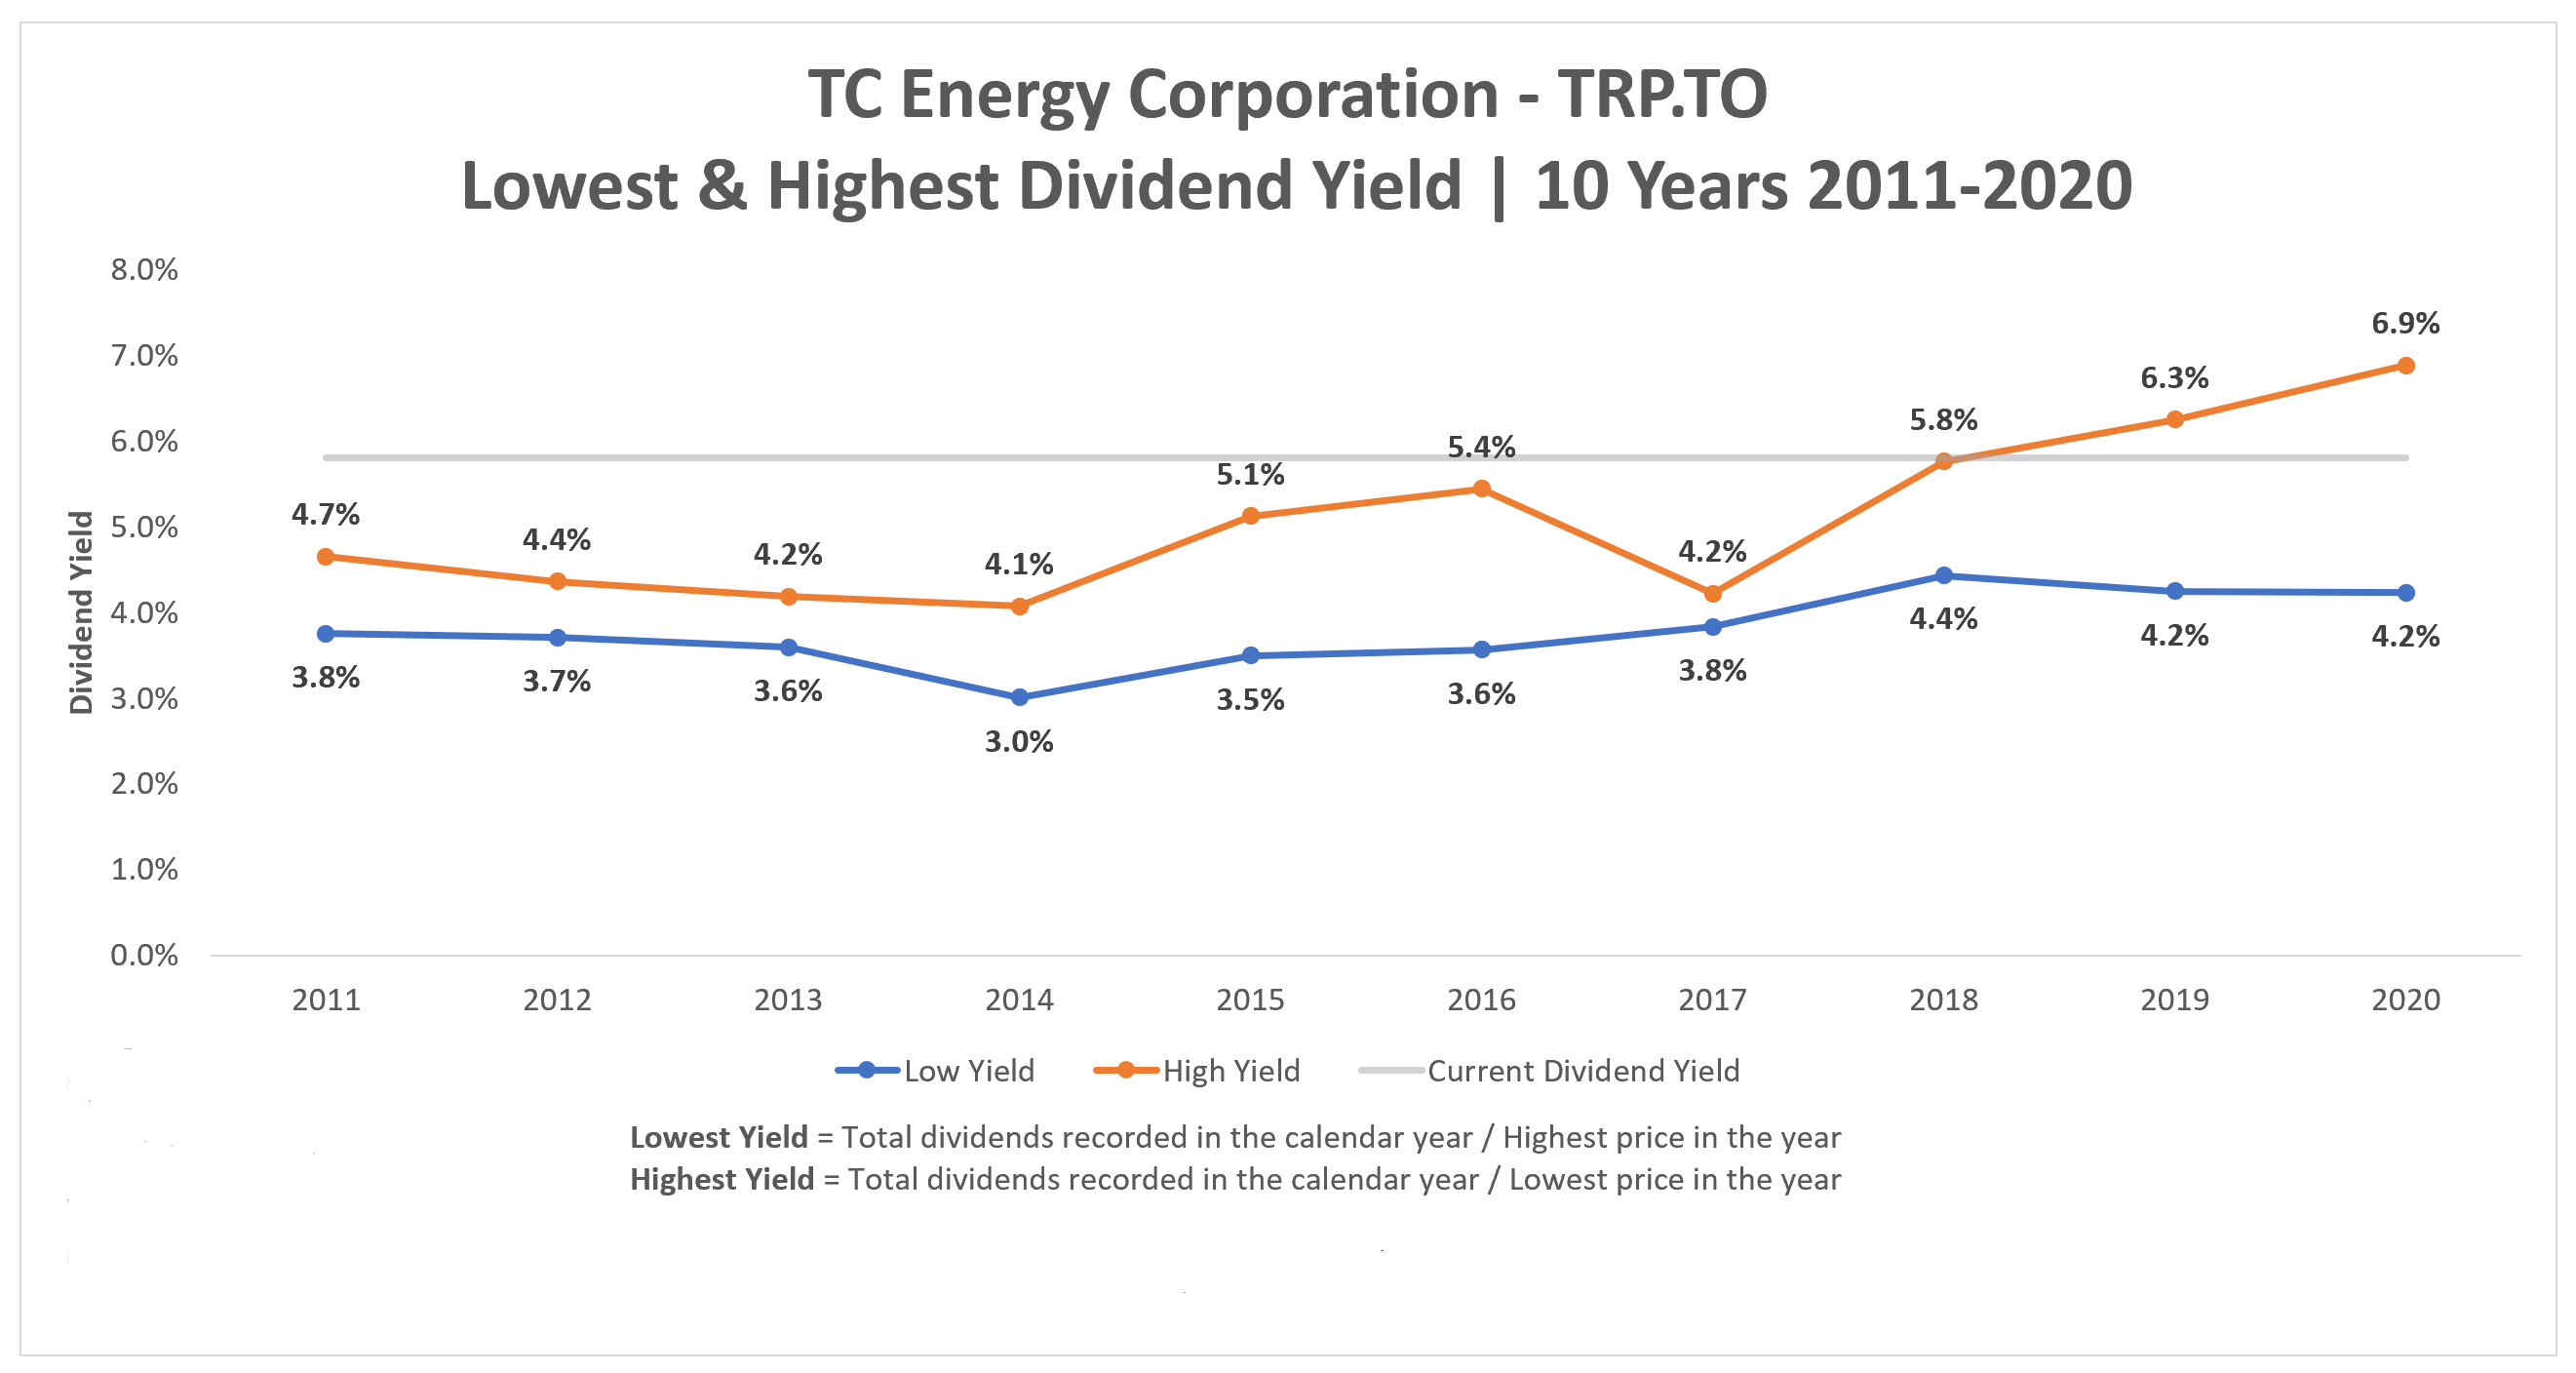
Reviewing a 10 Year Yield Chart is one of the first things we do when we are assessing valuation. We want to know what the stocks yield history looks like and try and determine if there are any repetitive patterns, we should be aware of.

Now let’s add price data to the chart.

Fortis Yield vs Price

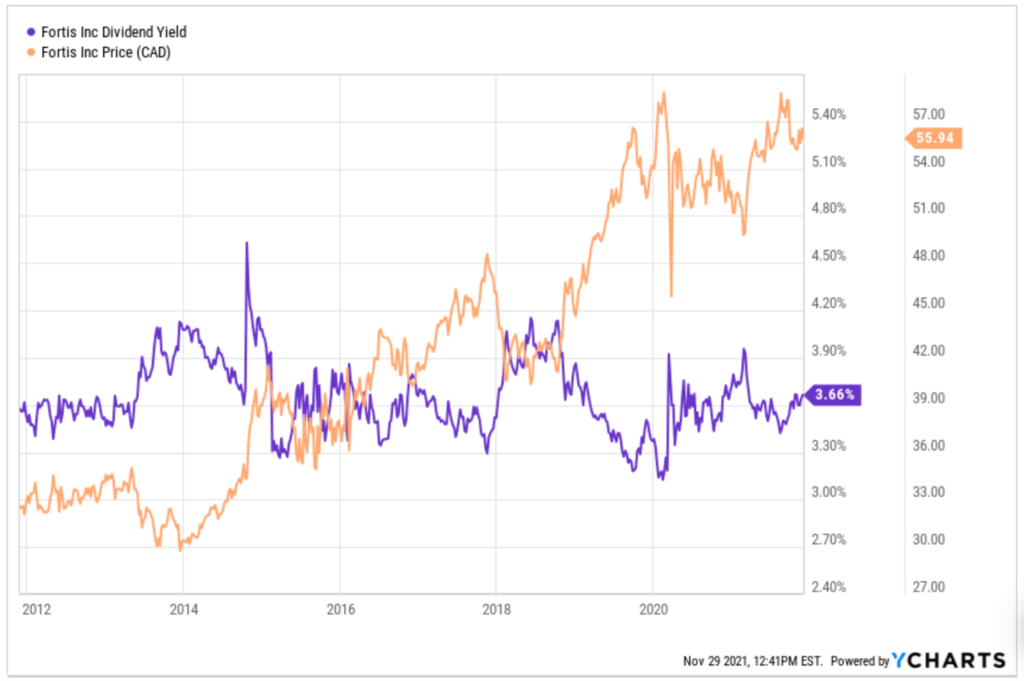
First it should be noted that yield and price move in opposite directions. A rising price sends the yield lower, and a falling price sends the yield higher.

Reviewing the yield chart, we can see that Fortis tends to trade between a 3% and 4% dividend yield with very few exceptions. If we were to add an undervalue line it would be at a price when the yield goes above a 4% yield and an overvalue line would be at a price below a 3% yield. Knowing this, you can time your purchases when Fortis approaches or exceeds the undervalue historical yield of 4%.

Another observation from this chart and of ‘Dividend Yield Theory’ in general is that the yield acts as a ‘floor of safety’ with respect to the price. Once the high end of our historical yield is met, investors jump back in looking for the higher yield and the stock’s price reverts from its downward trend and begins to move higher. This is one of the good things about dividend growth stocks in a bear market, they don’t tend to drop as much as the rest of the market and recover faster, primarily because of their yield.

IQT has been successful for almost sixty years using ‘Dividend Yield Theory’ as the cornerstone of their investing methodology. Buy at undervalue, hold through the rising trend, sell at overvalue, rinse, and repeat. They also use similar qualitative characteristics to what we use to screen for only the highest quality companies. Of all the investing newsletters it tracks, Hulbert Financial Digest lists IQT on its Honour Roll, outperforming the S&P 500 index in all time periods.

As dividend growth investors we use ‘Dividend Yield Theory’ as a valuation tool to ensure we purchase at a sensible price and then hold for the growing income. If extreme overvaluation occurs, we may look at trimming our position using ‘Dividend Yield Theory’ as well.

Fortis has a very consistent yield history, so it is a good example of ‘Dividend Yield Theory’ in action. Excessively higher than average yields or yields that stay inflated for long periods of time could point to a problem with the company so be careful about applying ‘Dividend Yield Theory’ to all dividend paying stocks unilaterally. As Anthony Spare’s quote at the top so eloquently points out, “…stocks have their own unique dividend yield history.”

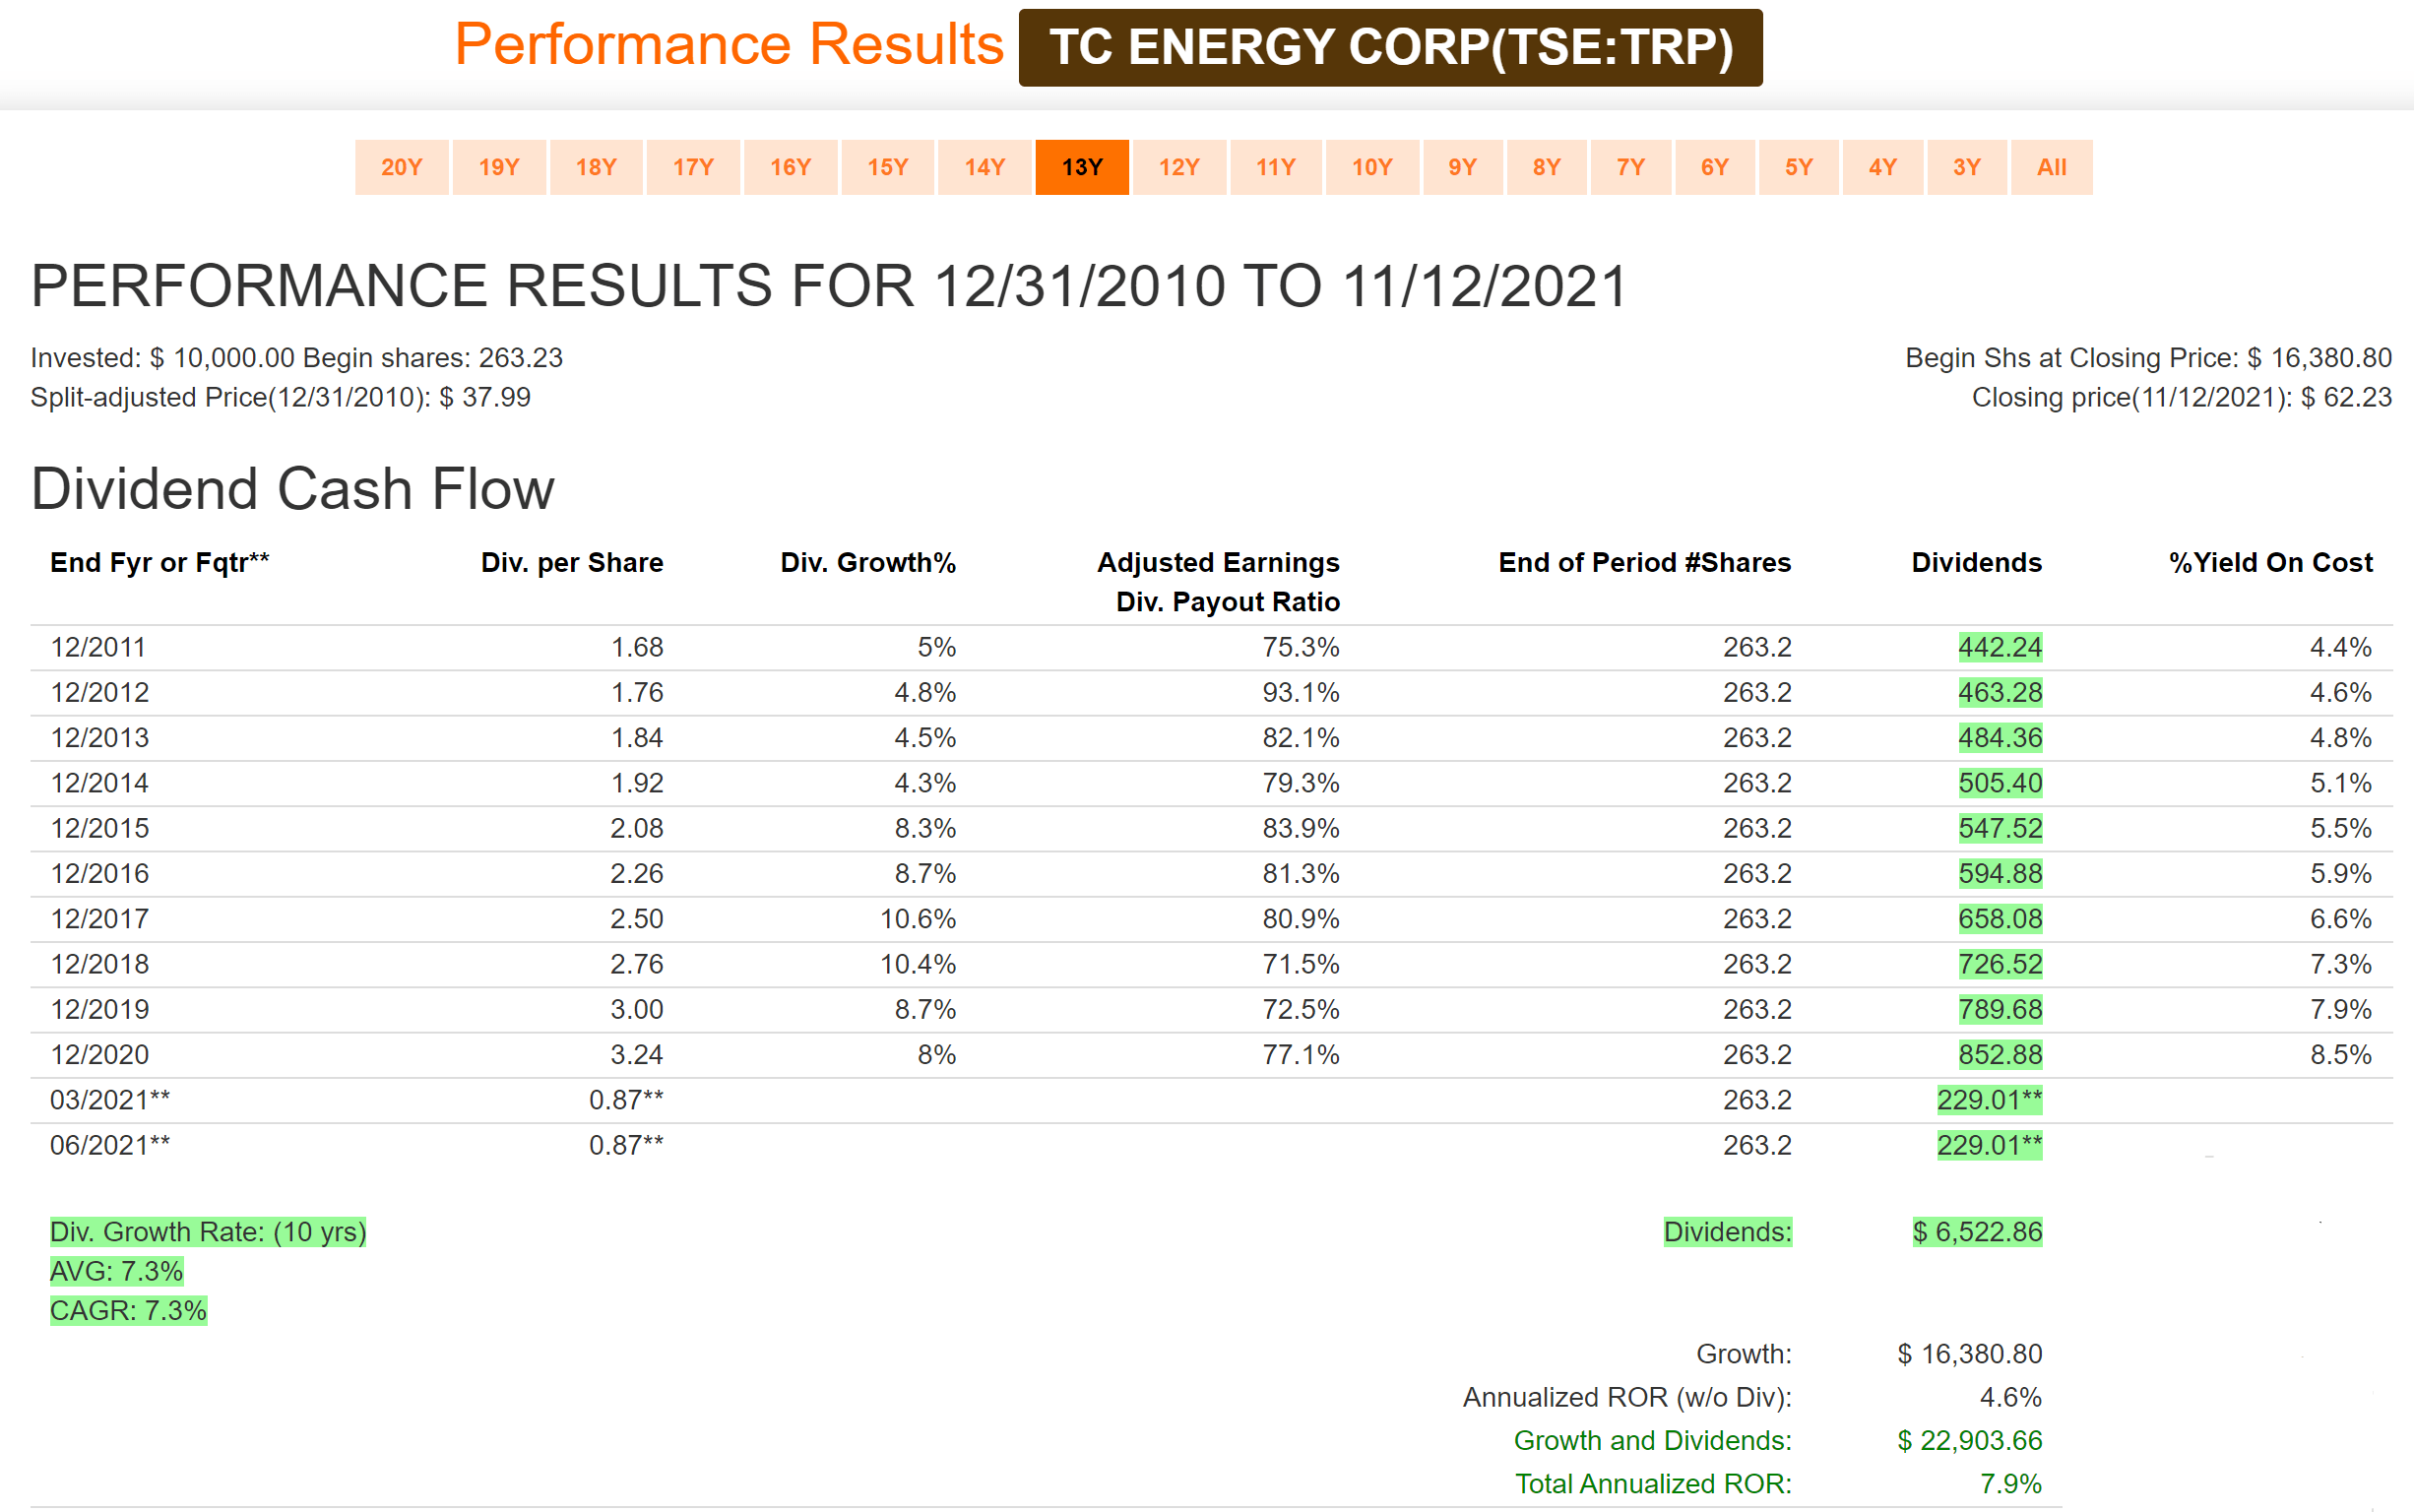
P.S. If Fortis’ yield is similar today to what it was in 2011 and the price has almost doubled what do you think has happened to its dividend?

Hint: Dividend/Price = Yield

Q3 2021 Earnings Calendar

Posted by JM on November 22, 2021 

Earnings are in! 

As part of our process, we monitor earnings releases to make sure our good dividend growers are continuing to grow their earnings and that management continues to provide positive guidance going forward. See full earnings calendar at the bottom of the post.

As expected, Q3 was another good quarter for the stocks on ‘The List’ with twenty one of our twenty-seven stocks meeting or exceeding Analyst expectations.

Beats:

Brookfield Infrastructure Partners (BIP-N) was our big winner again due to earnings contributions from a recent acquisition (Inter Pipeline) and the sale of a US district energy operation which closed in July.

Intact Financial (IFC-T) was also up significantly, exceeding estimates by over 50%. This was primarily due to the additional earnings provided by the RSA Insurance Group acquisition in June of this year.

“RSA contributed 8% accretion to Q3-2021 NOIPS, bringing accretion to 9% for the four-month period since closing. Given the overall strength of Intact’s results, immediate high single-digit accretion is evidence of the quality of the acquired portfolio. We have increased confidence in achieving our target of high single-digit accretion in the first 12 months and upper teens within 36 months of closing.”

Great to see our companies on ‘The List’ acquiring and integrating successfully. This bodes well for continued growth.

Dividend Increases:

A few of our dividend growers did exactly that, extending their dividend growth streaks and announcing dividend increases in Q3, getting a head start on 2022.

TFII-T from .23 to .27 up 17.4%
WCN-N from .205 to .23 up 12.2%
CTC-A-T from 1.175 to 1.3 up 10.6%
IFC-T from .83 to .91 up 9.64%
FTS-T from .505 to .535 up 5.94%
EMA-T from .6375 to .6625 up 3.92%
T-T from .3162 to .3274 up 3.54%

In the news:

Equitable Group Inc. (EQB-T) announces two for one split of its common shares this quarter. We sent out a tweet when this happened. We mentioned that we like stock splits for the simple reason they prove that there has been growth.

Another announcement of significance this quarter was the lifting of pandemic-related restrictions that prevented banks and insurers from raising dividends and buying back shares. We will be watching our bank stocks on ‘The List’ closely for dividend increases when they report Q4 earnings later this year.

Misses:

The stocks that surprised the most with significant earnings misses were MGA-N and SJ-T.

Magna International Inc. (MGA-N) missed expectations due to a sales decrease of 13% in Q3.

“Industry pressures intensified in the third quarter of 2021, resulting in a challenged operating environment. As a result of semiconductor chip shortages, our customers’ production schedules were unpredictable, causing labour and other operational inefficiencies at our facilities. Semiconductor chip shortages and related production disruptions are expected to continue into 2022, and the negative impacts continue to exceed our expectations from earlier this year. Our results were also negatively impacted by inflationary cost increases in production inputs including freight, labour and commodities.”

We will watch closely to see if the uncertainties above are transitory in nature or become longer term concerns.

Stella Jones Inc. (SJ-T) missed earnings expectations by 20%. Management attributes the miss to the volatility of lumber prices during the quarter which increased their costs in their utility pole and railway ties segments that outpaced any price adjustments. They also saw a softening of demand in their logs and lumber sales. Management remains confident in the near term that revenue and profitability will be up year over year and announced an acquisition during the quarter, Cahaba Pressure Treated Forest Products Inc.

“Based on current market conditions and assuming the conclusion of the acquisitions of Cahaba Pressure and Cahaba Timber, management is forecasting sales, EBITDA and EBITDA margin in 2022 to be comparable to the solid results expected in 2021. The Company anticipates that the robust demand for utility poles, the sustained railway ties maintenance demand and the contribution from the pending acquisitions will offset the normalization of residential lumber sales in 2022.”

We are always wary of earnings misses but management seems confident going into the fourth quarter and beyond. We will give them the benefit of the doubt for now.

Update:

Enghouse Systems Limited (ENGH-T) which we highlighted as an under-performer last quarter showed a slight uptick in fundamental performance. Revenue and EBITDA were up slightly over Q2 and management announced two acquisitions during the quarter. The business seems to be trending in the right direction for now. We will continue to monitor.

Summary:

For the most part the Analysts were close with their estimates, with the median ‘beat’ in the range of 2%. Compare this to last quarter (8%), and earnings estimates are getting a bit more predictable as we come out of the pandemic.

Here is ‘The List’ sorted by reporting date complete with the market’s consensus estimates and actual reported results.

COMPANY DATE ESTIMATE RESULT
Bank of Nova Scotia 24-Aug $1.90 $2.01
Royal Bank of Canada 25-Aug $2.71 $3.00
TD Bank 26-Aug $1.92 $1.96
Alimentation Couche-Tard Inc. 31-Aug $0.65 $0.71
Dollarama Inc. 9-Sep $0.49 $0.48
Enghouse Systems Limited 9-Sep $0.39 $0.38
Canadian National Railway 19-Oct $1.43 $1.52
Canadian Utilities Limited 27-Oct $0.31 $0.33
Waste Connections 28-Oct $0.85 $0.89
TFI International 29-Oct $1.26 $1.46
Fortis 29-Oct $0.64 $0.64
Equitable Group Inc. 3-Nov $2.06 $2.07
Toromont Industries 3-Nov $1.13 $1.13
Brookfield Infrastructure Partners 3-Nov $0.13 $0.72
Franco Nevada 4-Nov $0.85 $0.87
Telus 4-Nov $0.28 $0.29
Enbridge Inc. 4-Nov $0.57 $0.59
Bell Canada 4-Nov $0.82 $0.82
Magna 4-Nov $0.64 $0.56
Trans Canada 5-Nov $0.99 $0.99
Stella-Jones Inc. 9-Nov $0.65 $0.52
Intact Financial 10-Nov $1.04 $1.60
CCL Industries 10-Nov $0.87 $0.85
Algonquin Power & Utilities 10-Nov $0.15 $0.15
Emera 11-Nov $0.66 $0.68
Canadian Tire 11-Nov $4.33 $4.20
Metro 17-Nov $0.80 $0.81

‘The List’ – Portfolio Review (November 2021)

Posted by BM on November 15, 2021 

Each month I will walk through our valuation process using a stock on ‘The List’ that meets our minimum screen of 6.5% EPS Yld. This month it is TC Energy Corp. (TRP-T).

Valuation is the second step in our three-step process. Buying when our quality stocks are sensibly priced will help ensure our future investment returns meet our expectations. We rely heavily on the fundamental analyzer software tool (FASTgraphs) to help us understand the fundamentals of the stocks we invest in and then read the company’s website for investor presentations and recent earnings reports to learn more.

Intro:

TC Energy Corp. is a vital part of everyday life – delivering the energy millions of people rely on to power their lives in a sustainable way. Thanks to a safe, reliable network of natural gas and crude oil pipelines, along with power generation and storage facilities, wherever life happens. Guided by the core values of safety, innovation, responsibility, collaboration and integrity, 7,500 people make a positive difference in the communities where they operate across Canada, the U.S. and Mexico.

TC Energy Corp., formerly TransCanada Corp, is an energy infrastructure company. The Company is engaged in the development and operation of North American energy infrastructure, including natural gas and liquids pipelines, power generation and natural gas storage facilities. Its segments include Canadian Natural Gas Pipelines, U.S. Natural Gas Pipelines, Mexico Natural Gas Pipelines, Liquids Pipelines and Energy. The Company operates in three businesses: Natural Gas Pipelines, Liquids Pipelines and Energy. The Natural Gas Pipelines and Liquids Pipelines segments principally consist of its respective natural gas and liquids pipelines in Canada, the United States and Mexico, as well as its regulated natural gas storage operations in the United States. The Energy segment includes its power operations and the non-regulated natural gas storage business in Canada.

Historical Graph:

Historical Graph TRP
Source: FASTgraphs

Comments:

TC Energy Corp. is another of our good dividend growers that trades within a narrow valuation corridor. As you can see from the Blue Line on the graph (Normal P/E) and the Black Line (Price), there is typically very little variance (except for the large dips in 2018 and 2020). Investment opportunities occur when the Black Line falls below the Blue Line or below the Orange Line (15 PE) in a sell-off with this quality dividend grower. The fundamentals show a company whose earnings have grown steadily over the last ten years at an annualized rate of ~6%.

In the yield chart below, you will see a spike in the dividend yield above 6% last year when the price came under pressure. If you believed in ‘Dividend Yield Theory’ you would have been aggressively adding to your position last fall. The yield has come down a bit off its highs but is still trading well above its ten-year average of 4.3%.

Yield Chart:

Yield Chart TRP
Source: Dividend Growth Investing & Retirement

Performance Graph:

Performance TRP
Source: FASTgraphs

Comments:

TC Energy Corp. has an annualized dividend growth rate of 7.3% over the last decade. With a yield on cost of 8.5% from an initial purchase a decade ago, investors now enjoy a healthy return from the dividend alone. Up until their Q3 Earnings announcement last week, investors of this quality company were expecting the trend of 7% dividend growth to continue. Management has now modified their dividend growth outlook to between 3-5% to help strengthen their Balance Sheet and have ‘dry powder’ to take advantage of opportunities when they arise.

Estimated Earnings:

Earnings TRP
Source: FASTgraphs

Comments:

Using the “Normal Multiple’ estimating tool from FASTgraphs, we see a blended P/E average over the last five years of 16.84. Based on fifteen analysts’ forecasts two years out, you can expect an annualized return based on today’s price of 14.21% should TRP.TO trade at its blended P/E.

Blended P/E is based upon a weighted average of the most recent actual value and the closest forecast value.

Analyst Scorecard:

Scorecard TRP
Source: FASTgraphs

Comments:

Analyst estimates over the years are quite accurate based on one and two-year earnings projections. Analysts’ projections have hit or beat 83% of the time on one and two year estimates.

Recent Earnings Report-Q3 2021:

Third quarter 2021 financial results

  • Net income attributable to common shares of $779 million or $0.80 per common share
  • Comparable earnings of $1.0 billion or $0.99 per common share
  • Comparable EBITDA of $2.2 billion
  • Net cash provided by operations of $1.7 billion
  • Comparable funds generated from operations of $1.6 billion

Declared a quarterly dividend of $0.87 per common share for the quarter ending December 31, 2021

Continued to advance our $22 billion secured capital program by investing $1.7 billion in various growth projects

Began construction on the 2022 NGTL System Expansion Program

Continued to actively develop projects on our U.S. Natural Gas Pipeline network that will replace and upgrade certain facilities while reducing emissions including the US$0.8 billion WR project on ANR

Uncontested GTN rate settlement filed with FERC which would set new recourse rates for GTN effective January 1, 2022

Filed Columbia Gas rate settlement with FERC in October which includes continuation of its modernization program with approval expected in early 2022

Executed a 15-year Power Purchase Agreement (PPA) in September for 100 per cent of the power produced and the rights to all environmental attributes from the 297 MW Sharp Hills Wind Farm

Advanced the Bruce Power Unit 6 MCR program on budget and on schedule

Project 2030 launched by Bruce Power with the goal of achieving a site peak output of 7,000 MW by 2030 in support of climate change targets and future clean energy needs

Continued to develop a 1,000 MW pumped hydro storage project in Meaford, Ontario which is designed to provide emission-free electricity to the province while reducing greenhouse gas emissions

Signed a memorandum of understanding in August with Irving Oil to explore the joint development of a series of proposed energy projects focused on reducing greenhouse gas emissions and creating new economic opportunities in New Brunswick and Atlantic Canada

Partnered with Nikola Corporation in October to collaborate on developing, constructing, operating and owning large-scale hydrogen production facilities in the United States and Canada

Issued US$1.25 billion of 3-year and US$1.0 billion of 10-year fixed rate Senior Unsecured Notes in October

Released our 2021 Report on Sustainability in October which includes targets for our sustainability commitments, including reducing the emissions intensity from our operations 30 per cent by 2030 and positioning to achieve net zero emissions from our operations by 2050.

“During the first nine months of 2021, our diversified portfolio of essential energy infrastructure assets continued to perform very well and reliably meet North America’s growing demand for energy,” said François Poirier, TC Energy’s President and Chief Executive Officer.

“We are in the midst of an unprecedented period that is providing a significant number of investment opportunities driven by both the growing demand for energy and the transition to a cleaner energy future, added Poirier. We expect to sanction approximately $7 billion of new projects in 2021 with a risk-adjusted return profile that is consistent with previous investments and anticipate annual amounts of more than $5 billion will be added to our secured projects portfolio in each of the next several years. In order to judiciously fund our attractive suite of growth opportunities, maintain a strong financial position and enhance our already conservative, utility-like dividend payout ratios, we have modified our near-term dividend growth outlook,” continued Poirier. “We now expect to increase our common share dividend at an average annual rate of three to five per cent. While our previous outlook remains affordable and supported by the strong underlying performance of our business, we believe a modest change is prudent given our vast opportunity set. It will allow us to fund a larger portion of our future capital programs through internally generated cash flow, moderate our leverage and continue to deliver superior long-term total shareholder returns.”

Summary:

The market seems to have shaken off the ‘modified near-term dividend growth outlook’ announced last week. Analysts are mostly in agreement with management’s decision to strengthen their Balance Sheet and increase cash flow as opposed to paying out more dividends. Earnings are still projected to be in the traditional 7% range.

In the Magic Pants Wealth Builder (CDN) portfolio we added to our position in TC Energy incrementally last fall when the dividend yield was well above 6%. Once again, our process signaled that this was the time to buy even though the short-term narrative was negative surrounding the cancellation of the Keystone XL pipeline under a Biden administration. The pipeline was indeed cancelled but the stock has rebounded nicely from its December lows and we were able to purchase more income at a discounted price.

Quality companies find a way to overcome short-term setbacks. With no new pipelines being built in the foreseeable future and energy demand increasing, management sees the value of ‘pipe in the ground’ and is optimistic this will help increase margins. Combine that with new projects underway, higher cash flow and a disciplined management team, there is optimism that TC Energy will be able to transition to a cleaner energy future successfully. We will be monitoring our position closely.

As an investor looking for income there is a lot to like about TC Energy Corporation. A twenty-year dividend growth streak, an above average starting yield and currently, modest dividend growth at a sensible price.

The Stay-in-Stocks DGI Strategy

Posted by BM on November 3, 2021 

“The dividend is such an important factor in the success of many stocks, that you could hardly go wrong by making an entire portfolio of companies that have raised their dividends for 10 to 20 years in a row.” Peter Lynch, Beating the Street p. 49

“The best way to handle a situation in which you love a company but not the current price is to make a small commitment and then increase it in the next sell-off.” Peter Lynch, Beating the Street p. 158

Some good advice from Peter Lynch in his book Beating the Street.

Speaking of Peter Lynch, we were recently made aware of an article (Fear of Crashing) in Worth Magazine written by Mr. Lynch and financial writer John Rothchild in 1995 where Lynch advises how to prepare for, react to and recover from a market correction. We found it relevant not only because it is timely with the stock markets at an all-time high but because many of our subscribers are looking for a different withdrawal strategy other than the ‘4% Rule’.

“The strategy I’m proposing can offer the best of both worlds: money to live on that normally comes from bonds and growth that comes from stocks. Here’s how it works. You sink 100 percent of your investment capital into a portfolio of companies that pay regular dividends. You could do this the easy way and invest in an S&P 500 index fund, currently yielding about 3 percent. Or you could select a few “dividend achievers,” as identified by Moody’s. These are the companies that have a habit of raising their dividends year after year no matter what.

Since dividends are paid out of earnings, these dividend achievers couldn’t have compiled such a record without having enjoyed consistent success in their core business, whatever it is. So you’re looking at a group of profitable enterprises with staying power.”

-Peter Lynch

Interesting to note that even in 1995, one of the greatest growth investors of all-time is recommending dividend growth stocks as the core of his ‘Stay-in-Stocks Strategy’.

In a nutshell here is Lynch’s strategy:

Let’s assume you have $500,000 to invest and you need a minimum of $50,000 each year to meet your spending obligations. First start by building a portfolio of quality dividend growth stocks from ‘The List’ with a starting dividend yield of 3%. Year one you will receive $15,000 in dividends ($500,000 x .03). You are still shy of your spending amount. You sell $35,000 in stock to make up the difference.

To some, selling stock that you have recently bought may sound a little scary but once you assume that the portfolio has risen by 8% (historical norm for stocks) during the year, the strategy begins to make a little more sense. Combine the dividends (3%) and capital growth (8%) of the DGI portfolio and you have an average total return of 11% for the year. This return back tests favorably with the stocks on ‘The List’ who achieved a higher total return CAGR of 13.3% for the last decade.

Here are the 10YR Compound Annual Returns of ‘The List’. 10YR_CAGR-The List-01-01-2021

Your portfolio would now be worth $555,000 had you left it alone ($500,000 x 1.11). The fact that you withdrew funds, $15,000 in dividends and sold $35,000 in stock means you begin the second year with a portfolio worth $505,000.

The good dividend growers raise their dividends again in year two and your portfolio value increases at the same rate (8%). At the end of year two, you sell a little bit less stock to reach your spending goal. Every year thereafter, as dividends are raised and stock prices go up, you’re selling less and less stock to cover your expenses. Selling less stock allows your portfolio to grow beyond its original value.

We have included a table below to show you what happens next as companies in your portfolio continue to raise their dividends and stock prices continue to go up at their historical rates.

Although these numbers are theoretical and no market goes up exactly 8% every year, a twenty-year time horizon is long enough to have a high probability that historical norms will be achieved.

This strategy will work for any investor but is particularly suited for those who require more than just dividend income to meet their financial obligations in retirement and are fine withdrawing some of their capital to enjoy a higher standard of living.

If we use the same strategy with a higher starting yield, higher growth rate or are fine with depleting our original portfolio value, we can increase our annual spending even more. Each investor must customize this strategy to suit their own circumstances and goals.

In summary, Lynch asks in his article that if this strategy is such a great idea, why aren’t more people taking advantage of it? His conclusion is that people are too worried about the next correction and are convinced it will happen the day after they invest in stocks. For fear of a market crash they don’t invest at all.

As dividend growth investors we protect ourselves from a market correction by only purchasing companies when they are sensibly priced, buying more when there is a sell-off, and holding for the long term as our growing income drives the prices of our quality stocks even higher.

We buy quality individual dividend growth stocks when they are sensibly priced and hold for the growing income.