MP Market Review – April 22, 2022
Last updated by BM on April 25, 2022
“The difference between what we do and what the others do is quite simple. It has profound implications, though. It’s all in the cash flow and patience needed to wait for it.” Tom Connolly
We recently finished our business plan for the new MP Wealth-Builder Model Portfolio (CDN). As part of the introduction, we referenced a paper written by Jim Garland in 2013 titled ‘Memo to the Darcy Family: To Thine Own Self Be True’.
The paper has a lot of good information. I was very impressed by the long-term objectives of The Jeffrey Company (an endowment fund) that have virtually been unchanged since 1974. I wanted to share them with you because I think they align well with our approach as dividend growth investors.
- To provide over the long term a stable dividend payout in inflation-adjusted dollars;
- To provide through long-term principal appreciation the expanding capital base required to achieve Objective #1 in the face of inflation and capital gains taxes;
- To avoid risks which in the aggregate might reasonably impair the ability to achieve Objective #1; and
- In determining dividend policy, the Board shall attempt to increase dividends at rates that would theoretically under normal market conditions permit the underlying assets of the Company to grow at similar rates over the long term, thereby presumably providing generally comparable benefits to present and future recipients.
Notice that more than anything else, the dividends the fund provides year after year matter most.
Performance of ‘The List’
‘The List’ was down a bit again last week with a 1.5% YTD price return (capital). Dividend growth of ‘The List’ is 9.2% YTD, demonstrating the rise in income over last year.
The best performers last week on ‘The List’ were TFI International (TFII-N) up 2.3%; Magna International (MGA-N) up 1.2%; and Loblaws (L-T) up .9%.
Stantec Inc. (STN-T) was the worst performer last week, down -5.7%.
Recent News
A couple of news items from Magna International (MGA-N) last week.
LG Magna e-Powertrain, a joint venture (JV) between LG Electronics (LG) and Magna International Inc. (Magna), celebrated the groundbreaking of its new plant in Ramos Arizpe, Mexico. Scheduled for completion in 2023, the new facility will produce inverters, motors, and on-board chargers to support General Motors’ electric vehicle (EV) production. The 260,000 square foot plant will be LG Magna e-Powertrain’s first production base in North America and is expected to create around 400 new jobs.
Magna is expanding its ADAS and electrification footprint with the opening of a new plant in Kechnec, Slovakia. The brownfield facility will support two European automakers and new global entrant. Covering an area of approximately 22,000 square meters, the facility is expected to begin operations in the fourth quarter of this year with plans to hire 100 employees initially in time for start of production.
Magna (MGA-N) has been one of the worst performers on ‘The List’ in 2022. As we mentioned in an earlier post, we think most of the decline was due to its stretched valuation coming into the year. We will learn more in their earnings release this week.
An article published in the Globe and Mail Friday caught our attention.
The TSX just had its worst day of the year – and investors may not like what’s coming next
The article supports our earlier posts in that the author believes the aggressive interest rate hikes will slow the economy to a point that a recession is inevitable. Being patient and looking for opportunities when the market overreacts is critical at this stage for dividend growth investors. In the short term we enjoy the cash flow from our quality dividend growers.
There are four companies on ‘The List’ due to report earnings this week.
Canadian National Railway (CNR-T) will release its first quarter 2022 results on Tuesday April 26, 2002, after markets close.
Canadian Utilities (CU-T) will release its first quarter 2022 results on Wednesday April 27, 2002, after markets close.
TFI International (TFII-N) will release its first quarter 2022 results on Thursday April 28, 2002, after markets close.
Magna International (MGA-N) will release its first quarter 2022 results on Friday April 29, 2002, before markets open.
Dividend Increases
There were no companies on ‘The List’ that announced a dividend increase last week.
Earnings Releases
Metro Inc. reported their Q2 Fiscal 2022 earnings last week.
Metro (MRU-T)
“We are pleased with our results in the second quarter, achieved in a challenging operating environment marked by the Omicron variant and labour shortages throughout the supply chain. Our industry continues to experience higher than normal inflationary pressures and our teams remain focused on providing quality products at competitive prices to our customers. We reached another milestone this quarter with the successful start up of our fully automated frozen distribution center in Toronto. Finally, I am proud to say that for the second time in three years, the Jean Coutu banner has been designated by consumers as the most admired company in Quebec in the latest Leger Reputation survey. This is a reflection of the strength of the brand, the trust of consumers, and the quality of services provided by the pharmacist owners”, declared Eric La Flèche, President and Chief Executive Officer.
Highlights:
- Sales of $4,274.2 million, up 1.9%
- Food same-store sales up 0.8%, and up 11.5% for the first 8 weeks of the second quarter versus 2020 (pre-COVID period)
- Pharmacy same-store sales up 9.4%, and up 11.0% for the first 8 weeks of the second quarter versus 2020 (pre-COVID period)
- Net earnings of $198.1 million, up 5.3% and adjusted net earnings(1) of $204.7 million, up 5.1%
- Fully diluted net earnings per share of $0.82, up 9.3%, and adjusted fully diluted net earnings per share of $0.84, up 7.7%
- $8 million of gift cards paid to front-line employees, the same amount as in the second quarter last year
Outlook:
“At the start of the third quarter, most government measures to curb the pandemic had been lifted, but the ancillary impacts on our industry are ongoing. We continue to face higher than normal inflationary pressures and labour shortages which, if prolonged, could put pressure on margins. In the short term, we expect food sales to remain relatively stable versus last year while we expect continued growth in our pharmacy business although somewhat moderated versus the first half of the year. The labour conflict with our full-time distribution center employees in Toronto, which started on April 2, 2022, was resolved seven days later with the ratification of a new four-and-a-half-year collective agreement. Our third quarter results will be impacted by the direct costs of the strike and the impact of the new labour agreement, estimated at about $10 million pre-tax.”
Metro Inc. is one of our quality dividend growers (27 years) and a recent dividend increase of 10% tells us that the business is doing well. As dividend growth investors we pay more attention to the dividend than we do earnings.
Inflation pressures (shrinking margins and higher labour costs) will impact the profitability of the business in the short term. Metro does have pricing power however since it provides a necessity (groceries). The company should remain profitable until rising interest rates do their job.
With a higher-than-normal valuation we are on the sidelines right now with (MRU-T).
Below is a snapshot of ‘The List’ from last Friday’s close. For a sortable version of ‘The List’ please click on The List menu item.
‘The List’ is not meant to be a template for investors to copy exactly. Rather, its purpose is to provide investment ideas and a real-time illustration of dividend growth investing in action. It is not a ‘Buy List’ nor does it reflect the composition or returns of our Magic Pants Wealth-Builder (CDN) Portfolio. It is only a starting point for our analysis and discussion.
The List (2022)
Last updated by BM on April 22, 2022
*Note: The following graph is wide, you can scroll to the right on your device to see more of the data.
| SYMBOL | COMPANY | YLD | PRICE | YTD % | DIV | YTD % | STREAK |
|---|---|---|---|---|---|---|---|
| AQN-N | Algonquin Power & Utilities | 4.5% | $15.27 | 6.4% | $0.68 | 2.3% | 11 |
| ATD-T | Alimentation Couche-Tard Inc. | 0.8% | $56.68 | 8.8% | $0.44 | 18.1% | 12 |
| BCE-T | Bell Canada | 5.1% | $72.34 | 9.8% | $3.68 | 5.1% | 13 |
| BIP-N | Brookfield Infrastructure Partners | 3.4% | $64.23 | 5.1% | $2.16 | 5.9% | 14 |
| CCL-B-T | CCL Industries | 1.7% | $56.18 | -17.1% | $0.96 | 14.3% | 20 |
| CNR-T | Canadian National Railway | 1.9% | $156.86 | 1.3% | $2.93 | 19.1% | 26 |
| CTC-A-T | Canadian Tire | 2.8% | $182.83 | -0.2% | $5.20 | 10.6% | 11 |
| CU-T | Canadian Utilities Limited | 4.5% | $39.40 | 7.6% | $1.78 | 1.0% | 50 |
| DOL-T | Dollarama Inc. | 0.3% | $73.58 | 16.0% | $0.22 | 9.2% | 11 |
| EMA-T | Emera | 4.1% | $63.91 | 2.1% | $2.65 | 2.9% | 15 |
| ENB-T | Enbridge Inc. | 6.0% | $57.07 | 15.2% | $3.44 | 3.0% | 26 |
| ENGH-T | Enghouse Systems Limited | 2.0% | $35.42 | -22.8% | $0.72 | 16.3% | 15 |
| FNV-N | Franco Nevada | 0.8% | $158.54 | 16.5% | $1.28 | 10.3% | 14 |
| FTS-T | Fortis | 3.3% | $64.10 | 6.0% | $2.14 | 2.9% | 48 |
| IFC-T | Intact Financial | 2.2% | $179.67 | 9.7% | $4.00 | 17.6% | 17 |
| L-T | Loblaws | 1.3% | $116.48 | 13.4% | $1.46 | 6.6% | 10 |
| MGA-N | Magna | 2.9% | $61.46 | -24.7% | $1.80 | 4.7% | 12 |
| MRU-T | Metro | 1.6% | $69.82 | 4.1% | $1.10 | 12.2% | 27 |
| RY-T | Royal Bank of Canada | 3.6% | $132.76 | -3.0% | $4.80 | 11.1% | 11 |
| SJ-T | Stella-Jones Inc. | 2.1% | $37.54 | -7.7% | $0.80 | 11.1% | 17 |
| STN-T | Stantec Inc. | 1.2% | $60.12 | -14.3% | $0.71 | 6.8% | 10 |
| TD-T | TD Bank | 3.8% | $93.23 | -6.2% | $3.56 | 12.7% | 11 |
| TFII-N | TFI International | 1.3% | $83.08 | -25.0% | $1.08 | 12.5% | 11 |
| TIH-T | Toromont Industries | 1.3% | $119.54 | 5.1% | $1.52 | 15.2% | 32 |
| TRP-T | TC Energy Corp. | 4.9% | $72.50 | 21.4% | $3.57 | 4.4% | 21 |
| T-T | Telus | 3.9% | $33.32 | 12.0% | $1.31 | 4.4% | 18 |
| WCN-N | Waste Connections | 0.7% | $137.02 | 2.2% | $0.92 | 8.9% | 12 |
| Averages | 2.7% | 1.5% | 9.2% | 18 |
‘The List’ – Portfolio Review (April 2022)
Posted by BM on April 20, 2022
Each month we walk through our valuation process using a stock on ‘The List’ that meets our minimum screen of 6.5% EPS Yield. The company we will review today is TFI International (TFII-T).
A fair valuation is the second rule in our three-step process. Buying when our quality stocks are sensibly priced will help ensure our future investment returns meet our expectations. We rely heavily on the fundamental analyzer software tool (FASTgraphs) to help us understand the fundamentals of the stocks we invest in and then read the company’s website for investor presentations and recent earnings reports to learn more.
Intro:
TFI International Inc is a transportation and logistics company located in Canada. The company organizes itself into four segments: package and courier, less-than-truckload, truckload, and logistics. The package and courier segment picks up, transports, and delivers items across North America. The less-than-truckload segment transports smaller loads. The truckload segment transports goods by flatbed trucks, containers, or a more specialized service. The company provides general logistics services through the logistics segment. TFI International derives the majority of revenue domestically, followed by the United States.

Historical Graph:
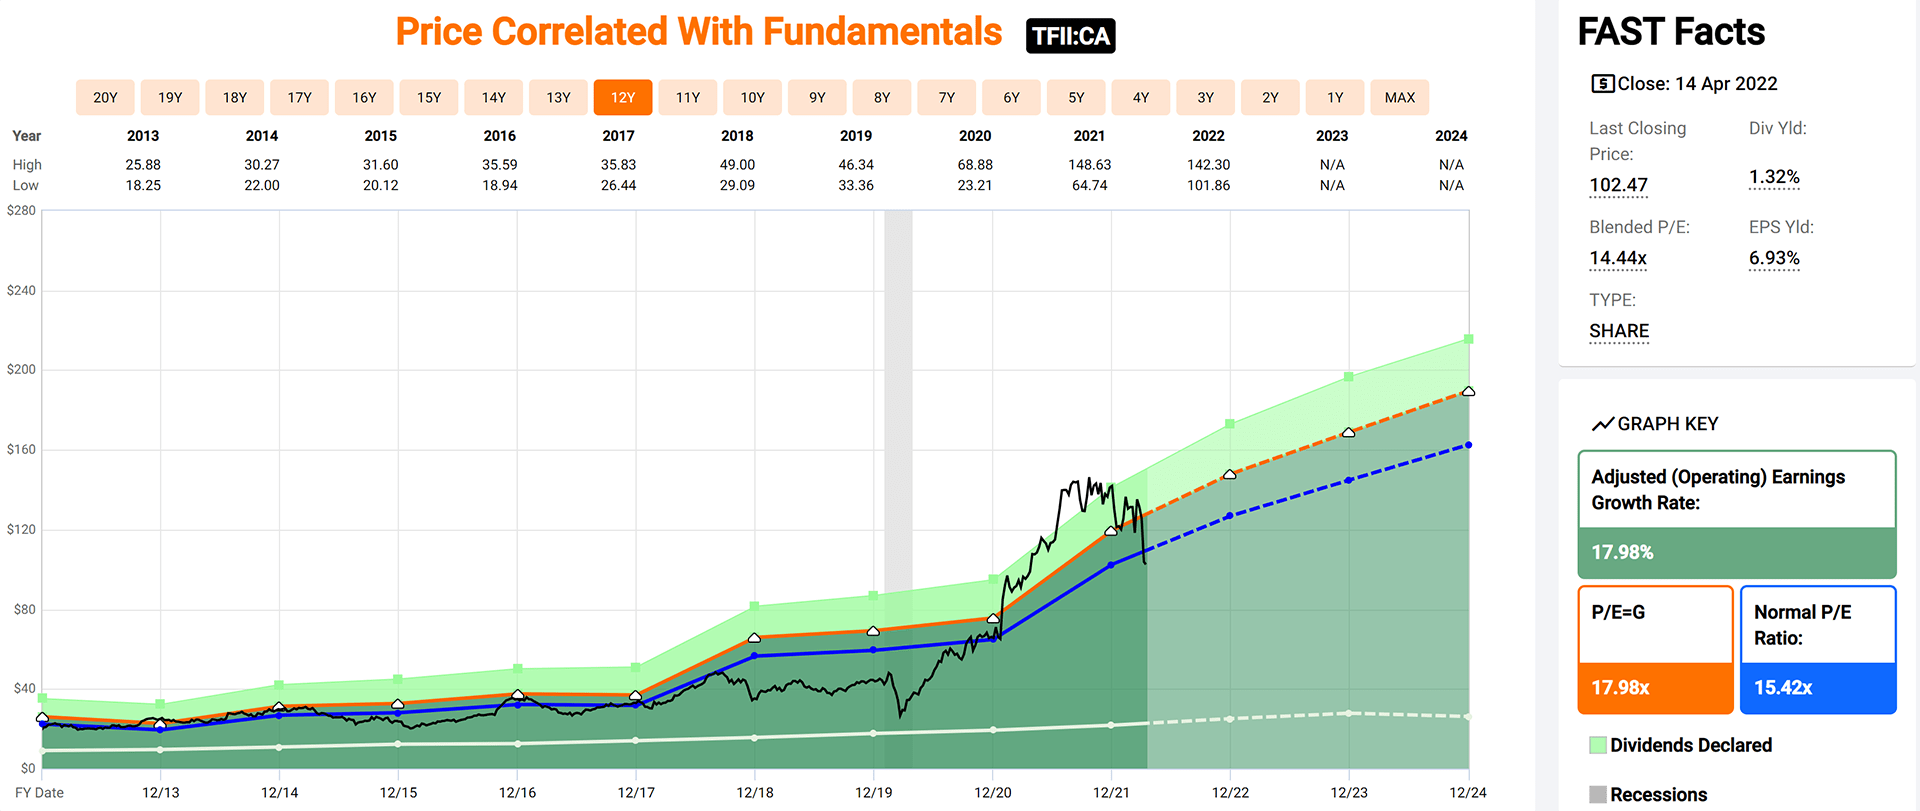
Comments:
TFI International has a narrow valuation corridor. As you can see from the Blue Line on the graph (Normal P/E) and the Black Line (Price), there seems to be a correlation between Price and P/E. A price below the average P/E line has historically been a good entry point for TFII-T.
The fundamentals show a company whose earnings have grown steadily over the last ten years at an annualized rate of ~17.98%.
Performance Graph:
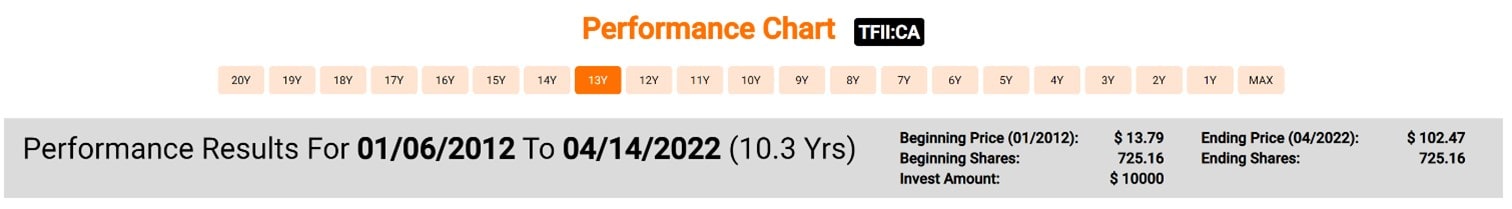
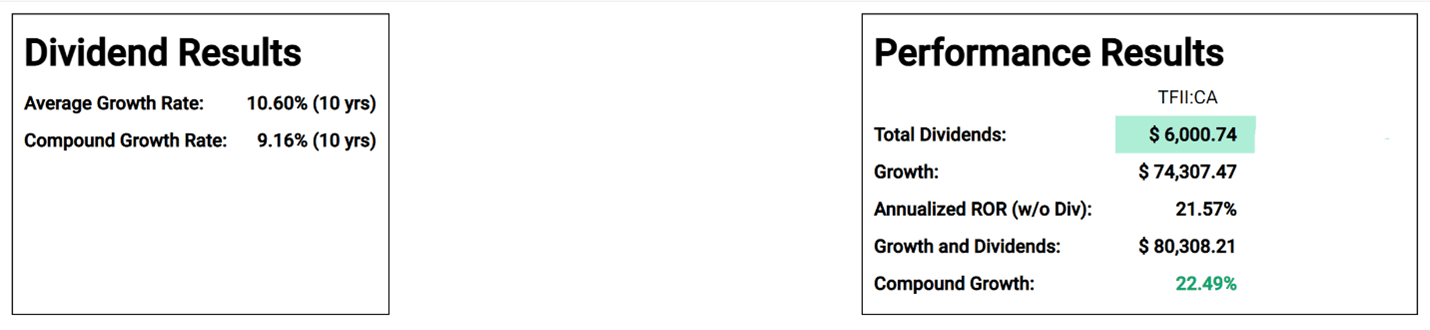
Comments:
TFI International has an annualized dividend growth rate of 9.16% over the last ten years. The company also has an annualized total return of 22.49% over that period. TFII-T recently announced a dividend increase of ~17.4% for 2022 which is almost double their ten-year growth rate.
Estimated Earnings:

Comments:
Using the “Normal Multiple’ estimating tool from FASTgraphs, we see a blended P/E average over the last five years of 14.91. Based on Analysts’ forecasts two years out, they are estimating an annualized return, based on today’s price, of 21.28% should TFII-T trade at its five-year average blended P/E.
Blended P/E is based upon a weighted average of the most recent actual value and the closest forecast value.
Of importance is that analysts have been revising their estimates upwards recently. Both the six and three months ago projections for 2022 and 2023 have been increasing. It means that analysts are bullish on TFI International in the short term.
Analyst Scorecard:
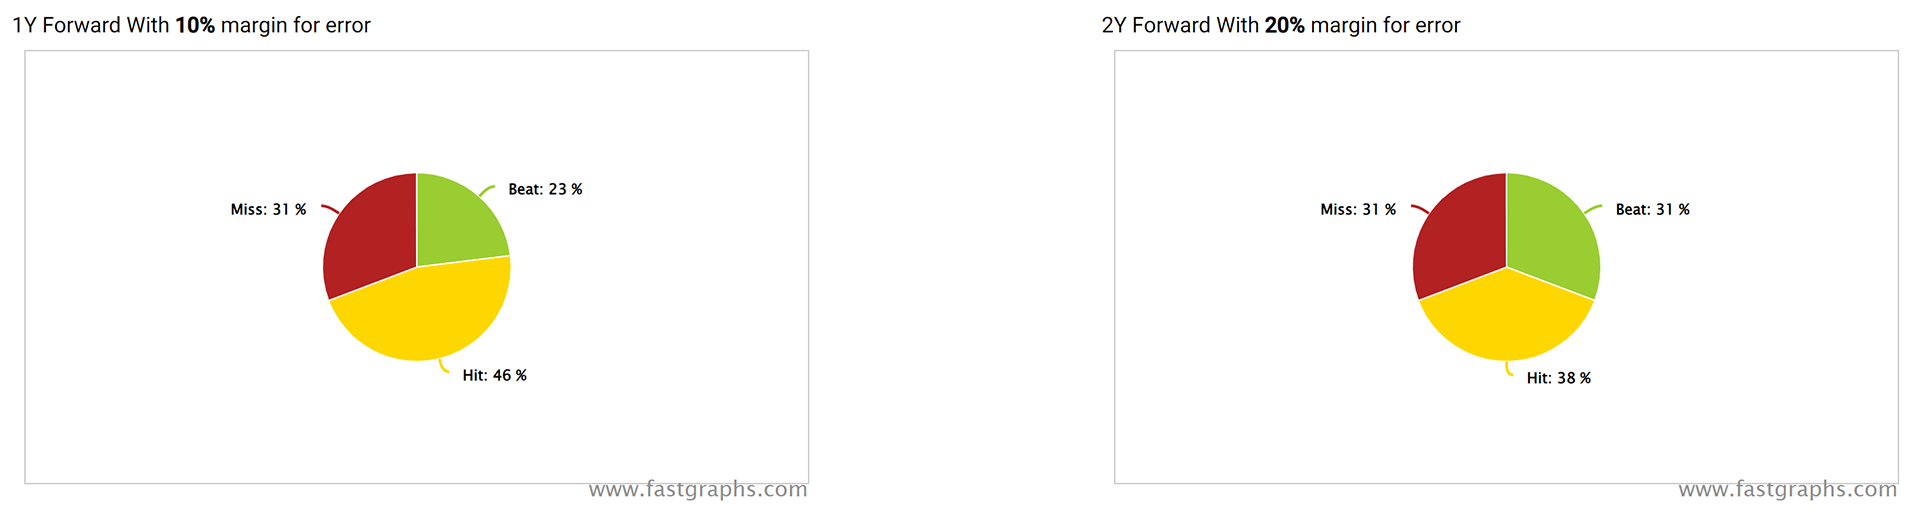
Comments:
Analyst performance on hitting estimates over the years are above average on one and two-year earnings projections. Analysts’ projections have hit or beat ~69% of the time on one-year estimates and ~69% on two-year estimates.
Recent Earnings Report-Full Year and Q4 2021:
“TFI International completed a highly successful year that featured our transformational acquisition of UPS Ground Freight, which is already helping to drive our robust financial results reported today. During the fourth quarter, our operating income grew 84% and our adjusted diluted EPS grew 60%,” said Alain Bédard, Chairman, President and Chief Executive Officer. “It is gratifying to see all our business segments delivering year-over-year growth in revenues and operating income, on the tremendous efforts of our thousands of talented team members. By focusing through the pandemic on our longstanding operating principles that emphasize efficiency, strong cash flow, and the strategic allocation of capital, we have entered the new year stronger than ever. I am therefore confident that regardless of operating conditions, our proven approach to the business and the synergies still to come from our rebranded TForce Freight position us well over the long term, for additional growth, superior customer service, and the continued creation of shareholder value.”
Q4 2021 Highlights:
- Total revenue of $2.14 billion was up 91% and, revenue before fuel surcharge of $1.89 billion was up 80% compared to the prior year period.
- Operating income grew 84% to $215.0 million from $117.1 million the prior year period, primarily driven by acquisitions, strong execution across the organization, increased quality of revenue, an asset-right approach, and cost efficiencies.
- Net income grew 67% to $144.1 million from $86.3 million the prior year period, and net income of $1.52 per diluted share was up relative to $0.91 the prior year period. Adjusted net income, a non-IFRS measure, was $148.6 million, or $1.57 per diluted
- share, as compared to $93.4 million, or $0.98 per diluted share, the prior year period.
- Total revenue grew for all segments relative to the prior year period with increases of 6% for Package and Courier, 509% for Less-Than-Truckload, 22% for Truckload and 35% for Logistics. Operating income was also higher across all segments in thefourth quarter in comparison to the prior-year.
Full Year 2021 Highlights:
- Total revenue was $7.22 billion for 2021 versus $3.78 billion in 2020. Revenue before fuel surcharge of $6.47 billion was up 86% compared to the prior year.
- Operating income totaled $889.2 million, or 14% of revenue before fuel surcharge, an increase of 113% compared to $416.6 million and 12% of revenue before fuel surcharge in the prior year. The increase is mainly attributable to the contributions from acquisitions, including a bargain purchase gain of $193.5 million, and despite a decrease in the Canadian Emergency Wage Subsidy of $40.0 million and an expense recognized on the mark-to-market of the DSUs of $22.9 million.
- Net income was $664.4 million, or $6.97 per diluted share, compared to $275.7 million, or $3.03 per diluted share a year earlier. Adjusted net income and Adjusted EPS, non-IFRS measures, were $498.3 million, or $5.23 per diluted share, compared to $299.8 million, or $3.30 per diluted share the prior year period.
- During 2021, total revenue grew 21% for Package and Courier, 378% for Less-Than-Truckload, 24% for Truckload and 76% for Logistics relative to the prior year. Operating income was up 38% for Package and Courier, 449% for Less-Than-Truckload, 12% for Truckload and 69% for Logistics.
Summary:
TFI International (TFII-T) was a known entity to me when I worked in the technology sector. One of our target markets was the trucking industry. TFI International was acquiring our customers and prospects at a rapid pace, and they seemed to integrate their acquisitions very well. As an investor, they first came on our radar in 2020 when we noticed that they were knocking on the door of becoming a DGI candidate and meeting our ten-year dividend growth streak criteria. We were fortunate to initiate a position at that time and ride the ecommerce wave over the next few years. During that time, TFI International continued to acquire and integrate, growing their earnings at an even faster rate. It has only been recently that the company’s fundamentals and stock price came back in alignment.
Coming off an amazing 2021 with an over 100% return on its stock price, it was only a matter of time until TFII-T’s P/E came back closer to its historical average. As of last Thursday, the company’s stock price was down ~-27% YTD bringing its P/E down below its ten-year average.
Trucking likes high growth and high inflation economies both of which are under pressure currently. Short term investors looking to initiate or add to their positions must be aware that both growth and inflation rates of change are decelerating which means there may be more bad news to come for this sector. Longer term investors are watching carefully. Based on the fundamentals alone, the company appears ‘sensibly priced’ today.
MP Market Review – April 14, 2022
Last updated by BM on April 18, 2022
“I like to see that the company was capable of increasing its dividends in the good times and the bad so that I’m more comfortable relying on that income in the future.” -Lowell Miller, The Single Best Investment: Creating Wealth with Dividend Growth
There are many ways to determine ‘quality’ when selecting a company for your portfolio, but we always start with the dividend growth streak. When we put together ‘The List’ each year, we only select companies that have ten years or more of consecutive dividend growth. Determining if these companies will continue to grow their dividends is paramount in what we do. The fact that eight of the companies on ‘The List’ now have dividend growth streaks of twenty plus years, means that a high percentage of them will.
In case you were wondering, those eight companies if purchased on Jan.1, 2012, had an average annual total return of 11.6% and an average annual dividend growth rate of 10.7% over the next ten years!
Performance of ‘The List’
‘The List’ down a bit last week with a 3.1% YTD price return (capital). Dividend growth of ‘The List’ is 9.2% YTD, demonstrating the rise in income over last year.
The best performers last week on ‘The List’ were Canadian National Railroad (CNR-T) up 2.6%; Stantec (STN-T) up 2.6%; and Stella Jones (SJ-T) up 2.6%.
Enghouse Systems (ENGH-T) was the worst performer last week, down -5.3%.
Recent News
Stantec (ST-N) had another good week.
US Army Corps of Engineers Alaska District has selected Stantec (STN-T) for a five-year, civil works contract.
Under the indefinite-delivery/indefinite-quantity multiple award task order contract of US$18 million ($22.7 million), Stantec will provide architecture and engineering design services for civil works projects throughout Alaska.
Stantec (STN-T) is new to ‘The List’ in 2022 and has been in the news lately with their acquisition of UK Consultancy Barton Whitmore and another new project award from Trillium Health Partners in Ontario. Proposed government infrastructure spending can only help the bottom line of this global engineering, architecture, and environmental consulting company.
In other news, inflation continues to be top of mind. In the U.S., inflation hit a rate of 8.5 per cent. That’s the highest in 40 years. In Canada, February’s inflation rate was 5.7 per cent.
How does inflation affect the average person? At an 8.5% inflation rate, a person who works for 12 months and is paid the same amount each month effectively works one month for free.
To control inflation, the Bank of Canada is quickly raising its benchmark rate. They announced a 0.5% rate increase this past week and expect to continue this aggressive approach for the rest of the year. Rate increases are the main tool in our central banks toolbox to help control inflation.
Companies with pricing power can pass along their higher costs due to inflation. Particularly if they sell necessities. Fortunately, some of our good dividend growers are in this category (think Dollarama, Loblaws and Metro to name a few). Companies that lack pricing power are likely to falter.
There is one company on ‘The List’ due to report earnings this week.
Metro (MRU-T) will release its second quarter fiscal 2022 results on Thursday April 21, 2022, before the market opens.
Dividend Increases
There were no companies on ‘The List’ that announced a dividend increase last week.
Earnings Releases
There were no companies on ‘The List’ that reported their earnings last week.
Below is a snapshot of ‘The List’ from last Friday’s close. For a sortable version of ‘The List’ please click on The List menu item.
‘The List’ is not meant to be a template for investors to copy exactly. Rather, its purpose is to provide investment ideas and a real-time illustration of dividend growth investing in action. It is not a ‘Buy List’ nor does it reflect the composition or returns of our Magic Pants Wealth-Builder (CDN) Portfolio. It is only a starting point for our analysis and discussion.
The List (2022)
Last updated by BM on April 14, 2022
*Note: The following graph is wide, you can scroll to the right on your device to see more of the data.
| SYMBOL | COMPANY | YLD | PRICE | YTD % | DIV | YTD % | STREAK |
|---|---|---|---|---|---|---|---|
| AQN-N | Algonquin Power & Utilities | 4.4% | $15.62 | 8.9% | $0.68 | 2.3% | 11 |
| ATD-T | Alimentation Couche-Tard Inc. | 0.8% | $56.42 | 8.3% | $0.44 | 18.1% | 12 |
| BCE-T | Bell Canada | 5.0% | $73.41 | 11.4% | $3.68 | 5.1% | 13 |
| BIP-N | Brookfield Infrastructure Partners | 3.2% | $66.73 | 9.2% | $2.16 | 5.9% | 14 |
| CCL-B-T | CCL Industries | 1.7% | $56.53 | -16.6% | $0.96 | 14.3% | 20 |
| CNR-T | Canadian National Railway | 1.8% | $160.43 | 3.6% | $2.93 | 19.1% | 26 |
| CTC-A-T | Canadian Tire | 2.8% | $185.50 | 1.3% | $5.20 | 10.6% | 11 |
| CU-T | Canadian Utilities Limited | 4.5% | $39.22 | 7.1% | $1.78 | 1.0% | 50 |
| DOL-T | Dollarama Inc. | 0.3% | $73.12 | 15.3% | $0.22 | 9.2% | 11 |
| EMA-T | Emera | 4.1% | $64.53 | 3.1% | $2.65 | 2.9% | 15 |
| ENB-T | Enbridge Inc. | 5.9% | $58.27 | 17.6% | $3.44 | 3.0% | 26 |
| ENGH-T | Enghouse Systems Limited | 1.9% | $37.29 | -18.7% | $0.72 | 16.3% | 15 |
| FNV-N | Franco Nevada | 0.8% | $167.06 | 22.7% | $1.28 | 10.3% | 14 |
| FTS-T | Fortis | 3.4% | $63.50 | 5.0% | $2.14 | 4.4% | 48 |
| IFC-T | Intact Financial | 2.2% | $182.49 | 11.5% | $4.00 | 17.6% | 17 |
| L-T | Loblaws | 1.3% | $115.46 | 12.4% | $1.46 | 6.6% | 10 |
| MGA-N | Magna | 3.0% | $60.73 | -25.6% | $1.80 | 4.7% | 12 |
| MRU-T | Metro | 1.5% | $71.93 | 7.3% | $1.10 | 10.0% | 27 |
| RY-T | Royal Bank of Canada | 3.5% | $136.86 | 0.0% | $4.80 | 11.1% | 11 |
| SJ-T | Stella-Jones Inc. | 2.1% | $38.60 | -5.1% | $0.80 | 11.1% | 17 |
| STN-T | Stantec Inc. | 1.1% | $63.73 | -9.2% | $0.71 | 6.8% | 10 |
| TD-T | TD Bank | 3.8% | $93.99 | -5.4% | $3.56 | 12.7% | 11 |
| TFII-N | TFI International | 1.3% | $81.23 | -26.7% | $1.08 | 12.5% | 11 |
| TIH-T | Toromont Industries | 1.3% | $121.39 | 6.8% | $1.52 | 15.2% | 32 |
| TRP-T | TC Energy Corp. | 4.9% | $72.45 | 21.3% | $3.57 | 4.4% | 21 |
| T-T | Telus | 3.9% | $33.71 | 13.3% | $1.31 | 4.4% | 18 |
| WCN-N | Waste Connections | 0.7% | $139.08 | 3.7% | $0.92 | 8.9% | 12 |
| Averages | 2.6% | 3.1% | 9.2% | 18 |
MP Market Review – April 8, 2022
Last updated by BM on April 11, 2022
“To the extent you know that your investments will be held for the very long term, you have automatically self-insured against the uncertainty of short-term market price fluctuations.” P.76 of Winning the Loser’s Game, Charles Ellis
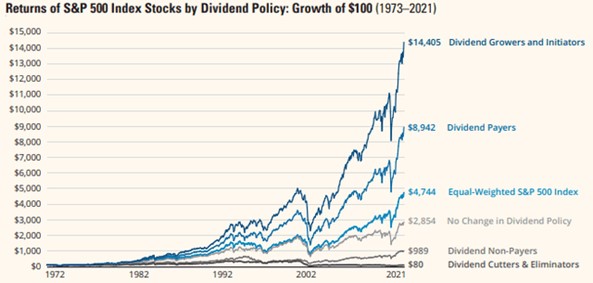
Excellent chart from Hartford Funds. Notice the outperformance between ‘Dividend Growers and Initiators’ and ‘Dividend Payers’. Not all dividend paying stocks are the same.
Investing can be difficult in the short-term. Knowing that our dividend growth strategy will pay off over time, as dividend growth aligns with price growth, helps us ignore the short-term price fluctuations of other philosophies. Plus, we can always rely on our inflation protecting dividend growth to provide us with the income we need while we wait.
Performance of ‘The List’
‘The List’ was up last week with a 4.0% YTD price return (capital). Dividend growth of ‘The List’ is 9.2% YTD, demonstrating the rise in income over last year.
Note: We are now reporting price and dividends for TFI International in US dollars and have replaced the Symbol with -N instead of -T for the Canadian price and dividend.
The best performers last week on ‘The List’ were Loblaws (L-T) up 6.2%; Bell Canada (BCE-T) up 4.3%; and Waste Connections (WCN-T) up 3.7%.
TFI International (TFII-T) was the worst performer last week, down -17.3%.
Recent News
CCL Industries (CCL-B-T) announced another acquisition this past week. That’s nineteen since January 1, 2020!
Geoffrey T. Martin, President and Chief Executive Officer of CCL Industries Inc., commented, “We are very excited to expand our highly successful operations in Brazil and welcome the Adelbras team to CCL. The new business will be headed by Luis Jocionis, Group Vice President CCL Industries South America.”
CCL Industries is another one of our good dividend growers (over 20 years) that has come under pressure recently. After record results reported last quarter, the stock has retreated. Our job as investors is to determine if the underlying fundamentals are changing or is it simply a case where the ‘speculative return’, we spoke of last week, is causing the concern.
Up next on the news front was the long anticipated federal budget released on Thursday. As expected, the Liberal/NDP government announced higher taxation and more spending initiatives. The one announcement we paid the closest attention to was the Bank Profit Surtax. Targeting Canada’s banks and life insurers with an additional tax is not something dividend investors applauded leading up to the budget but based on the market reaction (both sectors up Friday), it looks like the banks and insurers have a plan too. Much like we saw from Dollarama last week, who are combatting the cost of high inflation by raising their prices, the banks and insurers will likely recoup their losses by increasing their fees. Politicians seem to be stuck in this continuous loop of raising taxes on the wealthiest for optics sake, only to hurt the one’s they are trying to help.
There are no companies on ‘The List’ due to report earnings this week. Next up is Metro (MRU-T) on April 21.
Dividend Increases
There were no companies on ‘The List’ that announced a dividend increase last week.
Earnings Releases
There were no companies on ‘The List’ that reported their earnings last week.
Below is a snapshot of ‘The List’ from last Friday’s close. For a sortable version of ‘The List’ please click on The List menu item.
‘The List’ is not meant to be a template for investors to copy exactly. Rather, its purpose is to provide investment ideas and a real-time illustration of dividend growth investing in action. It is not a ‘Buy List’ nor does it reflect the composition or returns of our Magic Pants Wealth-Builder (CDN) Portfolio. It is only a starting point for our analysis and discussion.
The List (2022)
Last updated by BM on April 8, 2022
*Note: The following graph is wide, you can scroll to the right on your device to see more of the data.
| SYMBOL | COMPANY | YLD | PRICE | YTD % | DIV | YTD % | STREAK |
|---|---|---|---|---|---|---|---|
| AQN-N | Algonquin Power & Utilities | 4.3% | $15.86 | 10.5% | $0.68 | 2.3% | 11 |
| ATD-T | Alimentation Couche-Tard Inc. | 0.8% | $57.42 | 10.2% | $0.44 | 18.1% | 12 |
| BCE-T | Bell Canada | 5.0% | $73.22 | 11.1% | $3.68 | 5.1% | 13 |
| BIP-N | Brookfield Infrastructure Partners | 3.2% | $67.11 | 9.9% | $2.16 | 5.9% | 14 |
| CCL-B-T | CCL Industries | 1.7% | $57.14 | -15.7% | $0.96 | 14.3% | 20 |
| CNR-T | Canadian National Railway | 1.9% | $156.38 | 1.0% | $2.93 | 19.1% | 26 |
| CTC-A-T | Canadian Tire | 2.7% | $189.58 | 3.5% | $5.20 | 10.6% | 11 |
| CU-T | Canadian Utilities Limited | 4.5% | $39.34 | 7.5% | $1.78 | 1.0% | 50 |
| DOL-T | Dollarama Inc. | 0.3% | $73.75 | 16.3% | $0.22 | 9.2% | 11 |
| EMA-T | Emera | 4.1% | $64.53 | 3.1% | $2.65 | 2.9% | 15 |
| ENB-T | Enbridge Inc. | 5.9% | $58.71 | 18.5% | $3.44 | 3.0% | 26 |
| ENGH-T | Enghouse Systems Limited | 1.8% | $39.38 | -14.1% | $0.72 | 16.3% | 15 |
| FNV-N | Franco Nevada | 0.8% | $166.36 | 22.2% | $1.28 | 10.3% | 14 |
| FTS-T | Fortis | 3.3% | $64.59 | 6.8% | $2.14 | 4.4% | 48 |
| IFC-T | Intact Financial | 2.1% | $186.79 | 14.1% | $4.00 | 17.6% | 17 |
| L-T | Loblaws | 1.2% | $117.74 | 14.6% | $1.46 | 6.6% | 10 |
| MGA-N | Magna | 2.9% | $61.27 | -24.9% | $1.80 | 4.7% | 12 |
| MRU-T | Metro | 1.5% | $72.80 | 8.6% | $1.10 | 10.0% | 27 |
| RY-T | Royal Bank of Canada | 3.5% | $136.66 | -0.1% | $4.80 | 11.1% | 11 |
| SJ-T | Stella-Jones Inc. | 2.1% | $37.63 | -7.5% | $0.80 | 11.1% | 17 |
| STN-T | Stantec Inc. | 1.1% | $62.14 | -11.5% | $0.71 | 6.8% | 10 |
| TD-T | TD Bank | 3.7% | $96.73 | -2.6% | $3.56 | 12.7% | 11 |
| TFII-N | TFI International | 1.3% | $82.57 | -25.4% | $1.08 | 11.3% | 11 |
| TIH-T | Toromont Industries | 1.3% | $119.45 | 5.1% | $1.52 | 15.2% | 32 |
| TRP-T | TC Energy Corp. | 4.8% | $73.78 | 23.5% | $3.57 | 4.4% | 21 |
| T-T | Telus | 3.8% | $34.42 | 15.7% | $1.31 | 4.4% | 18 |
| WCN-N | Waste Connections | 0.6% | $144.89 | 8.1% | $0.92 | 8.9% | 12 |
| Averages | 2.6% | 4.0% | 9.2% | 18 |
MP Market Review – April 1, 2022
Last updated by BM on April 4, 2022
“The buying frenzy of the past 12 years has lured many market participants into speculative holdings that someday will seem like roach motels, easier to get into than out of.” – Seth Klarman
In an earlier post, ‘Estimating Future Returns’, we talked about speculation and how it can affect market returns in even the best companies.
The post is highlighted by Jack Bogle’s formula for estimating future market returns:
Future Market Returns = Dividend Yield + Earnings Growth +/- Change in P/E Ratio
Bogle calls the first two components, Yield + Growth, investment aspects of the investment return and the last component, +/- Change in P/E Ratio, the speculative return – what will people pay for a dollar’s worth of earnings?
A few stocks on ‘The List’ have experienced falling prices YTD, not because of the investment aspects of the formula but because they were priced to perfection (speculative return) coming into 2022. People paid a lot for their earnings. When the economy hits a bump in the road or financial results aren’t perfect…down goes the price. A falling price lowers the P/E, so now the speculative return component takes away from the investment return which can turn the future market returns negative in the short run. As dividend growth investors, the way we protect our capital is to be patient and only purchase our companies when they are sensibly priced. This gives our good dividend growers a higher probability of a positive Total Return going forward.
Here is an example of Bogle’s theory in action from a company on ‘The List’:
At one-point last year, Magna (MG-T) was trading at a P/E of 22. Understanding Bogle’s formula, we had a pretty good idea what our future return would look like if we added to our position at that point. Magna (MG-T) has a historical average P/E closer to 11. The investment aspects of Bogle’s formula (Yield + Growth) would not be enough to overcome a significant drop in P/E back to the historical average. We decided to wait until the speculative return came back down to earth. In the end, we were patient and when Magna (MG-T) finally touched its historical P/E in March of this year, we added to our position. At a P/E of 10 we determined the P/E was no longer speculative and the probability of further P/E reductions had decreased considerably. It was time to execute on our process.
Having a time-tested process to value our dividend growers helps increase the odds in our favour for a future positive return and keeps us out of Klarman’s ‘roach motels’.
Performance of ‘The List’
‘The List’ was up last week with a 3.1% YTD price return (capital). Dividend growth of ‘The List’ continues upward with a 9.4% YTD increase in our income over last year.
The best performers last week on ‘The List’ were Dollarama Inc. (DOL-T) up 7.2%; Brookfield Infrastructure Partners (BIP-T) up 5.0%; with both Emera (EMA-T) and Fortis (FTS-T) up 4.0%.
Canadian National Railway (CNR-T) was the worst performer last week, down -5.8%.
One company on ‘The List’, Dollarama Inc. (DOL-T), announced both a dividend increase and an earnings report for Q4 and Full Fiscal Year 2022 (January 2022 year-end).
Recent News
I watched a few videos and listened to some podcasts this week which all had their take on the current state of our economies both here in Canada and abroad. One thing that everyone can agree on is that inflation is no longer ‘transitory’, it is real, and it is here to stay for a while. We see rising prices at the gas pumps, in the grocery stores and now at our ‘dollar’ stores. Dollarama Inc. (DOL-T) announced that price tags up to $5 will begin appearing on its store shelves in the coming year. Until now, Dollarama’s highest price point was $4. I can still remember everything at Dollarama Inc. (DOL-T) being a dollar (as the name implies) only a few years ago.
A good book I am now reading, The Price of Tomorrow by Jeff Booth, has an interesting take on inflation. In the book, Booth equates inflation to ‘theft’. He talks about how inflation is only accelerating the divide between the haves and the have-nots. Owning real assets (quality businesses) instead of holding cash and fixed income is one of the better ways to keep pace with inflation.
One of the things that first attracted us to dividend growth investing was its built-in inflation protected cash flow (growing dividend). Owning companies like Dollarama Inc. (DOL-T) who also have pricing power helps as well.
There are no companies on ‘The List’ due to report earnings this week.
Dividend Increases
There was one company on ‘The List’ that announced a dividend increase this week.
Dollarama Inc. (DOL-T) on Wednesday said it increased its 2022 quarterly dividend from $0.0503 to $.0553 per share, payable May 6, 2022, to shareholders of record on April 15, 2022.
This represents a dividend increase of 10.0% and the 12th consecutive year in which the company has increased its dividend.
Earnings Releases
There was only one company on ‘The List’ to report as we now move into the next quarter (Q1 2022) of earnings releases in late April and May. Not all companies on the list have a fiscal year-end of December 31. Dollarama Inc. (DOL-T) is one such company with a year end of January 31 which moves them into Fiscal 2023 earnings next.
Dollarama Inc. (DOL-T)
“Dollarama delivered strong operational and financial results in Fiscal 2022, including EPS growth of 20%, all this while navigating the ebb and flow of the pandemic’s impacts on retailers and consumer shopping patterns and in the context of supply chain and inflationary pressures. This remarkable performance speaks to the resilience of our business model and the relevance of our value promise to Canadian consumers, a promise we are committed to fulfilling in what remains a complex and volatile environment as we enter Fiscal 2023,” said Neil Rossy, President and CEO.
Fiscal 2022 Fourth Quarter Results Highlights Compared to Fiscal 2021 Fourth Quarter Results
- Sales increased by 11.0% to $1,224.9 million
- Comparable store sales grew 5.7%
- Gross margin was 45.2% of sales, compared to 45.5% of sales
- EBITDA increased by 20.4% to $393.7 million, or 32.1% of sales, compared to 29.6% of sales
- Operating income increased by 23.3% to $315.7 million, or 25.8% of sales, compared to 23.2% of sales
- Incremental direct costs related to COVID-19 measures totaled $4.4 million, compared to $23.8 million
- Diluted net earnings per share increased by 32.1% to $0.74, compared to $0.56
- 24 net new stores were opened, compared to 23 net new stores
- 5,090,587 common shares were repurchased for cancellation for $318.5 million
Fiscal 2022 Results Highlights Compared to Fiscal 2021 Results
- Sales increased by 7.6% to $4,330.8 million
- Comparable store sales grew 1.7%
- Gross margin was 43.9% of sales, compared to 43.8% of sales
- EBITDA increased by 13.4% to $1,282.6 million, or 29.6% of sales, compared to 28.1% of sales
- Operating income increased by 14.4% to $984.6 million, or 22.7% of sales, compared to 21.4% of sales
- Incremental direct costs related to COVID-19 measures totaled $35.5 million, compared to $84.0 million, of which $2.9 million relates to cost of sales and $81.1 million to SG&A
- Diluted net earnings per share increased by 20.4% to $2.18, compared to $1.81
- 65 net new stores were opened, same as prior year, bringing total store count to 1,421
- 18,176,760 common shares were repurchased for cancellation for $1,059.9 million
We liked Dollarama’s report. Twenty percent earnings growth YoY, a 10% dividend increase and plans to add more stores sends a lot of positive messages to investors. It is no wonder it was the top performer on ‘The List’ this past week. At a P/E of 32 (21% above its average) however, we will wait for a better entry point.
Below is a snapshot of ‘The List’ from last Friday’s close. For a sortable version of ‘The List’ please click on The List menu item.
‘The List’ is not meant to be a template for investors to copy exactly. Rather, its purpose is to provide investment ideas and a real-time illustration of dividend growth investing in action. It is not a ‘Buy List’ nor does it reflect the composition or returns of our Magic Pants Wealth-Builder CDN Portfolio. It is only a starting point for our analysis and discussion.
The List (2022)
Last updated by BM on April 1, 2022
*Note: The following graph is wide, you can scroll to the right on your device to see more of the data.
| SYMBOL | COMPANY | YLD | PRICE | YTD % | DIV | YTD % | STREAK |
|---|---|---|---|---|---|---|---|
| AQN-N | Algonquin Power & Utilities | 4.4% | $15.59 | 8.6% | $0.68 | 2.3% | 11 |
| ATD-T | Alimentation Couche-Tard Inc. | 0.8% | $55.56 | 6.6% | $0.44 | 18.1% | 12 |
| BCE-T | Bell Canada | 5.2% | $70.23 | 6.6% | $3.68 | 5.1% | 13 |
| BIP-N | Brookfield Infrastructure Partners | 3.2% | $67.26 | 10.1% | $2.16 | 5.9% | 14 |
| CCL-B-T | CCL Industries | 1.7% | $56.55 | -16.6% | $0.96 | 14.3% | 20 |
| CNR-T | Canadian National Railway | 1.8% | $159.94 | 3.3% | $2.93 | 19.1% | 26 |
| CTC-A-T | Canadian Tire | 2.8% | $185.80 | 1.4% | $5.20 | 10.6% | 11 |
| CU-T | Canadian Utilities Limited | 4.6% | $38.23 | 4.4% | $1.78 | 1.0% | 50 |
| DOL-T | Dollarama Inc. | 0.3% | $72.42 | 14.2% | $0.22 | 9.2% | 11 |
| EMA-T | Emera | 4.2% | $62.92 | 0.5% | $2.65 | 2.9% | 15 |
| ENB-T | Enbridge Inc. | 5.9% | $58.08 | 17.2% | $3.44 | 3.0% | 26 |
| ENGH-T | Enghouse Systems Limited | 1.8% | $39.99 | -12.8% | $0.72 | 16.3% | 15 |
| FNV-N | Franco Nevada | 0.8% | $163.67 | 20.3% | $1.28 | 10.3% | 14 |
| FTS-T | Fortis | 3.4% | $62.73 | 3.7% | $2.14 | 4.4% | 48 |
| IFC-T | Intact Financial | 2.2% | $184.67 | 12.8% | $4.00 | 17.6% | 17 |
| L-T | Loblaws | 1.3% | $110.88 | 7.9% | $1.46 | 6.6% | 10 |
| MGA-N | Magna | 2.8% | $64.33 | -21.2% | $1.80 | 4.7% | 12 |
| MRU-T | Metro | 1.5% | $71.57 | 6.8% | $1.10 | 10.0% | 27 |
| RY-T | Royal Bank of Canada | 3.5% | $137.32 | 0.4% | $4.80 | 11.1% | 11 |
| SJ-T | Stella-Jones Inc. | 2.2% | $37.00 | -9.0% | $0.80 | 11.1% | 17 |
| STN-T | Stantec Inc. | 1.1% | $62.11 | -11.5% | $0.71 | 6.8% | 10 |
| TD-T | TD Bank | 3.6% | $99.47 | 0.1% | $3.56 | 12.7% | 11 |
| TFII-T | TFI International | 1.1% | $125.60 | -10.4% | $1.36 | 17.4% | 11 |
| TIH-T | Toromont Industries | 1.3% | $118.53 | 4.3% | $1.52 | 15.2% | 32 |
| TRP-T | TC Energy Corp. | 5.0% | $71.46 | 19.6% | $3.57 | 4.4% | 21 |
| T-T | Telus | 3.9% | $33.31 | 11.9% | $1.31 | 4.4% | 18 |
| WCN-N | Waste Connections | 0.7% | $139.73 | 4.2% | $0.92 | 8.9% | 12 |
| Averages | 2.6% | 3.1% | 9.4% | 18 |

I’ll coach you on how to identify high-quality individual dividend growth stocks when they are sensibly priced, and hold them for the growing income.