“You have a pair of pants. In the left pocket, you have $100. You take $1 out of the left pocket and put in the right pocket. You now have $101. There is no diminution of dollars in your left pocket. That is one magic pair of pants.”

MP Market Review – May 26, 2023

Last updated by BM on May 29, 2023

Summary 

  • This is a weekly installment of our MP Market Review series, which provides updates on the financial markets and Canadian dividend growth companies we monitor on ‘The List’.
  • Last week, ‘The List’ was down with a YTD price return of +4.8% (capital). Dividend growth remained the same and is now at +8.4% YTD, highlighting growth in income over the past year.
  • Last week, one dividend increase from companies on ‘The List’.
  • Last week, two earnings reports from companies on ‘The List’.
  • No companies on ‘The List’ are due to report earnings this week.
  • If you’re interested in creating your own dividend growth income portfolio, consider subscribing to our premium service, which grants you access to the MP Wealth-Builder Model Portfolio (CDN) and exclusive subscriber-only content.  Learn More         

Introduction

“You have a pair of pants. In the left pocket, you have $100. You take $1 out of the left pocket and put it in the right pocket. You now have $101. There is no diminution of dollars in your left pocket. That is one magic pair of pants.”

This ‘magic pants’ analogy was from a Seeking Alpha article on dividend investing I read about a decade ago and was one of the catalysts for me to take a closer look at this type of investing and see if it truly was magical. 

After conducting additional research, I have shifted towards utilizing a dividend growth investing (DGI) strategy as my primary investment approach. While I maintain portfolios consisting of high-quality dividend growers from both the United States and Canada, I have opted to concentrate on Canadian (CDN) dividend growth companies in this blog. This is due to several reasons, including a smaller pool of DGI companies to track, a lack of coverage for the DGI strategy by the North American investment media, and a tendency for those who do cover DGI to narrowly focus on only a handful of sectors (Energy and Financials).

While ‘The List’ is not a portfolio in itself, it serves as an excellent initial reference for individuals seeking to diversify their investments and attain higher returns in the Canadian stock market. Through our blog, we provide weekly updates on ‘The List’ and offer valuable perspectives and real-life examples of the dividend growth investing strategy in practice. This helps readers gain a deeper understanding of how to implement and benefit from this investment approach.

DGI Thoughts

“The idea of excessive diversification is madness. Wide diversification, which necessarily includes investments in mediocre businesses, only guarantees ordinary returns.”

 – Charlie Munger

“Diversification does not guarantee against loss, only against losing everything all at once”

– Peter L. Bernstein’s Against the Gods: The Remarkable Story of Risk

Over the weekend, we read another article on diversifying your portfolio.

Diversifying your portfolio – how much is too much? (Globe & Mail)

https://www.theglobeandmail.com/investing/markets/inside-the-market/article-gordon-pape-diversifying-your-portfolio-how-much-is-too-much/

The author comments on what a lot of people do, which is over-diversify (diworsification). Depending on your wealth advisor, the recommendations can cover a wide range of options which they believe manage your “risk” efficiently. After all, who can predict what the stock market will do?

Modern Portfolio Theory/Efficient Market Hypothesis is what most wealth managers believe in today, which requires a lot of companies in your portfolio to help manage “risk”. It’s important to note that this approach doesn’t eliminate “risk”; instead, it only ensures “ordinary returns”.

For years, proponents of dividend growth investing have taken advantage of this theory, advocating for a focused portfolio comprised of select high-quality stocks that offer consistent dividend growth. Instead of emphasizing diversification, they view “risk” as the price they pay for their quality dividend growers.

The returns in the stock market are not haphazard; we understand that dividend growth plays a pivotal role in driving price appreciation. Surprisingly, many wealth managers disregard dividends entirely and fail to recognize their significant impact on stock prices.

For those new to do-it-yourself investing, you have a choice to make.

If you have not yet joined as a subscriber of the blog to receive DGI Alerts on the activity and content related to our model portfolio, it’s not too late. Click Here. 

Recent News 

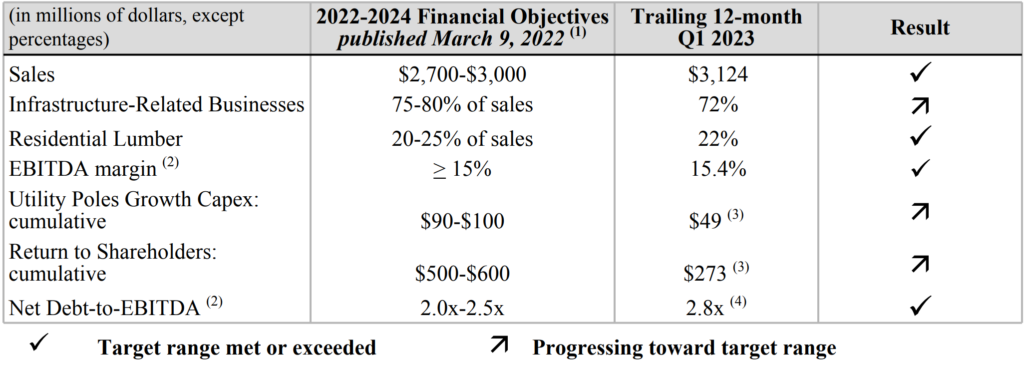
Stella-Jones updates its financial objectives (Stella-Jones Investor Presentation)

https://magicpants.ca/wp-content/uploads/2023/05/Stella-Jones-Investor-Day-Press-Release_May-2023.pdf

“Following a record year in 2022, coupled with our outstanding start to 2023, we are excited to share updated financial objectives that reflect Stella-Jones’ performance and growth potential,” said Eric Vachon, President and Chief Executive Officer of Stella-Jones. “In light of our favourable position to meet or exceed our original financial targets, we are raising our 2025 sales target to almost 20% above 2022 sales and the 2023–2025 EBITDA margin goal to 16%, primarily driven by the accelerating demand for our higher margin utility poles business.”

When companies increase their outlook by 20% it always gets our attention. Stella Jones is one of those ‘under the radar’ types of dividend growth stocks that we follow on ‘The List’. We had an opportunity last year to establish a position for our model portfolio but missed out. With our focus on accumulating ‘Core’ category stocks in our first year, we may have let a good ‘Non-Core’ company get away (for now).

Stella-Jones (SJ-T) has an established track record of generating consistent and strong cashflows which provides flexibility to deliver significant value to shareholders. With a dividend increase earlier this year, their dividend streak is now at 19 years and counting.

‘Slow and steady’ wins the race for Canadian banks, Veritas report argues (Globe & Mail)

https://www.theglobeandmail.com/investing/markets/inside-the-market/article-bank-earnings-veritas-report/

“In their report, entitled “The Tortoise and the Hare,” they argue that “slow and steady” wins the race in Canadian banking. They conclude that the banks that generated the best risk-adjusted returns over the past decade were the “tortoises” that focused on Canadian banking rather than the “hares” that raced out to pursue international diversification.”

Their logic is based upon the safety of the Canadian banking system compared to international banks.

“Since 1840, Canada has not experienced a bank crisis,” it notes. Over the same period, the United States has suffered 12 major banking crises. Meanwhile, Latin America has ricocheted among “bouts of political uncertainty, financial crisis, bank failures and currency devaluation.”

To receive breaking news about companies on ‘The List’ follow us on Twitter @MagicPants_DGI.

The List (2023)

Last updated by BM on May 26, 2023

The Magic Pants List contains 27 Canadian dividend growth stocks. ‘The List’ contains Canadian companies that have raised their dividend yearly for at least the last ten years and have a market cap of over a billion dollars. Below is each stock’s symbol, name, current yield, current price, price return year-to-date, current dividend, dividend growth year-to-date and current dividend growth streak. Companies on ‘The List’ are added or subtracted once a year, on January 1. After that, ‘The List’ is set for the next twelve months. Prices and dividends are updated weekly.

SYMBOL COMPANY YLD PRICE YTD % DIV YTD % STREAK
AQN-N Algonquin Power & Utilities 6.1% $8.30 23.3% $0.51 -29.0% 12
ATD-T Alimentation Couche-Tard Inc. 0.8% $67.39 12.1% $0.56 19.1% 13
BCE-T Bell Canada 6.2% $61.87 2.7% $3.82 5.0% 14
BIP-N Brookfield Infrastructure Partners 4.4% $36.28 5.2% $1.44 6.3% 15
CCL-B-T CCL Industries 1.6% $65.61 13.0% $1.06 10.4% 21
CNR-T Canadian National Railway 2.0% $155.16 -4.7% $3.16 7.8% 27
CTC-A-T Canadian Tire 4.1% $168.90 15.2% $6.90 17.9% 12
CU-T Canadian Utilities Limited 4.9% $36.32 -1.7% $1.79 1.0% 51
DOL-T Dollarama Inc. 0.3% $83.74 4.9% $0.27 23.8% 12
EMA-T Emera 4.9% $56.38 7.1% $2.76 3.0% 16
ENB-T Enbridge Inc. 7.3% $48.85 -8.4% $3.55 3.2% 27
ENGH-T Enghouse Systems Limited 2.2% $38.42 7.6% $0.85 18.2% 16
FNV-N Franco Nevada 0.9% $145.72 5.5% $1.36 6.3% 15
FTS-T Fortis 3.9% $57.46 3.8% $2.26 4.1% 49
IFC-T Intact Financial 2.2% $202.59 3.5% $4.40 10.0% 18
L-T Loblaws 1.4% $120.85 0.4% $1.74 10.3% 11
MGA-N Magna 3.6% $51.55 -10.4% $1.84 2.2% 13
MRU-T Metro 1.6% $73.51 -2.6% $1.21 10.0% 28
RY-T Royal Bank of Canada 4.3% $123.08 -3.9% $5.34 7.7% 12
SJ-T Stella-Jones Inc. 1.5% $60.08 21.2% $0.92 15.0% 18
STN-T Stantec Inc. 1.0% $79.03 21.0% $0.77 8.5% 11
TD-T TD Bank 4.9% $78.26 -10.7% $3.84 7.9% 12
TFII-N TFI International 1.3% $108.71 8.6% $1.40 29.6% 12
TIH-T Toromont Industries 1.6% $107.15 9.7% $1.68 10.5% 33
TRP-T TC Energy Corp. 6.8% $54.11 1.5% $3.69 3.4% 22
T-T Telus 5.4% $26.34 0.1% $1.43 7.3% 19
WCN-N Waste Connections 0.7% $138.45 5.1% $1.02 7.4% 13
Averages 3.2% 4.8% 8.4% 19

Six Canadian stocks on ‘The List’ declare earnings and dividends in US dollars and are inter-listed on a US exchange in US dollars. The simplest way to display dividend and price metrics for these stocks is to show their US exchange symbols along with their US dividends and price. The stocks I am referring to have a -N at the end of their symbols. You can still buy their Canadian counterparts (-T), but your dividends will be converted into CDN dollars and will fluctuate based on the exchange rate.

Note: When the dividend and share price currency match, the calculation is straightforward. But it’s not so simple when the dividend is declared in one currency, and the share price is quoted in another. Dividing the former by the latter would produce a meaningless result because it’s a case of apples and oranges. To calculate the yield properly, you must express the dividend and share price in the same currency.

Performance of ‘The List’

Feel free to click on this link, ‘The List’ for a sortable version from our website.

Last week, ‘The List’ was down with a YTD price return of +4.8% (capital). Dividend growth remained the same and is now at +8.4% YTD, highlighting growth in income over the past year.

The best performers last week on ‘The List’ were Enghouse Systems Limited (ENGH-T), up +2.56%; Alimentation Couche-Tard Inc. (ATD-T), up +2.09%; and TFI International (TFII-N), down -0.28%.

CCL Industries (CCL-B-T) was the worst performer last week, down -7.17%.


Dividend Increases

“The growth of dividend paying ability is of significance in the determination of a stock’s quality, or general safety…”

– Arnold Bernhard (the founder of Value Line)

“As a dividend increase is a positive sign of a company’s financial strength, the safest purchase, after research, is a stock with a recent dividend increase.”

– Tom Connolly (the founder of dividendgrowth.ca)

Last week, one dividend increase from companies on ‘The List’.

Royal Bank (RY-T) on Thursday said it increased its 2023 quarterly dividend for the second time this year, from $1.32 to $1.35 per share, payable August 24, 2023, to shareholders of record on July 26, 2023.

This represents a dividend increase of +2.27%, marking the 13th straight year of dividend growth for this quality financial institution.


Earnings Releases

Benjamin Graham once remarked that earnings are the principal factor driving stock prices.

Each quarter we will provide readers with weekly earnings updates of stocks on ‘The List’ during the calendar earnings season. 

The updated earnings calendar can be found here.

Earnings growth and dividend growth tend to go hand in hand, so this information can tell us a lot about the future dividend growth of our quality companies. Monitoring our dividend growers periodically is part of the process, and reading the quarterly earnings releases is a good place to start.

No earnings reports from companies on ‘The List’ this week 

Last week, two earnings reports from companies on ‘The List’.

Canada’s big Banks reported their fiscal Q2 earnings last week kicking off the next earnings season.

Royal Bank of Canada (RY-T) released its second-quarter fiscal 2023 results on Thursday, May 25, 2023, before markets opened.

“As our second quarter results demonstrate, RBC will never compromise on doing right by our clients and delivering sustainable, long-term value to them, our communities and shareholders. Our focused growth strategy, prudent risk and capital management, and diversified business mix exemplify our strength and stability amidst a complex macro environment. As we continue to realize the benefits of our strategic investments in technology and our incredible talent, we are confident in our ability to slow expense growth and drive greater efficiencies while supporting our clients’ needs.

– Dave McKay, RBC President and Chief Executive Officer

Highlights:

  • Adjusted net income and adjusted EPS of $3.8 billion and $2.65 were down 13% and 11% from the prior year, respectively.
  • Results this quarter reflected higher provisions for credit losses, with a PCL on loans ratio of 30 bps, mainly attributable to provisions taken on performing loans in the current quarter, largely driven by unfavourable changes in our credit quality and macroeconomic outlook, as compared to releases in the prior year which reflected reduced uncertainty from the COVID-19 pandemic. The current quarter also reflected higher provisions on impaired loans.
  • Pre-provision, pre-tax earnings of $5 billion were up $54 million or 1% from a year ago, mainly reflecting higher net interest income driven by higher interest rates and strong loan growth in Canadian Banking and Wealth Management. Higher Corporate & Investment Banking revenue in Capital Markets also contributed to the increase. These factors were partially offset by higher expenses, mainly due to higher staff-related costs, including from headcount growth, as well as stock-based compensation. Higher professional fees (including technology investments) and higher discretionary costs to support strong client-driven growth also contributed to higher expenses.
  • Our balance sheet strength coupled with a robust capital position, with a CET1 ratio of 13.7%, supported solid volume growth and $1.8 billion in common share dividends. We have a strong average LCR of 135%. We also continue to operate with a prudent ACL ratio, which included $173 million of provisions taken on performing loans in the current quarter.

Outlook:

Unemployment rates remain at historically low levels in Canada, the U.S., the Euro area and the U.K. However, the number of job openings in Canada and the U.S. has begun to slow and wage growth has shown signs of moderating. Inflation pressures have also eased across most advanced global economies. Household expenditure overall has been supported by resilient spending on services. However, the lagged impacts of central bank interest rate increases over the last year are expected to slow inflation and consumer demand further. The risk to financial markets resulting from raising interest rates aggressively has heightened after stresses emerged in the U.S. regional banking sector. Geopolitical uncertainty remains high with the ongoing war in Ukraine. With economic growth expected to slow, and mild recessions expected in the U.S. and Canada in the calendar year ahead, we expect most advanced economy central banks are currently at or approaching the end of their current cycle of rate increases.

Canada

Canadian GDP is expected to have risen 2.5% in the first calendar quarter of 2023, following no growth in the final calendar quarter of 2022. Consumer spending continued to rise in the first calendar quarter of 2023 but is expected to slow as the lagged impact of Bank of Canada (BoC) interest rate increases over the last calendar year gradually flow through to household borrowing costs. We continue to expect a mild recession with modest GDP declines over the second and third calendar quarters of 2023. Inflation pressures have continued to moderate after peaking in the summer of 2022. The year over-year rate of growth in the consumer price index (CPI) slowed to 4.4% in April 2023 from 6.3% in December 2022, partly reflecting easing global supply chain pressures and lower energy prices. Commodity prices have reversed initial increases following the start of the conflict between Russia and Ukraine in 2022. The breadth of price pressures has narrowed, with a smaller share of products and services impacted by abnormally high price growth. The unemployment rate was 5.0% in April 2023, holding for a fifth straight month at just above the multi-decade low rate of 4.9% in the summer of 2022. Labour shortages are still widespread but less intense according to the BoC’s 2023 Business Outlook Survey conducted for the first calendar quarter. The BoC announced a conditional pause in interest rate increases in January 2023. The overnight rate is expected to remain at the current 4.5% level through calendar 2023.

U.S.

U.S. GDP grew by 1.1% in the first calendar quarter of 2023 following a 2.6% increase in the final calendar quarter of 2022. While household spending has so far been resilient, Federal Reserve (Fed) interest rate increases over the last calendar year and in calendar 2023 continue to raise debt payments with a lag and reduce household purchasing power. We expect a mild recession with GDP declining over the second and third calendar quarters of 2023. The unemployment rate remains very low at 3.4% as of April 2023, however the number of job openings is declining as labour demand begins to slow. Year-over-year growth in the CPI slowed to 4.9% in April 2023 from 6.5% in December 2022, largely as a result of easing global supply chain disruptions and lower commodity prices. The breadth of inflation pressures has been narrowing across products but is still wide, and price growth for domestically produced services has been slower to ease. Inflation is expected to slow further as consumer demand declines, and concerns among monetary policy setters on the risks to financial markets from raising interest rates aggressively have increased after stresses emerged in the U.S. regional banking sector. We expect the Fed will pause interest rate increases after the last 25 basis point increase to the federal funds target range in May.

Europe

Euro area GDP in the first calendar quarter of 2023 grew modestly by 0.1% following no growth in the final calendar quarter of 2022. GDP growth is expected to remain slow over the remainder of the calendar year. Unemployment rates remain very low across countries in the Euro area but are expected to rise modestly through the rest of calendar 2023. Year-over-year consumer price growth has slowed, due largely to lower global commodity prices. Despite rising concerns surrounding financial sector stability, we anticipate the European Central Bank will raise the deposit rate to 3.75% by the end of calendar 2023. U.K. GDP increased by 0.1% in the first calendar quarter of 2023 following a 0.1% increase in the final calendar quarter of 2022. Recent inflation trends have been stronger than previously expected, with year-over-year growth in the CPI at 10.1% in March 2023. The Bank of England increased the Bank Rate to 4.5% in May 2023. We expect no further interest rate increases before the end of calendar 2023.

Source: (RY-T) Q2-2023 Report to Shareholders


TD Bank (TD-T) released its second-quarter fiscal 2023 results on Thursday, May 25, 2023, before markets opened.

“TD’s retail businesses in both Canada and the United States continued to show strong revenue and earnings growth this quarter, with robust customer originations and loan volumes. Investments in differentiated wealth and insurance products and the close of the Cowen acquisition expanded our offerings and strengthened the competitive advantages of these businesses.”

– President and Chief Executive Officer, Bharat Masrani

Highlights:

SECOND QUARTER FINANCIAL HIGHLIGHTS, compared with the second quarter last year:

  • Reported diluted earnings per share were $1.72, compared with $2.07.
  • Adjusted diluted earnings per share were $1.94, compared with $2.02.
  • Reported net income was $3,351 million, compared with $3,811 million.
  • Adjusted net income was $3,752 million, compared with $3,714 million.

Outlook:

The global economy is forecast to slow in calendar 2023, but to a lesser degree than previously expected. A dramatic pull-back in energy prices has provided some economic relief in Europe and the sudden end of zero-COVID policies in China has provided an earlier lift to its economic prospects. While concerns about the global economy have eased, the risk of recession remains elevated. In North America, central banks have raised policy rates dramatically over the past year. The impact of this sizeable increase is expected to be the primary influence dampening economic growth in 2023 and into 2024. The recent U.S. bank failures have tightened credit conditions, which are likely to exert an increasing drag on economic activity in the months ahead although the full effects remain uncertain.

The U.S. economy expanded by 1.1% annualized in the first calendar quarter of 2023. Underlying domestic demand accelerated to 3.2%, due to a sharp rebound in consumer spending on motor vehicles and parts, but a sharp drawdown in inventories weighed on headline economic growth. A cooler economy was evident in softness in business investment, which expanded by only 0.7% and a continued downturn in housing activity which weighed on growth.

As of April, the job market was still tight with the unemployment rate at 3.4%, the lowest in over 50 years. However, there are signs that demand for workers is cooling, hiring trends are slowing, job openings have declined and claims for jobless benefits have been trending higher. Inflation has started to dissipate, but underlying services price pressures have been more persistent, and well above the U.S. Federal Reserve’s 2% target. TD Economics expects domestic spending to slow significantly over the second half of 2023, leading unemployment to rise gradually, and an eventual cooling in services inflation.

The Federal Reserve has signalled that after having raised interest rates by 500 basis points (bps) this tightening cycle, it is now in wait and see mode. TD Economics expects the federal funds rate will remain at its current range of 5.00-5.25% through the end of calendar 2023, before the Federal Reserve embarks on a series of interest rate cuts next year. If a further cooling in the labour market does not materialize, further interest rate increases in the coming months may be required. Given the steep rise in interest rates over the past year, the trend towards tighter U.S. credit conditions and the likelihood of rolling periods of financial stress related to the debt ceiling negotiations and/or other risk factors, the probability of a recession stateside remains elevated.

The Canadian economy is likely to have recorded a solid rate of expansion in the first calendar quarter of 2023, reflecting a rebound from the soft fourth calendar quarter of 2022. Despite the financial impact of rising interest costs on highly indebted households, consumer spending has remained resilient amid strong job market conditions, excess savings and increased government supports. Housing has turned in a mixed performance, as homebuilding activity has slowed while resale activity has shown signs of stabilization in recent months.

Canadian inflation has moderated, although the labour market remains quite strong with the unemployment rate at 5.0% in April 2023, near a cyclical low. TD Economics expects the aggregate spending of households and businesses to stagnate in the coming quarters, leading to weaker job market conditions and higher unemployment. Given the tepid growth backdrop and uncertainty surrounding the impact of past interest rate hikes on highly indebted Canadian households, the risk of recession also remains elevated in Canada.

The Bank of Canada left the overnight interest rate unchanged in April, at 4.50%. It signalled an intention to leave interest rates at their current level, provided the economy and inflation continue to slow in line with its outlook. The Canadian dollar is expected to hover around the 70-75 U.S. cent range in calendar 2023.

Source: (TD-T) Q2-2023 Report to Shareholders


MP Market Review – May 19, 2023

Last updated by BM on May 22, 2023

Summary 

  • This is a weekly installment of our MP Market Review series, which provides updates on the financial markets and Canadian dividend growth companies we monitor on ‘The List’.
  • Last week, ‘The List’ was down slightly with a YTD price return of +7.0% (capital). Dividend growth remained the same and is now at +8.4% YTD, highlighting growth in income over the past year.
  • Last week, no dividend increases from companies on ‘The List’.
  • Last week, no earnings reports from companies on ‘The List’.
  • Two companies on ‘The List’ are due to report earnings this week.
  • If you’re interested in creating your own dividend growth income portfolio, consider subscribing to our premium service, which grants you access to the MP Wealth-Builder Model Portfolio (CDN) and exclusive subscriber-only content.  Learn More         

Introduction

“You have a pair of pants. In the left pocket, you have $100. You take $1 out of the left pocket and put it in the right pocket. You now have $101. There is no diminution of dollars in your left pocket. That is one magic pair of pants.”

This ‘magic pants’ analogy was from a Seeking Alpha article on dividend investing I read about a decade ago and was one of the catalysts for me to take a closer look at this type of investing and see if it truly was magical. 

After conducting additional research, I have shifted towards utilizing a dividend growth investing (DGI) strategy as my primary investment approach. While I maintain portfolios consisting of high-quality dividend growers from both the United States and Canada, I have opted to concentrate on Canadian (CDN) dividend growth companies in this blog. This is due to several reasons, including a smaller pool of DGI companies to track, a lack of coverage for the DGI strategy by the North American investment media, and a tendency for those who do cover DGI to narrowly focus on only a handful of sectors (Energy and Financials).

While ‘The List’ is not a portfolio in itself, it serves as an excellent initial reference for individuals seeking to diversify their investments and attain higher returns in the Canadian stock market. Through our blog, we provide weekly updates on ‘The List’ and offer valuable perspectives and real-life examples of the dividend growth investing strategy in practice. This helps readers gain a deeper understanding of how to implement and benefit from this investment approach.

DGI Thoughts

Your money is like a bar of soap – the more you handle it, the less you’ll have.”

– Eugene Fama, Famous Economist

At the end of April, we completed our first fiscal year managing our MP Wealth-Builder Model Portfolio (CDN) according to our Business Plan.  Here are the quality companies we purchased during the year and their dividends and prices as of April 30, 2023. The portfolio is off to a good start as we purchased a number of quality companies at sensible prices.

Here are a few notable points to consider when reviewing the transactions. Firstly, it is worth mentioning that we successfully attained our targeted average initial yield of 3% and annualized total return of 10%, as projected in our Business Plan. This accomplishment is particularly noteworthy considering that numerous ETFs and Mutual Funds experienced negative total returns during the same time period. Secondly, take note of the three trades we executed for Franco Nevada. Each time the price experienced a significant decline, we capitalized on the opportunity to increase our holdings. Ultimately, all three trades have proven to be fruitful. Our confidence in the process empowered us to buy more as the price declined. Lastly, it is important to observe the frequency of our trading activities. Despite not engaging in active trading, we have managed to achieve success. Our bar of soap hasn’t been handled much with only fourteen trades over the past twelve months!

If you have not yet joined as a subscriber of the blog to receive DGI Alerts on the activity and content related to our model portfolio, it’s not too late. Click Here. 

Recent News 

Searching for the sweet spot of yield and dividend growth (Gobe & Mail)

https://www.theglobeandmail.com/investing/education/article-searching-for-the-sweet-spot-of-yield-and-dividend-growth/

The author talks about how to estimate returns for dividend growth stocks.

“Specifically, the equation holds that a stock’s annual return should equal the current dividend yield plus the dividend growth rate. For example, a stock that yields 6 per cent, and whose dividend grows at 4 per cent annually, should theoretically return 10 per cent annually, assuming all dividends are reinvested in additional shares.”

The problem with this simplistic equation is that it does not take into consideration the ‘quality’ of the dividend growth stock or its current valuation. We use several quality indicators to screen for our investment candidates not just yield and growth. When it comes to valuation, we also want to be sure we are only buying at a sensible price as we have found that this affects future returns the most.

John Bogle, the founder of the Vanguard Group, has an alternative methodology for estimating future returns. What we like about Bogle’s formula is that it backtests well and seems to align with the dividend growth stocks we invest in.

Future Market Returns = Dividend Yield + Earnings Growth +/- Change in P/E Ratio

Bogle calls the first two components, Yield + Growth, investment aspects of the investment return and the last component, +/- Change in P/E Ratio, the speculative return – what people will pay for a dollar’s worth of earnings.

To learn more about Bogle’s formula, see our article, ‘Estimating Future Returns’.

Cash is king. Here’s why we should resist its allure (Globe & Mail)

https://www.theglobeandmail.com/investing/markets/inside-the-market/article-cash-investing-recession-risks/

Although the last year has been difficult for many investors, dividend growth investors that follow our process have thrived. The reason is that we don’t invest in just any stocks. We invest in quality dividend growth companies that continue to grow their cash flow and only buy when they are sensibly priced. Down markets make for excellent entry points for companies on ‘The List’. Knowing these subtle differences is crucial.

The author of this article discusses that in some cases holding cash is fine but holding it too long and you risk losing out on gains elsewhere. This is where the difficulty for most investors comes in. How do you know when it’s too long? We have never been able to figure that out, either. Hence, we remain invested in our portfolio of high-quality dividend growers across all market conditions. The growing dividends they provide compensate us for our patience, and when the economy rebounds, we reap the benefits, regardless of the timing.

To receive breaking news about companies on ‘The List’ follow us on Twitter @MagicPants_DGI.

The List (2023)

Last updated by BM on May 19, 2023

The Magic Pants List contains 27 Canadian dividend growth stocks. ‘The List’ contains Canadian companies that have raised their dividend yearly for at least the last ten years and have a market cap of over a billion dollars. Below is each stock’s symbol, name, current yield, current price, price return year-to-date, current dividend, dividend growth year-to-date and current dividend growth streak. Companies on ‘The List’ are added or subtracted once a year, on January 1. After that, ‘The List’ is set for the next twelve months. Prices and dividends are updated weekly.

SYMBOL COMPANY YLD PRICE YTD % DIV YTD % STREAK
AQN-N Algonquin Power & Utilities 6.0% $8.46 25.7% $0.51 -29.0% 12
ATD-T Alimentation Couche-Tard Inc. 0.8% $66.01 9.8% $0.56 19.1% 13
BCE-T Bell Canada 6.0% $63.43 5.3% $3.82 5.0% 14
BIP-N Brookfield Infrastructure Partners 4.4% $37.07 5.2% $1.44 6.3% 15
CCL-B-T CCL Industries 1.5% $70.68 21.8% $1.06 10.4% 21
CNR-T Canadian National Railway 2.0% $161.39 -0.9% $3.16 7.8% 27
CTC-A-T Canadian Tire 4.1% $169.53 15.6% $6.90 17.9% 12
CU-T Canadian Utilities Limited 4.7% $38.02 2.9% $1.79 1.0% 51
DOL-T Dollarama Inc. 0.3% $84.51 5.8% $0.27 23.8% 12
EMA-T Emera 4.8% $57.00 8.3% $2.76 3.0% 16
ENB-T Enbridge Inc. 7.1% $50.07 -6.1% $3.55 3.2% 27
ENGH-T Enghouse Systems Limited 2.3% $37.46 4.9% $0.85 18.2% 16
FNV-N Franco Nevada 0.9% $153.08 10.8% $1.36 6.3% 15
FTS-T Fortis 3.9% $58.65 6.0% $2.26 4.1% 49
IFC-T Intact Financial 2.2% $203.60 4.0% $4.40 10.0% 18
L-T Loblaws 1.4% $122.98 2.2% $1.74 10.3% 11
MGA-N Magna 3.5% $52.73 -8.3% $1.84 2.2% 13
MRU-T Metro 1.6% $75.20 -0.4% $1.21 10.0% 28
RY-T Royal Bank of Canada 4.2% $127.19 -0.7% $5.28 6.5% 12
SJ-T Stella-Jones Inc. 1.5% $61.53 24.1% $0.92 15.0% 18
STN-T Stantec Inc. 1.0% $79.43 21.6% $0.77 8.5% 11
TD-T TD Bank 4.7% $82.27 -6.2% $3.84 7.9% 12
TFII-N TFI International 1.3% $109.01 8.9% $1.40 29.6% 12
TIH-T Toromont Industries 1.5% $112.70 15.3% $1.68 10.5% 33
TRP-T TC Energy Corp. 6.8% $54.36 2.0% $3.69 3.4% 22
T-T Telus 5.2% $27.38 4.0% $1.43 7.3% 19
WCN-N Waste Connections 0.7% $140.30 6.5% $1.02 7.4% 13
Averages 3.1% 7.0% 8.4% 19

Six Canadian stocks on ‘The List’ declare earnings and dividends in US dollars and are inter-listed on a US exchange in US dollars. The simplest way to display dividend and price metrics for these stocks is to show their US exchange symbols along with their US dividends and price. The stocks I am referring to have a -N at the end of their symbols. You can still buy their Canadian counterparts (-T), but your dividends will be converted into CDN dollars and will fluctuate based on the exchange rate.

Note: When the dividend and share price currency match, the calculation is straightforward. But it’s not so simple when the dividend is declared in one currency, and the share price is quoted in another. Dividing the former by the latter would produce a meaningless result because it’s a case of apples and oranges. To calculate the yield properly, you must express the dividend and share price in the same currency.

Performance of ‘The List’

Feel free to click on this link, ‘The List’ for a sortable version from our website.

Last week, ‘The List’ was down slightly with a YTD price return of +7.0% (capital). Dividend growth remained the same and is now at +8.4% YTD, highlighting growth in income over the past year.

The best performers last week on ‘The List’ were Toromont Industries (TIH-T), up +6.66%; Enghouse Systems Limited (ENGH-T), up +6.06%; and Stella-Jones Inc. (SJ-T), up +5.04%.

Fortis (FTS-T) was the worst performer last week, down -4.71%.


Dividend Increases

“The growth of dividend paying ability is of significance in the determination of a stock’s quality, or general safety…”

– Arnold Bernhard (the founder of Value Line)

“As a dividend increase is a positive sign of a company’s financial strength, the safest purchase, after research, is a stock with a recent dividend increase.”

– Tom Connolly (the founder of dividendgrowth.ca)

Last week, no dividend increases from companies on ‘The List’.


Earnings Releases

Benjamin Graham once remarked that earnings are the principal factor driving stock prices.

Each quarter we will provide readers with weekly earnings updates of stocks on ‘The List’ during the calendar earnings season. Q2 2023 earnings season begins this week as we hear from the Banks.

The updated earnings calendar can be found here.

Earnings growth and dividend growth tend to go hand in hand, so this information can tell us a lot about the future dividend growth of our quality companies. Monitoring our dividend growers periodically is part of the process, and reading the quarterly earnings releases is a good place to start.

Two earnings reports from companies on ‘The List’ this week 

Canada’s big Banks report their fiscal Q2 earnings this week.

Royal Bank of Canada (RY-T) will release its second-quarter fiscal 2023 results on Thursday, May 25, 2023, before markets open.

TD Bank (TD-T) will release its second-quarter fiscal 2023 results on Thursday, May 25, 2023, before markets open.

Last week, no earnings report from companies on ‘The List’.


MP Market Review – May 12, 2023

Last updated by BM on May 15, 2023

Summary 

  • This is a weekly installment of our MP Market Review series, which provides updates on the financial markets and Canadian dividend growth companies we monitor on ‘The List’.
  • Last week, ‘The List’ was flat with a YTD price return of +7.3% (capital). Dividend growth remained the same and is now at +8.4% YTD, highlighting growth in income over the past year.
  • Last week, no dividend increases from companies on ‘The List’.
  • Last week, seven earnings reports from companies on ‘The List’.
  • No companies on ‘The List’ are due to report earnings this week.
  • If you’re interested in creating your own dividend growth income portfolio, consider subscribing to our premium service, which grants you access to the MP Wealth-Builder Model Portfolio (CDN) and exclusive subscriber-only content.  Learn More         

Introduction

“You have a pair of pants. In the left pocket, you have $100. You take $1 out of the left pocket and put it in the right pocket. You now have $101. There is no diminution of dollars in your left pocket. That is one magic pair of pants.”

This ‘magic pants’ analogy was from a Seeking Alpha article on dividend investing I read about a decade ago and was one of the catalysts for me to take a closer look at this type of investing and see if it truly was magical. 

After conducting additional research, I have shifted towards utilizing a dividend growth investing (DGI) strategy as my primary investment approach. While I maintain portfolios consisting of high-quality dividend growers from both the United States and Canada, I have opted to concentrate on Canadian (CDN) dividend growth companies in this blog. This is due to several reasons, including a smaller pool of DGI companies to track, a lack of coverage for the DGI strategy by the North American investment media, and a tendency for those who do cover DGI to narrowly focus on only a handful of sectors (Energy and Financials).

While ‘The List’ is not a portfolio in itself, it serves as an excellent initial reference for individuals seeking to diversify their investments and attain higher returns in the Canadian stock market. Through our blog, we provide weekly updates on ‘The List’ and offer valuable perspectives and real-life examples of the dividend growth investing strategy in practice. This helps readers gain a deeper understanding of how to implement and benefit from this investment approach.

DGI Thoughts

“Investing is not a game where the guy with the 160 IQ beats the guy with the 130 IQ.”

– Warren Buffett

Q1 2023 earnings season for companies on ‘The List’ is now behind us. Check out the earnings calendar results at the bottom of ‘The List’ page.

Next week we will send all Subscribers the yearly review of our MP Wealth-Builder Model Portfolio (CDN). Despite negative results from the benchmarks we track, the portfolio generated positive income and capital returns in its inaugural year (May 1, 2022-April 30, 2023).

Here is a glimpse at some of our best purchases from 2022:

We are making good progress towards achieving the income goals set out in our business plan, which serves as a comprehensive roadmap for our model portfolio. If you haven’t joined us as a Subscriber yet and haven’t been receiving our timely DGI Alerts, informing you about the purchase of our reliable dividend-growing stocks and the reasons behind them, what are you waiting for?

If our strategy and approach to dividend growth can safeguard your investment capital while generating increasing income and capital growth in the current economic climate, there’s a strong likelihood that it can do so in virtually any market. Don’t miss out on this opportunity.

If you have not yet joined as a subscriber of the blog to receive DGI Alerts on the activity and content related to our model portfolio, it’s not too late. Click Here. 

Recent News 

Canadian Tire results show consumer shift from discretionary purchases (Globe & Mail)

https://www.theglobeandmail.com/business/article-canadian-tire-results-show-consumer-shift-from-discretionary-purchases/

Canadian Tire has been under consideration for some time, but we have not yet identified the ideal opportunity to invest. The company’s performance in the last quarter was particularly challenging, with a mild winter and a fire incident at one of their distribution centers. As the economy experiences a slowdown, consumers have become more cautious in their spending habits. As a result, we are waiting for either a positive shift in the economy or a significant margin of safety before deciding to initiate a position in Canadian Tire.

With utilities recovering from a 2022 beating, this is my go-to stock (Globe & Mail)

https://www.theglobeandmail.com/investing/markets/inside-the-market/article-gordon-pape-with-utilities-recovering-from-a-2022-beating-this-is-my/

The stock covered in this article has been paying a growing dividend for almost 50 years! You rarely hear about it when markets are roaring, but it continues to provide market beating returns decade after decade when purchased at a sensible price. One of the original four dividend growers I bought way back in 2012 in the mid $30 dollar range.

To receive breaking news about companies on ‘The List’ follow us on Twitter @MagicPants_DGI.

The List (2023)

Last updated by BM on May 12, 2023

The Magic Pants List contains 27 Canadian dividend growth stocks. ‘The List’ contains Canadian companies that have raised their dividend yearly for at least the last ten years and have a market cap of over a billion dollars. Below is each stock’s symbol, name, current yield, current price, price return year-to-date, current dividend, dividend growth year-to-date and current dividend growth streak. Companies on ‘The List’ are added or subtracted once a year, on January 1. After that, ‘The List’ is set for the next twelve months. Prices and dividends are updated weekly.

SYMBOL COMPANY YLD PRICE YTD % DIV YTD % STREAK
AQN-N Algonquin Power & Utilities 5.9% $8.61 27.9% $0.51 -29.0% 12
ATD-T Alimentation Couche-Tard Inc. 0.8% $66.68 10.9% $0.56 19.1% 13
BCE-T Bell Canada 6.0% $64.17 6.5% $3.82 5.0% 14
BIP-N Brookfield Infrastructure Partners 4.4% $35.85 5.2% $1.44 6.3% 15
CCL-B-T CCL Industries 1.6% $68.01 17.2% $1.06 10.4% 21
CNR-T Canadian National Railway 1.9% $163.41 0.3% $3.16 7.8% 27
CTC-A-T Canadian Tire 4.1% $168.28 14.8% $6.90 17.9% 12
CU-T Canadian Utilities Limited 4.5% $39.47 6.8% $1.79 1.0% 51
DOL-T Dollarama Inc. 0.3% $84.46 5.8% $0.27 23.8% 12
EMA-T Emera 4.7% $58.99 12.1% $2.76 3.0% 16
ENB-T Enbridge Inc. 6.8% $52.11 -2.3% $3.55 3.2% 27
ENGH-T Enghouse Systems Limited 2.4% $35.32 -1.1% $0.85 18.2% 16
FNV-N Franco Nevada 0.9% $156.72 13.4% $1.36 6.3% 15
FTS-T Fortis 3.7% $61.55 11.2% $2.26 4.1% 49
IFC-T Intact Financial 2.2% $199.57 1.9% $4.40 10.0% 18
L-T Loblaws 1.4% $123.45 2.6% $1.74 10.3% 11
MGA-N Magna 3.5% $52.56 -8.6% $1.84 2.2% 13
MRU-T Metro 1.5% $78.56 4.1% $1.21 10.0% 28
RY-T Royal Bank of Canada 4.1% $129.89 1.5% $5.28 6.5% 12
SJ-T Stella-Jones Inc. 1.6% $58.58 18.2% $0.92 15.0% 18
STN-T Stantec Inc. 1.0% $78.91 20.8% $0.77 8.5% 11
TD-T TD Bank 4.7% $82.33 -6.1% $3.84 7.9% 12
TFII-N TFI International 1.3% $107.00 6.9% $1.40 29.6% 12
TIH-T Toromont Industries 1.6% $105.66 8.1% $1.68 10.5% 33
TRP-T TC Energy Corp. 6.6% $55.94 5.0% $3.69 3.4% 22
T-T Telus 5.2% $27.74 5.4% $1.43 7.3% 19
WCN-N Waste Connections 0.7% $143.89 9.2% $1.02 7.4% 13
Averages 3.1% 7.3% 8.4% 19

Six Canadian stocks on ‘The List’ declare earnings and dividends in US dollars and are inter-listed on a US exchange in US dollars. The simplest way to display dividend and price metrics for these stocks is to show their US exchange symbols along with their US dividends and price. The stocks I am referring to have a -N at the end of their symbols. You can still buy their Canadian counterparts (-T), but your dividends will be converted into CDN dollars and will fluctuate based on the exchange rate.

Note: When the dividend and share price currency match, the calculation is straightforward. But it’s not so simple when the dividend is declared in one currency, and the share price is quoted in another. Dividing the former by the latter would produce a meaningless result because it’s a case of apples and oranges. To calculate the yield properly, you must express the dividend and share price in the same currency.

Performance of ‘The List’

Feel free to click on this link, ‘The List’ for a sortable version from our website.

Last week, ‘The List’ was flat with a YTD price return of +7.3% (capital). Dividend growth remained the same and is now at +8.4% YTD, highlighting growth in income over the past year.

The best performers last week on ‘The List’ were Stella-Jones Inc. (SJ-T), up +7.74%; CCL Industries (CCL-B-T), up +6.18%; and Waste Connections (WCN-N), up +2.18%.

Canadian Tire (CTC-A-T) was the worst performer last week, down -3.65%.


Dividend Increases

“The growth of dividend paying ability is of significance in the determination of a stock’s quality, or general safety…”

– Arnold Bernhard (the founder of Value Line)

“As a dividend increase is a positive sign of a company’s financial strength, the safest purchase, after research, is a stock with a recent dividend increase.”

– Tom Connolly (the founder of dividendgrowth.ca)

Last week, no dividend increases from companies on ‘The List’.


Earnings Releases

Benjamin Graham once remarked that earnings are the principal factor driving stock prices.

Each quarter we will provide readers with weekly earnings updates of stocks on ‘The List’ during the calendar earnings season. Q1 2023 earnings season is now over!

The updated earnings calendar can be found here.

Earnings growth and dividend growth tend to go hand in hand, so this information can tell us a lot about the future dividend growth of our quality companies. Monitoring our dividend growers periodically is part of the process, and reading the quarterly earnings releases is a good place to start.

No earnings reports from companies on ‘The List’ this week 

Last week, seven earnings report from companies on ‘The List’.

Stella-Jones Inc. (SJ-T) released its first-quarter fiscal 2023 results on Wednesday, May 10, 2023, before markets opened.

“The Company had an excellent start to the year, propelled by the momentum of our growth in 2022. Our record results in Q1 featured strong sales, higher EBITDA and margin, and were marked by an out-performance of our utility poles product category, which saw a 29% organic sales increase. Our first quarter results also reflected steady sales growth in railway ties, aligned with our expectations for this product category, and an anticipated pullback in residential lumber sales compared to 2022.

Stella-Jones’ performance in the first quarter further evidenced our ongoing proactivity in securing fibre supply and increasing pole production capacity, and our financial strength to support growth. We are executing on our plan to grow our infrastructure-related businesses, and deliver on our commitment to return capital to shareholders. As we continue to invest in our business and seek expansion opportunities, we are fulfilling or exceeding the objectives laid out in our 3-year plan and I am proud of our business for continuously delivering such a high standard of service to our customers.”

– President and Chief Executive Officer, Eric Vachon

Highlights:

  • Sales of $710 million for the first quarter
  • Strong 18% organic sales growth in infrastructure-related businesses
  • Record EBITDA of $120 million, or a margin(1) of 16.9%, up from 13.5% in Q1 2022
  • Net income of $60 million, or $1.03 per share, up 41% from EPS in Q1 2022

Outlook:

The Company continues to be favourably positioned to meet or exceed the financial objectives set for 2024, as summarized in the table below. Driven by the out-performance of utility poles, sales in 2024 are now expected to exceed the target range. By 2024, utility poles sales are projected to grow at a compound annual rate of 20% from 2022 and the Company’s EBITDA margin is expected to exceed the 15% target by approximately 100 basis points.

Source: (SJ-T) Q1-2023 News Release


CCL Industries (CCL-B-T) released its first-quarter fiscal 2023 results on Wednesday, May 10, 2023, after markets closed.

“I am pleased to report first quarter results ahead of internal expectations. The CCL Segment and Checkpoint both posted organic sales growth and solid improvements in profitability while Avery had an outstanding quarter. Innovia results improved sequentially compared to the fourth quarter of 2022 but were below prior year first quarter. This all summed to a 10.6% increase in adjusted basic earnings to $0.94 per Class B share(3) , compared to the first quarter of 2022.”

– President and Chief Executive Officer, Geoffrey T. Martin

Highlights:

  • Per Class B share: $0.94 adjusted basic earnings up 10.6%; $0.94 basic earnings up 11.9%; currency translation positive $0.05 per share
  • Sales increased 8.6% on 1.4% organic growth, 3.0% acquisitions and 4.2% positive currency translation
  • Operating income improved 12.7%, with a 15.6% operating margin up 60 bps

Outlook:

  • Core CCL business units’ outlook stable overall
  • CCL Design: expect some recovery in Q2 as China has a full quarter
  • CCL Secure will be below Q2 22
  • Avery back to school season started very early Q2 22, will not repeat in 2023…..so tough comps for Q2, easier for Q3
  • Checkpoint: apparel market conditions unlikely to improve much until H2 23, MAS outlook stable with easier comps
  • Innovia volume continues to be impacted by weak label materials industry demand, inflationary pressures and inventory cost squeeze both easing
  • Modest FX tailwind

Source: (CCL-B-T) Q1-2023 News Release


Intact Financial (IFC-T) released its first-quarter fiscal 2023 results on Wednesday, May 10, 2023, after markets closed.

“The business delivered another strong quarter, with a mid-teens operating ROE and solid results in all geographies. Since closing the RSA acquisition, we have been active in improving performance and de-risking the transaction. The UK&I segment is now well along the path to outperformance, and we expect it to reach a low-90s combined ratio by the end of 2024, a year ahead of schedule. I remain confident in the outlook for Intact as a whole, and our strong balance sheet positions us to capture opportunities as they arise.”

– Chief Executive Officer, Charles Brindamour

Highlights:

  • Operating DPW growth of 4% in Q1-2023 despite the exit of UK personal lines motor, mainly reflecting rate actions in supportive market conditions
  • Combined ratio of 87.4% (91.9% undiscounted), reflected solid underwriting performance in all geographies
  • Net operating income per share up 4% to $3.06 on premium growth, higher investment yields and increased distribution income
  • EPS decreased to $2.06, due in part to non-recurring UK personal lines motor exit expenses, while ROE was 15.4%
  • BVPS decreased 6% from Q4-2022 to $77.72, largely reflecting the UK pension de-risking actions
  • Balance sheet remained strong with a total capital margin of $2.8 billion, and debt-to-total capital ratio on track to return towards 20% by year end 2023

Outlook:

  • Over the next twelve months, we expect firm-to-hard insurance market conditions to continue in most lines of business, driven by inflation, natural disasters, and a hard reinsurance market.
  • In Canada, we expect firm market conditions to continue in personal property. Personal auto premiums are expected to grow by mid-to-high single-digits in response to inflation and evolving driving patterns.
  • In commercial and specialty lines across all geographies, we continue to expect hard market conditions in most lines of business.
  • In the UK&I, the personal property market has begun to firm but further rate increases are required to deal with inflationary pressures, natural disasters and a hard reinsurance market.

Source: (IFC-T) Q1-2023 News Release


Stantec (STN-T) released its first-quarter fiscal 2023 results on Wednesday, May 10, 2023, after markets closed.

“Our first quarter results reflect the strong market positioning of our business as we continue to build on favorable macro themes and momentum coming out of last year. 2023 is shaping up to be another very strong year for Stantec and we are well positioned to deliver on our outlook for the year.”

– President and Chief Executive Officer, Gord Johnston

Highlights:

  • Net revenue of $1.2 billion, an increase of 17.0% over Q1 2022
  • Adjusted diluted EPS1 of $0.73, up 19.7% over Q1 2022
  • Backlog of $6.2 billion, up 5.6% since December 31, 2022 and 14.8% over Q1 2022
  • Full year guidance for 2023 reaffirmed

Outlook:

We reaffirm our guidance provided in the Outlook section of our 2022 Annual Report (incorporated here by reference). Our annual targets were based on the assumption of continued public sector spending in alignment with announced programs and acts, and only modest transitory recessions in key geographies.

We expect that net revenue growth will increase 7% to 11%, with net revenue organic growth in the mid- to highsingle digits. Organic growth in the US is expected to be in the high single digits to low double digits, driven by momentum from our record-high US backlog and project opportunities arising from announced programs and acts. In Canada, we expect to maintain high levels of activity, moderating to organic growth in the low single digits. Organic growth in Global is expected to achieve mid- to high-single digits, driven by continued high levels of activity in our UK Water business and demand and stimulus in environmental services and infrastructure sectors.

We expect to deliver on our annual targets on adjusted EBITDA and adjusted net income margins and growth in adjusted diluted EPS through our continued discipline in the management of administration and marketing costs, investments in the commercialization of new innovations and technologies, and implementation of our 2023 Real Estate Strategy.

While our Q1 2023 net revenue and adjusted diluted EPS growth exceeded our target annual ranges, our expectations for the full year remain unchanged. Further, our adjusted EBITDA and adjusted net income margins for Q1 2023 are below our targeted annual ranges due to the typical slowdown in the first quarter related to winter weather conditions and holiday schedules. We remain confident we will achieve our annual targets by the end of the fiscal year.

Source: (STN-T) Q1-2023 News Release


Canadian Tire (CTC-A-T) released its first-quarter fiscal 2023 results on Thursday, May 11, 2023, before markets opened.

“Our Q1 financial results were impacted by a number of factors. Our Retail segment was impacted by the fire at our A.J. Billes distribution centre, as well as unseasonably mild winter weather and a slow start to spring in several regions of Canada. The Financial Services business historically makes a significant contribution to Canadian Tire Corporation’s performance in the first quarter, and this quarter was no different. The strength of our teams and our diligent focus on our Better Connected strategy leaves us confident in our ability to deliver long term returns for shareholders and value to our customers.”

– President and Chief Executive Officer, Greg Hicks

Highlights:

  • Revenue was $3,707.2 million compared to $3,837.4 million in the same period last year; excluding the change in accounting estimate, Revenue (excluding Petroleum) decreased 4.9%. Financial Services segment revenue growth partially offset the Retail segment decline, mainly due to the anticipated lower revenue at Canadian Tire Retail.
  • Consolidated income before income taxes was $66.6 million, a decrease of $228.3 million compared to the prior year, due in part to costs of $67.7 million relating to the distribution centre fire. Normalized income before income taxes was $134.3 million.
  • Diluted EPS was $0.13 compared to $3.03 in the prior year; Normalized diluted EPS was $1.00, down $2.06, or down $2.72 excluding the $0.66 favourable impact of the change in accounting estimate2, mainly attributable to a decline in earnings in the Retail segment.

Outlook:

The $3.4 billion of strategic investments, announced in conjunction with the strategy, will create better customer experiences and deeper customer connections. These investments are being allocated to:

  • Enhancing the omnichannel customer experience by better connecting digital and physical channels and rolling out a new “Concept Connect” to Canadian Tire stores;
  • Strengthening supply chain fulfillment infrastructure and automation; and
  • Modernizing IT infrastructure and driving efficiency in how CTC operates.

In conjunction with the announcement of its strategic plan, CTC also established the following financial aspirations for fiscal years 2022 to 2025:

  • 4+ percent annual average comparable sales growth over the four-year period;
  • Diluted EPS of $26.00+ by 2025; and
  • Retail Return on Invested Capital (“ROIC”) of approximately 15+ percent by 2025.

Source: (CTC-A-T) Q1-2023 News Release


Algonquin Power & Utilities (AQN-N) drelease its first-quarter fiscal 2023 results on Thursday, May 11, 2023, before markets opened.

“In the first quarter of 2023, we achieved operational milestones in line with our targets. In our regulated business, we achieved an increased operating profit reflecting planned execution and constructive rate case outcomes. In our renewables business, we advanced our project pipeline and achieved overall financial performance consistent with our expectations.”

– President, Arun Banskota

Highlights:

  • Termination of Acquisition of Kentucky Power Company on April 17, 2023.
  • Adjusted EBITDA of $341.0 million, an increase of 3%;
  • Adjusted Net Earnings of $119.9 million, a decrease of 15%; and
  • Adjusted Net Earnings per common share of $0.17, a decrease of 19%, in each case on a year-over-year basis.

Outlook:

Reiterate Estimated 2023 Adjusted Net Earnings Per Common Share

  • The Company reiterates its previously-disclosed estimate of Adjusted Net Earnings per common share for the 2023 fiscal year within a range of $0.55-$0.61.

Organic Capital Investment Expectations Maintained

  • With the Kentucky Power Transaction Termination, the Company expects to spend approximately $1 billion on capital investment opportunities in the 2023 fiscal year. Of this amount, approximately $700 million is expected to be spent by the Regulated Services Group and approximately $300 million is expected to be spent by the Renewable Energy Group.

Remain Focused on Optimizing Balance Sheet

  • The Company remains committed to a BBB credit rating and does not expect any new equity financings through 2024.

Source: (AQN-N) Q1-2023 News Release


Emera Inc. (EMA-T) released its first-quarter fiscal 2023 results on Friday, May 12, 2023, before markets opened.

“We are off to a solid start in 2023, continuing our track record of delivering for customers and providing predictable, reliable earnings growth for our shareholders. Across Emera, our teams are executing on a $3 billion capital plan in support of our strategy, focused on a responsible and balanced energy transition for our customers.”

–  President and Chief Executive Officer, Scott Balfour

Highlights:

  • Quarterly adjusted earnings per share (“EPS”) of $0.99 increased $0.07 or 8% compared to $0.92 in Q1 2022 resulting from higher marketing and trading margin at Emera Energy Services (“EES”) and higher earnings at New Mexico Gas Company (“NMGC”). This was partially offset by lower contributions from Tampa Electric Company (“TEC”) and Nova Scotia Power and higher interest expense throughout the business.
  • Quarterly reported net income increased by $198 million to $560 million compared to $362 million in Q1 2022 and quarterly reported EPS increased by $0.69 to $2.07 from $1.38 in Q1 2022 primarily due to higher mark-to-market (“MTM”) gains at EES.
  • The commissioning of the Labrador Island Link (“LIL”) in April was another important step in a transformative energy project that has already delivered more than one million megawatt hours of hydro energy over the Maritime Link and will continue to deliver clean, reliable energy to Nova Scotians for years to come.

Outlook:

There have been no material changes in Emera’s business overview and outlook from the Company’s 2022 annual MD&A.

Source: (EMA-T) Q1-2023 News Release


MP Market Review – May 05, 2023

Last updated by BM on May 08, 2023

Summary 

  • This is a weekly installment of our MP Market Review series, which provides updates on the financial markets and Canadian dividend growth companies we monitor on ‘The List’.
  • Last week, ‘The List’ was down slightly with a YTD price return of +7.3% (capital). Dividend growth increased and is now at +8.4% YTD, highlighting growth in income over the past year.
  • Last week, two dividend increases from companies on ‘The List’.
  • Last week, eight earnings reports from companies on ‘The List’.
  • Seven companies on ‘The List’ are due to report earnings this week.
  • If you’re interested in creating your own dividend growth income portfolio, consider subscribing to our premium service, which grants you access to the MP Wealth-Builder Model Portfolio (CDN) and exclusive subscriber-only content.  Learn More         

Introduction

“You have a pair of pants. In the left pocket, you have $100. You take $1 out of the left pocket and put it in the right pocket. You now have $101. There is no diminution of dollars in your left pocket. That is one magic pair of pants.”

This ‘magic pants’ analogy was from a Seeking Alpha article on dividend investing I read about a decade ago and was one of the catalysts for me to take a closer look at this type of investing and see if it truly was magical. 

After conducting additional research, I have shifted towards utilizing a dividend growth investing (DGI) strategy as my primary investment approach. While I maintain portfolios consisting of high-quality dividend growers from both the United States and Canada, I have opted to concentrate on Canadian (CDN) dividend growth companies in this blog. This is due to several reasons, including a smaller pool of DGI companies to track, a lack of coverage for the DGI strategy by the North American investment media, and a tendency for those who do cover DGI to narrowly focus on only a handful of sectors (Energy and Financials).

While ‘The List’ is not a portfolio in itself, it serves as an excellent initial reference for individuals seeking to diversify their investments and attain higher returns in the Canadian stock market. Through our blog, we provide weekly updates on ‘The List’ and offer valuable perspectives and real-life examples of the dividend growth investing strategy in practice. This helps readers gain a deeper understanding of how to implement and benefit from this investment approach.

DGI Thoughts

“I continue to believe that short-term market forecasts are poison and should be kept locked up in a safe place, away from children and also from grown-ups who behave in the market like children.”

– Warren Buffett

After reading the article in the ‘News’ section centered around the 2023 Projection Assumption Guidelines published by the Financial Planning Canada Standards Council, I couldn’t help but take a look at the ten-year historical returns of the individual companies that make up ‘The List’.

10YR_GROWTH YIELD-01-01-2023

Not only did almost all of the companies on ‘The List’ outperform the total return ‘standards’ (4.7% annually over the long term) communicated to their customers by financial planners but many of the companies on ‘The List’ outperformed these standard returns from dividends alone (Growth Yield).

One of the ‘quality’ indicators we use when evaluating which companies on ‘The List’ to build our portfolios with is ‘Growth Yield’. Growth Yield helps us determine our return from dividends alone at some point in the future on an investment made today.

Growth yield refers to the yield on cost of a stock, which takes into account the current annualized dividend payments in relation to the original cost basis of the investment. We like the term growth yield better as it proves that growth (a key part of our strategy) has indeed happened and highlights the yield you are now making on dividends alone. The magic of growth yield is typically lost in all statements and conversations about investing. Knowing the subtle difference between a good yield and a growing yield is fundamental in what we do.

According to our experience, creating a stock portfolio with an average estimated growth yield and historical growth yield of greater than 7% after ten years has proven to be a reliable indicator of quality.

If you have not yet joined as a subscriber of the blog to receive DGI Alerts on the activity in our model portfolio, it’s not too late. Click Here. 

Recent News 

TD, First Horizon terminate US$13.4-billion takeover deal (Globe & Mail)

https://www.theglobeandmail.com/business/article-td-first-horizon-terminate-merger/

In our post ‘Toronto-Dominion Bank: Time To Supercharge Your Dividend Growth Investing (DGI) Returns’, a few weeks back, we mentioned this was one of the possible outcomes in our investment thesis section of the article. The share price has responded favorably to the news.

If this doesn’t get you to pay attention to your investing fees, nothing will (Globe & Mail)

https://www.theglobeandmail.com/investing/investment-ideas/article-if-this-doesnt-get-you-to-pay-attention-to-your-investing-fees-nothing/

“The brain trust for financial planning standards in Canada thinks a 50-50 balanced portfolio of stocks and bonds will make an average 4.7 per cent annually over the long term.”

Aren’t you glad we do things differently as dividend growth investors. Our dividend income return (Growth Yield) alone easily outperforms the ‘brain trust’ after only a few short years.

To receive breaking news about companies on ‘The List’ follow us on Twitter @MagicPants_DGI.

The List (2023)

Last updated by BM on May 05, 2023

The Magic Pants List contains 27 Canadian dividend growth stocks. ‘The List’ contains Canadian companies that have raised their dividend yearly for at least the last ten years and have a market cap of over a billion dollars. Below is each stock’s symbol, name, current yield, current price, price return year-to-date, current dividend, dividend growth year-to-date and current dividend growth streak. Companies on ‘The List’ are added or subtracted once a year, on January 1. After that, ‘The List’ is set for the next twelve months. Prices and dividends are updated weekly.

SYMBOL COMPANY YLD PRICE YTD % DIV YTD % STREAK
AQN-N Algonquin Power & Utilities 5.7% $8.83 31.2% $0.51 -29.0% 12
ATD-T Alimentation Couche-Tard Inc. 0.8% $67.21 11.8% $0.56 19.1% 13
BCE-T Bell Canada 5.9% $64.44 7.0% $3.82 5.0% 14
BIP-N Brookfield Infrastructure Partners 4.4% $35.54 5.2% $1.44 6.3% 15
CCL-B-T CCL Industries 1.7% $64.05 10.3% $1.06 10.4% 21
CNR-T Canadian National Railway 1.9% $163.07 0.1% $3.16 7.8% 27
CTC-A-T Canadian Tire 4.0% $174.65 19.1% $6.90 17.9% 12
CU-T Canadian Utilities Limited 4.6% $39.32 6.4% $1.79 1.0% 51
DOL-T Dollarama Inc. 0.3% $82.96 3.9% $0.27 23.8% 12
EMA-T Emera 4.7% $58.76 11.7% $2.76 3.0% 16
ENB-T Enbridge Inc. 6.6% $53.43 0.2% $3.55 3.2% 27
ENGH-T Enghouse Systems Limited 2.3% $36.18 1.3% $0.85 18.2% 16
FNV-N Franco Nevada 0.9% $159.01 15.1% $1.36 6.3% 15
FTS-T Fortis 3.7% $60.84 9.9% $2.26 4.1% 49
IFC-T Intact Financial 2.2% $199.87 2.1% $4.40 10.0% 18
L-T Loblaws 1.4% $122.34 1.7% $1.74 10.3% 11
MGA-N Magna 3.4% $53.98 -6.2% $1.84 2.2% 13
MRU-T Metro 1.6% $77.00 2.0% $1.21 10.0% 28
RY-T Royal Bank of Canada 4.0% $131.08 2.4% $5.28 6.5% 12
SJ-T Stella-Jones Inc. 1.7% $54.37 9.7% $0.92 15.0% 18
STN-T Stantec Inc. 0.9% $81.60 24.9% $0.77 8.5% 11
TD-T TD Bank 4.6% $83.30 -5.0% $3.84 7.9% 12
TFII-N TFI International 1.3% $106.20 6.1% $1.40 29.6% 12
TIH-T Toromont Industries 1.6% $104.83 7.3% $1.68 10.5% 33
TRP-T TC Energy Corp. 6.6% $55.94 5.0% $3.69 3.4% 22
T-T Telus 5.1% $28.13 6.9% $1.43 7.3% 19
WCN-N Waste Connections 0.7% $140.82 6.9% $1.02 7.4% 13
Averages 3.1% 7.3% 8.4% 19

Six Canadian stocks on ‘The List’ declare earnings and dividends in US dollars and are inter-listed on a US exchange in US dollars. The simplest way to display dividend and price metrics for these stocks is to show their US exchange symbols along with their US dividends and price. The stocks I am referring to have a -N at the end of their symbols. You can still buy their Canadian counterparts (-T), but your dividends will be converted into CDN dollars and will fluctuate based on the exchange rate.

Note: When the dividend and share price currency match, the calculation is straightforward. But it’s not so simple when the dividend is declared in one currency, and the share price is quoted in another. Dividing the former by the latter would produce a meaningless result because it’s a case of apples and oranges. To calculate the yield properly, you must express the dividend and share price in the same currency.

Performance of ‘The List’

Feel free to click on this link, ‘The List’ for a sortable version from our website.

Last week, ‘The List’ was down slightly with a YTD price return of +7.3% (capital). Dividend growth increased and is now at +8.4% YTD, highlighting growth in income over the past year.

The best performers last week on ‘The List’ were Franco Nevada (FNV-N), up +4.76%; Algonquin Power & Utilities (AQN-N), up +3.64%; and Magna (MGA-N), up +3.49%.

Toromont Industries (TIH-T) was the worst performer last week, down -4.25%.


Dividend Increases

“The growth of dividend paying ability is of significance in the determination of a stock’s quality, or general safety…”

– Arnold Bernhard (the founder of Value Line)

“As a dividend increase is a positive sign of a company’s financial strength, the safest purchase, after research, is a stock with a recent dividend increase.”

– Tom Connolly (the founder of dividendgrowth.ca)

Last week, two dividend increases from companies on ‘The List’.

Loblaws (L-T) on Wednesday said it increased its 2023 quarterly dividend from $.405 to $.446 per share, payable July 1, 2023, to shareholders of record on June 14, 2023.

This represents a dividend increase of +10.0%, marking the 12th straight year of dividend growth for this quality grocer.

Telus (T-T) on Thursday said it increased its 2023 quarterly dividend from $.3511 to $.3636 per share, payable July 4, 2023, to shareholders of record on June 09, 2023.

This represents a dividend increase of +3.6%, marking the 20th straight year of dividend growth for this quality telco.


Earnings Releases

Benjamin Graham once remarked that earnings are the principal factor driving stock prices.

Each quarter we will provide readers with weekly earnings updates of stocks on ‘The List’ during the calendar earnings season.

The updated earnings calendar can be found here.

Earnings growth and dividend growth tend to go hand in hand, so this information can tell us a lot about the future dividend growth of our quality companies. Monitoring our dividend growers periodically is part of the process, and reading the quarterly earnings releases is a good place to start.

Seven companies on ‘The List’ ares due to report earnings this week. 

Q1 earnings season wraps up this week with seven companies on ‘The List’ due to report earnings.

Stella-Jones Inc. (SJ-T) will release its first-quarter fiscal 2023 results on Wednesday, May 10, 2023, before markets open.

CCL Industries (CCL-B-T) will release its first-quarter fiscal 2023 results on Wednesday, May 10, 2023, after markets close.

Intact Financial (IFC-T) will release its first-quarter fiscal 2023 results on Wednesday, May 10, 2023, after markets close.

Stantec (STN-T) will release its first-quarter fiscal 2023 results on Wednesday, May 10, 2023, after markets close.

Canadian Tire (CTC-A-T) will release its first-quarter fiscal 2023 results on Thursday, May 11, 2023, before markets open.

Algonquin Power & Utilities (AQN-N) will release its first-quarter fiscal 2023 results on Thursday, May 11, 2023, before markets open.

Emera Inc. (EMA-T) will release its first-quarter fiscal 2023 results on Friday, May 12, 2023, before markets open.

Last week, eight earnings reports from companies on ‘The List’.

Franco Nevada (FNV-N) released its first-quarter fiscal 2023 results on Tuesday, May 2, 2023, after markets closed.

“Our diversified portfolio continues to generate strong cash flows and high margins. The first quarter was impacted by production disruptions at Cobre Panama and Antapaccay as well as lower energy prices. Stronger precious metal deliveries are anticipated in Q2 with both assets having returned to normal operations. “Cobre Panama’s CP 100 Expansion is on-track for year-end and we look forward to initial contributions from Magino, Séguéla and Salares Norte during the year”, commented Paul Brink, CEO. Franco-Nevada is debt-free, is growing its cash balances and has a strong pipeline of growth opportunities.

– Chief Executive Officer, Paul Brink

Highlights:

  • No debt and $2.2 billion in available capital as at March 31, 2023
  • Generated $209.8 million in operating cash flow during the quarter
  • 16 consecutive dividend increases. Quarterly dividend of $0.34/share

Source: (FNV-N) Q1-2023 News Release


Loblaws (L-T) released its first-quarter fiscal 2023 results on Wednesday, May 3, 2023, before markets opened.

“In the face of ongoing inflation, we are working hard to deliver the value and choice Canadians are looking for. I’m pleased that customers are responding positively to the breadth of our offerings including our diverse store formats, market leading prices, private label brands, and loyalty offers.”

– Chairman and Chief Executive Officer, Galen Weston

Highlights:

  • Revenue was $12,995 million, an increase of $733 million, or 6.0%.
  • Retail segment sales were $12,735 million, an increase of $690 million, or 5.7%.
    • Food Retail (Loblaw) same-stores sales increased by 3.1%, including the negative impact of 1.1% related to the timing of New Year’s Day.
    • Drug Retail (Shoppers Drug Mart) same-store sales increased by 7.4%, with front store same-store sales growth of 10.3% and pharmacy same-store sales growth of 4.7%.
  • E-commerce sales decreased by 1.1%, lapping elevated online sales due to lockdowns last year.
  • Operating income was $769 million, an increase of $31 million, or 4.2%.
  • Adjusted EBITDA(2) was $1,448 million, an increase of $105 million, or 7.8%.
  • Retail segment adjusted gross profit percentage(2) was 31.3%, an increase of 20 basis points.
  • Net earnings available to common shareholders of the Company were $418 million, a decrease of $19 million or 4.3%. Diluted net earnings per common share were $1.29, a decrease of $0.01, or 0.8%. The decrease was primarily driven by a prior year gain related to a favourable Court ruling.
  • Adjusted net earnings available to common shareholders of the Company (2) were $505 million, an increase of $46 million, or 10.0%.
  • Adjusted diluted net earnings per common share(2) were $1.55, an increase of $0.19 or 14.0%.
  • Repurchased for cancellation 3.3 million common shares at a cost of $383 million and invested $208 million in capital expenditures, net of proceeds from property disposals. Free cash flow(2) used in the Retail segment was $81 million.
  • Twelfth consecutive annual increase to the quarterly common share dividend from $0.405 per common share to $0.446 per common share, an increase of 10%.
  • The Company just announced the release of its 2022 Environmental, Social and Governance (“ESG”) Report.

Outlook:

Loblaw will continue to execute on retail excellence while advancing its growth initiatives in 2023. The Company’s businesses remain well placed to service the everyday needs of Canadians. However, the Company cannot predict the precise impacts of global economic uncertainties, including the inflationary environment, on its 2023 financial results.

For the full-year 2023, the Company continues to expect:

  • its Retail business to grow earnings faster than sales;
  • adjusted net earnings per common share growth in the low double digits;
  • to increase investments in our store network and distribution centres by investing a net amount of $1.6 billion in capital expenditures, which reflects gross capital investments of approximately $2.1 billion offset by approximately $500 million of proceeds from real estate dispositions; and
  • to return capital to shareholders by allocating a significant portion of free cash flow to share repurchases.

Source: (L-T) Q1-2023 Quarterly Review


Fortis (FTS-T) released its first-quarter fiscal 2023 results on Wednesday, May 3, 2023, before markets opened.

“Our strong first quarter results reflect the diversified nature of our business and the continued delivery of our low-risk capital plan. With capital expenditures of $1.0 billion in the quarter, we are on track to invest $4.3 billion in our systems this year.

Our funding plan remains intact, and the sale of the Aitken Creek Natural Gas Storage Facility further strengthens our balance sheet and supports financing of our regulated utility investments. We remain confident in our growth strategy as we continue to provide value to shareholders while executing on the transition to a cleaner energy future and delivering safe, reliable and affordable service to our customers.”

– President and Chief Executive Officer, David Hutchens

Highlights:

  • First quarter net earnings of $437 million, or $0.90 per common share, up from $350 million, or $0.74 per common share in 2022
  • Adjusted net earnings per common share of $0.91, up from $0.78 in the first quarter of 2022
  • Capital expenditures of $1.0 billion in the first quarter; $4.3 billion annual capital plan on track
  • Significant regulatory applications at Tucson Electric Power and FortisBC continue to progress
  • Announced the sale of the Corporation’s ownership interest in the Aitken Creek Natural Gas Storage Facility in British Columbia

Outlook:

Fortis continues to enhance shareholder value through the execution of its capital plan, the balance and strength of its diversified portfolio of regulated utility businesses, and growth opportunities within and proximate to its service territories. While energy price volatility, global supply chain constraints and persistent inflation are issues of potential concern that continue to evolve, the Corporation does not currently expect there to be a material impact on its operations or financial results in 2023.

Fortis is executing on the transition to a cleaner energy future and is on track to achieve its corporate-wide targets to reduce greenhouse gas emissions (“GHG”) by 50% by 2030 and 75% by 2035. Upon achieving these targets, 99% of the Corporation’s assets will support energy delivery and renewable, carbon-free generation. The Corporation’s additional 2050 net-zero direct GHG emissions target reinforces Fortis’ commitment to further decarbonize over the long-term, while preserving customer reliability and affordability.

The Corporation’s $22.3 billion five-year capital plan is expected to increase midyear rate base from $34.1  billion in 2022 to $46.1 billion by 2027, translating into a five-year compound annual growth rate of 6.2%.

Beyond the five-year capital plan, additional opportunities to expand and extend growth include: further expansion of the electric transmission grid in the U.S. to facilitate the interconnection of cleaner energy, including infrastructure investments associated with the Inflation Reduction Act of 2022 and the MISO LRTP; climate adaptation and grid resiliency investments; renewable gas solutions and liquefied natural gas infrastructure in British Columbia; and the acceleration of cleaner energy infrastructure investments across our jurisdictions.

Fortis expects its long-term growth in rate base will drive earnings that support dividend growth guidance of 4-6% annually through 2027.

Source: (FTS-T) Q1-2023 Quarterly Review


Brookfield Infrastructure Partners (BIP-N) released its first-quarter fiscal 2023 results on Wednesday, May 3, 2023, before markets opened.

“We are pleased to report a strong start to 2023 for Brookfield Infrastructure, with future growth secured from several successful capital deployment initiatives. Our diversified portfolio of high-quality infrastructure assets are well positioned to deliver resilient results during all market conditions.”

– Chief Executive Officer, Sam Pollock

Highlights:

  • FFO of $554 million or $0.72 per unit in the first quarter represents an increase of 12% over the prior year – Organic growth of 9% captures elevated inflation, volume growth across our transport segment, and earnings associated with capital commissioned over the last 12 months – Incremental contribution from our asset rotation program including the privatization of HomeServe on January 4, 2023
  • Distribution of $0.3825 per unit represents an increase of 6% compared to the prior year
  • Payout ratio for the quarter of 68% falls within our long-term 60-70% target range
  • Net income benefited from the contributions associated with recent acquisitions and organic growth across our base business, offset by mark-tomarket losses on commodity contracts and one-time transaction costs associated with the acquisition of HomeServe and the European telecom tower portfolio, which are expensed on acquisition
  • Total assets increased compared to December 31, 2022 as a result of the acquisition of HomeServe and the European telecom tower portfolio, organic growth initiatives, and the impact of foreign exchange

Outlook:

We believe that the long-term positive outlook for the infrastructure sector, in conjunction with our full cycle investment strategy, will allow us to continue to create significant value for our investors. Our strategy is grounded in a deep understanding of the infrastructure sector and the various market forces that drive it. We have made significant progress during the quarter, adding valuable pieces to our long-term growth plans, with two important investments: the agreement to acquire Data4 and the planned Triton privatization. Both investments are expected to generate strong cash flow for our unitholders. We also believe that our ability to look through near-term headlines and overreactions to invest in high quality businesses that have long-term growth potential will differentiate us during this current market cycle.

Our priorities for the balance of the year will be the integration of our recently secured investments and the execution of our current capital recycling program. We are also focused on continuing to deliver excellent financial results, which are expected to benefit from the full run-rate contribution of our new Heartland Petrochemical Complex, commissioning of new projects from our capital backlog and the closing of the Data4 and Triton acquisitions.

Source: (BIP-N) Q1-2023 Quarterly Review


Bell Canada (BCE-T) released its first-quarter fiscal 2023 results on Thursday, May 4, 2023, before markets opened.

“Bell has delivered a solid start to the year with results that were on plan and that reflect our consistently strong execution.

Overall, our performance in wireless and Internet helped to drive strong 3.5% consolidated revenue growth, offsetting the impacts of an advertising slowdown within our Bell Media segment. Our mobile phone postpaid net subscriber activations were up 26.5%, with 5.4% higher wireless service revenue. We also added nearly 48,000 new FTTH customers in Q1, up 24% over last year, with consumer Internet revenue up 10%.

 In line with our broadband network buildout plan, we invested close to $1.1 billion in capital expenditures in Q1 and remain on pace to expand our fibre footprint by 650,000 locations and cover 85% of the population with our 5G service by the end of 2023. While we’re currently experiencing an uncertain economic environment amid headwinds, inflationary cost pressures and regulatory uncertainty, we remain committed to our corporate purpose to advance how 2/17 Canadians connect with each other and the world. As we look ahead to the remainder of 2023, we are confident in our ability to continue delivering results with consistent, strong execution.”

– President and Chief Executive Officer, Mirko Bibic

Highlights:

  • BCE operating revenue increased 3.5% over Q1 2022 to $6,054 million. This was the result of 0.9% higher service revenue of $5,222 million and a 23.6% increase in product revenue to $832 million, driven by growth at Bell Communication and Technology Services (Bell CTS), partly offset by a year-over-year decline at Bell Media.
  • Net earnings decreased 15.6% to $788 million and net earnings attributable to common shareholders totalled $725 million, or $0.79 per share, down 17.3% and 17.7% respectively. The year-over-year declines were due to increased interest expense, higher depreciation and amortization expense, lower adjusted EBITDA, higher severance, acquisition and other costs and higher asset impairment charges related to office spaces we ceased using as part of our real estate optimization strategy due to Bell’s hybrid work policy. These factors were partly offset by lower income taxes and higher other income which included gains from the sale of land related to our real estate optimization strategy. Adjusted net earnings were down 4.8% to $772 million, resulting in a 4.5% decrease in adjusted EPS to $0.85.
  • Adjusted EBITDA was down 1.8% to $2,538 million, reflecting a 36.5% decrease at Bell Media, partly offset by a 1.3% increase at Bell CTS. BCE’s consolidated adjusted EBITDA margin13 declined 2.3 percentage points to 41.9% from 44.2% in Q1 2022, due to lower year-over-year media revenue attributable mainly to a favourable one-time retroactive adjustment to subscriber revenue in Q1 2022 related to a contract with a Canadian TV distributor, higher low-margin product sales, as well as operating cost pressures related to inflation, strategic initiatives, higher TV content costs and the normalization of our cost structure to pre-COVID levels.
  • BCE capital expenditures were $1,086 million, up 13.2% from $959 million last year, corresponding to a capital intensity 14 of 17.9%, compared to 16.4% in Q1 2022. The year over-year increase in capital spending was due mainly to significant ongoing investment in expanding Bell’s pure fibre network, including connecting more homes and businesses to Bell Internet services.
  • BCE cash flows from operating activities were $1,247 million, down 27.3% from Q1 2022, reflecting lower cash from working capital attributable to the timing of supplier payments, higher interest paid, increased cash taxes due mainly to the timing of instalment payments and lower adjusted EBITDA, partly offset by lower contributions to post-employment benefit plans.
  • Free cash flow decreased 88.1% to $85 million from $716 million in Q1 2022, due to lower cash flows from operating activities excluding acquisition and other costs paid, and higher capital expenditures.

Outlook:

Source: (BCE-T) Q1-2023 Quarterly Review


Telus (T-T) released its first-quarter fiscal 2023 results on Thursday, May 4, 2023, before markets opened.

“In the first quarter, our TELUS team once again demonstrated our hallmark execution excellence, characterized by the potent combination of leading customer growth and strong financial results. Our robust performance is underpinned by our globally leading broadband networks and customer-centric culture, which enabled our strongest first quarter on record, with total customer net additions of 163,000, up 10 per cent, year-over-year. This included strong mobile phone net additions of 47,000, our best first quarter result since 2010; healthy connected device net additions of 58,000; and record first quarter total fixed net additions of 58,000, inclusive of reaching our one millionth security subscriber. Our leading customer growth is reflective of our consistent, industry-best client loyalty across our mobile and fixed product lines.”

– President and Chief Executive Officer, Darren Entwistle

Highlights:

  • Total Mobile and Fixed customer growth of 163,000, up 15,000 over last year, and our strongest first quarter on record, driven by strong demand for our leading portfolio across Mobility and Fixed services
  • Strong Mobile Phone net additions of 47,000, our best first quarter since 2010, and robust Connected Device net additions of 58,000; industry-leading postpaid churn of 0.70 per cent and Mobile Phone ARPU growth of 3.8 per cent
  • Record first quarter Fixed customer net additions of 58,000, including 35,000 internet customer additions, powered by industry-leading customer loyalty, with blended PureFibre churn below 1 per cent, in combination with TELUS’ PureFibre network; achieved one million security customer milestone
  • Strong quarterly financial results including Consolidated Operating Revenue and Adjusted EBITDA growth of 16 per cent and 11 per cent, respectively, and double digit Free Cash Flow growth of 29 per cent; Net Income lower by 45 per cent on higher interest, depreciation and amortization, and restructuring and other costs
  • Quarterly dividend raised to $0.3636, an increase of 7.4 per cent over the same period last year and our twenty-fourth increase since May 2011, representing a yield of approximately 5 per cent, supported by leading Adjusted EBITDA growth and strong cash flow expansion

Outlook:

Reiterating our 2023 Consolidated Financial Targets including Operating Revenue and Adjusted EBITDA growth of 11 to 14 per cent and 9.5 to 11 per cent, respectively, Capital Expenditures of approximately $2.6 billion and Free Cash Flow of approximately $2.0 billion.

Source: (T-T) Q1-2023 Quarterly Review


Enbridge Inc. (ENB-T) released its first-quarter fiscal 2023 results on Friday, May 5, 2023, before markets opened.

“We are very pleased with a strong start to 2023 and how our low-risk business model continues to deliver in all market cycles. Our first quarter results were right in line with our expectations despite extreme volatility in both financial and commodity markets. Operationally, we continue to be a first-choice service provider to our customers and during the quarter, this resulted in high utilization across our systems and record volumes on the Mainline. Enbridge is very proud of its long history of predictable financial and operational performance. For 17 consecutive years, shareholders have benefited from our ability to consistently meet financial guidance and we have delivered 28 consecutive annual dividend increases.”

– President and Chief Executive Officer, Greg Ebel

Highlights:

  • Debt to EBITDA of 4.6×1, mid-point of the target range
  • BBB+ credit ratings reaffirmed by all agencies
  • Settlement in principle reached on Mainline
  • Acquired Tres Palacios & Signed agreement to acquire Aitken Creek Gas Storage
  • Signed LOI to advance Blue Ammonia export facility at EIEC
  • Announced successful bid to design, build and operate Normandy OSW
  • High utilization across our systems
  • Strong operational performance in the quarter
  • Continued strong reliability and personnel
  • ESG update with audited 2022 statistics
  • 27% reduction in emissions intensity since 2018

Outlook:

Strong Q1 performance – on track to meet full-year guidance

Source: (ENB-T) Q1-2023 Quarterly Review


Magna (MGA-N) released its first-quarter fiscal 2023 results on Friday, May 5, 2023, before markets opened.

“Our strong first quarter operating performance reflects strong earnings on higher organic sales. More importantly, we are taking targeted actions to reduce expenses and optimize our cost structure. Our increased outlook is based on the strength of our first quarter results and the expected benefit of these targeted actions. We are highly focused on executing our strategy and remain confident in our ability to meet our long-term growth and margin outlook.”

 – President and Chief Executive Officer, Swamy Kotagiri

Highlights:

  • Sales increased 11% to $10.7 billion, compared to a global light vehicle production that rose 3%
  • Diluted earnings per share and Adjusted diluted earnings per share were $0.73 and $1.11, respectively
  • Paid dividends of $132 million
  • Raised Adjusted EBIT Margin Outlook range to 4.7%-5.1% from 4.1%-5.1%

We buy quality individual dividend growth stocks when they are sensibly priced and hold for the growing income.