“You have a pair of pants. In the left pocket, you have $100. You take $1 out of the left pocket and put in the right pocket. You now have $101. There is no diminution of dollars in your left pocket. That is one magic pair of pants.”

MP Market Review – October 27, 2023

Last updated by BM on October 30, 2023

Summary 

  • This is a weekly installment of our MP Market Review series, which provides updates on the financial markets and Canadian dividend growth companies we monitor on ‘The List’.
  • Last week, ‘The List’ was down with a YTD price return of -5.0% (capital). Dividend growth was up and is now at +8.8% YTD, highlighting growth in income over the past year.
  • Last week, two dividend increases from companies on ‘The List’.
  • Last week, five earnings reports from companies on ‘The List’.
  • Five companies on ‘The List’ are due to report earnings this week.
  • If you’re interested in creating your own dividend growth income portfolio, consider subscribing to our premium service, which grants you access to the MP Wealth-Builder Model Portfolio (CDN) and exclusive subscriber-only content.  Learn More         

Identifying companies whose dividend growth aligns closely with price growth can considerably enhance the predictability of future returns. Dividend growth investors know that the dividend drives the price in a predictable way, not the other way around. Fortis Inc. (FTS-T) is another company on ‘The List’ that aligns very closely with this dividend growth vs price growth pattern we like to see.

Introduction

“You have a pair of pants. In the left pocket, you have $100. You take $1 out of the left pocket and put it in the right pocket. You now have $101. There is no diminution of dollars in your left pocket. That is one magic pair of pants.”

This ‘magic pants’ analogy was from a Seeking Alpha article on dividend investing I read about a decade ago and was one of the catalysts for me to take a closer look at this type of investing and see if it truly was magical. 

After conducting additional research, I have shifted towards utilizing a dividend growth investing (DGI) strategy as my primary investment approach. While I maintain portfolios consisting of high-quality dividend growers from both the United States and Canada, I have opted to concentrate on Canadian (CDN) dividend growth companies in this blog. This is due to several reasons, including a smaller pool of DGI companies to track, a lack of coverage for the DGI strategy by the North American investment media, and a tendency for those who do cover DGI to narrowly focus on only a handful of sectors (Energy and Financials).

While ‘The List’ is not a portfolio in itself, it serves as an excellent initial reference for individuals seeking to diversify their investments and attain higher returns in the Canadian stock market. Through our blog, we provide weekly updates on ‘The List’ and offer valuable perspectives and real-life examples of the dividend growth investing strategy in practice. This helps readers gain a deeper understanding of how to implement and benefit from this investment approach.


DGI Clipboard

“Dividend growth investing is a long-term strategy that takes the fear out of bear markets. It’s about the income, not the fluctuations.”

 – Charles Schwab

Accelerate Your Wealth-Building in Bear Markets!

Many stocks, especially those offering increasing dividends, have experienced declines due to fear and uncertainty, leading to attractive discounts and higher dividend yields. In our opinion, individuals seeking to enhance their passive income through dividends should seize the opportunity presented by this bear market to expedite their wealth-building.

Upon closer examination of ‘The List,’ it becomes evident that the average dividend yield has risen from 3.2% at the beginning of the year to 3.7% now. A higher initial yield enables us to acquire more income from our investment, allowing us to reach our income goals more rapidly.

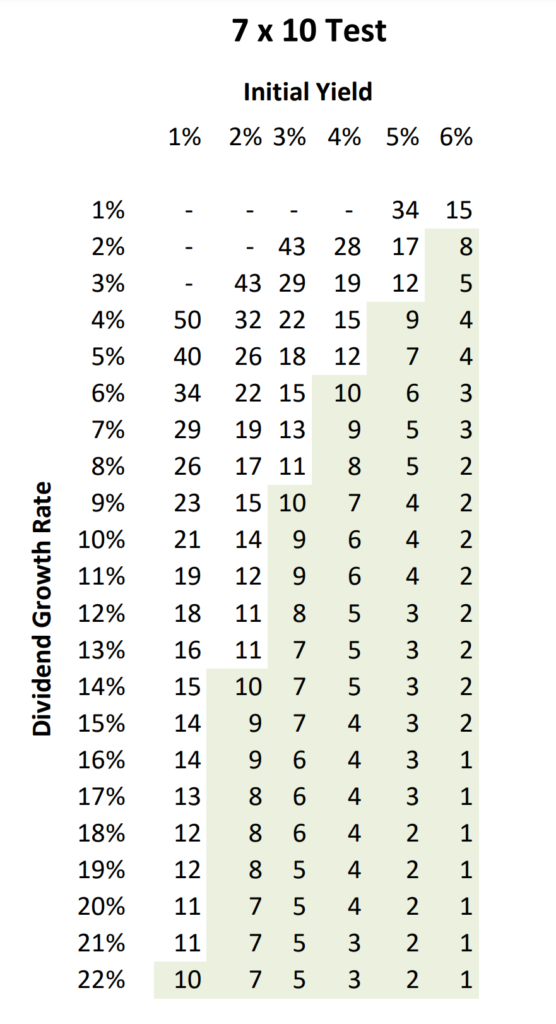
Last week, we discussed the significance of compounding income and how to measure it. We emphasized our preference for a 7% growth yield after ten years as our benchmark. Let’s explore the impact of the starting yield on achieving this goal.

For instance, a stock with an initial yield of 3% and an annualized dividend growth of 9% will take ten years to attain a growth yield of 7%. However, if we increase our starting yield to 4% while maintaining the same 9% dividend growth rate, we will only need seven years to reach our desired 7% growth yield.

Growth Yield is calculated by dividing the current annualized dividend by the original cost basis of the stock.

The starting yield can make a significant difference. Reducing the investment horizon from ten to seven years accelerates our wealth-building process.

If you have not yet joined as a paid subscriber of the blog to receive DGI Alerts on the activity and content related to our model portfolio, it’s not too late. Click Here. 

Recent News 

The (really) long-term benefits of dividend reinvestment (Globe & Mail)

https://www.theglobeandmail.com/investing/education/article-the-really-long-term-benefits-of-dividend-reinvestment/

DGI Truth #4: Dividend re-investment will supercharge your returns

Amazing results from the purchase of 1000 shares in Royal Bank 40 years ago! In this case, the buy and hold strategy netted an annualized return of 8.7%. Reinvest dividends and your annualized return jumps to over 13.0%.  Dividend re-investment accelerates your wealth-building.

Analysts remain bullish on Brookfield Infrastructure Partners. But there’s a catch (Globe & Mail)

https://www.theglobeandmail.com/investing/markets/inside-the-market/article-analysts-remain-bullish-on-brookfield-infrastructure-partners-but/

“With the business continuing to perform well, we are of the view investors are being presented with an outstanding buying opportunity here,” Frederic Bastien, an analyst at Raymond James, said in a Oct. 17 note.

When a stock falls this far this fast we usually put the brakes on and try to figure out why. It will be interesting to hear what management has to say in their upcoming Q3 earnings report.
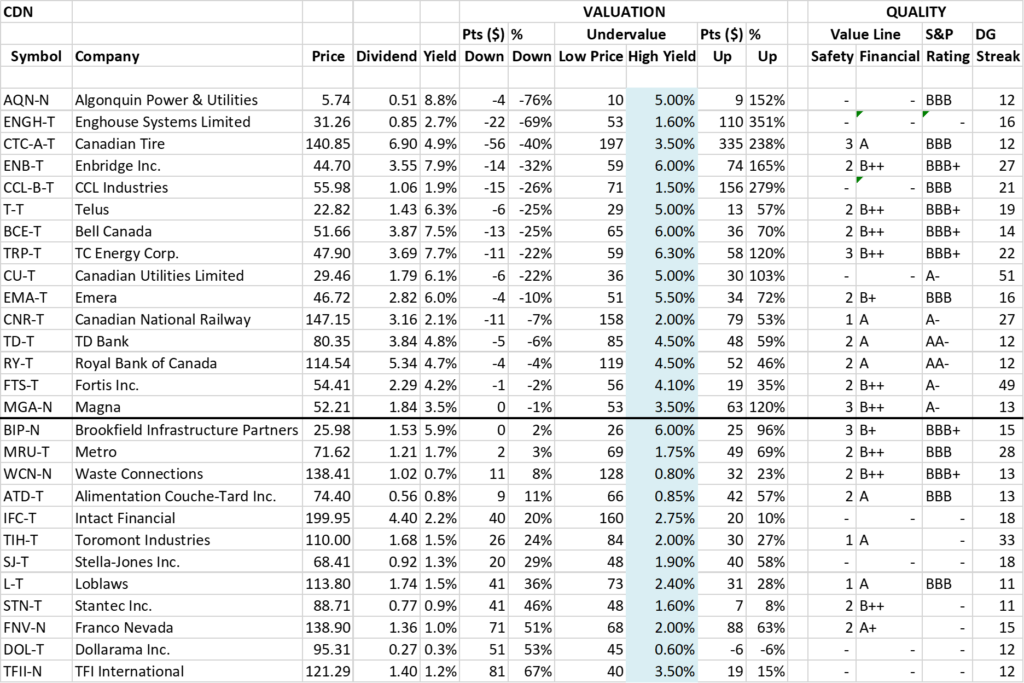
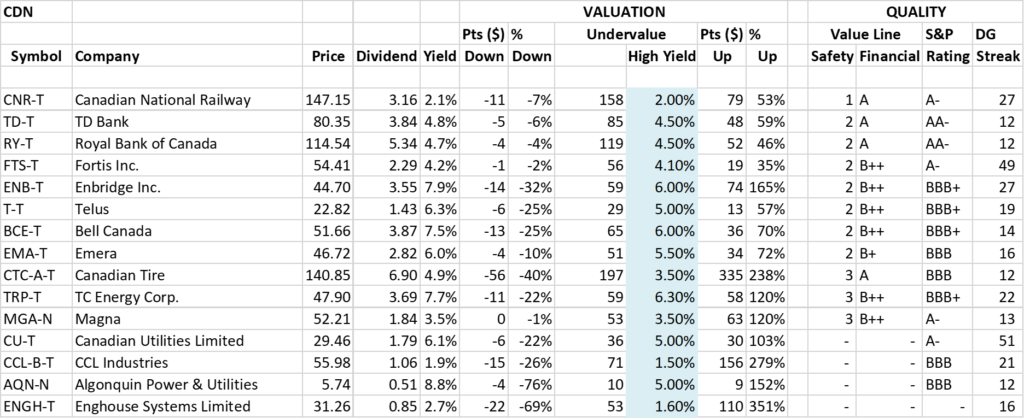
The List (2023)

Last updated by BM on October 27, 2023

The Magic Pants List contains 27 Canadian dividend growth stocks. ‘The List’ contains Canadian companies that have raised their dividend yearly for at least the last ten years and have a market cap of over a billion dollars. Below is each stock’s symbol, name, current yield, current price, price return year-to-date, current dividend, dividend growth year-to-date and current dividend growth streak. Companies on ‘The List’ are added or subtracted once a year, on January 1. After that, ‘The List’ is set for the next twelve months. Prices and dividends are updated weekly.

SYMBOL COMPANY YLD PRICE YTD % DIV YTD % STREAK
AQN-N Algonquin Power & Utilities 10.1% $5.03 -25.3% $0.51 -29.0% 12
ATD-T Alimentation Couche-Tard Inc. 0.8% $72.86 21.2% $0.56 19.1% 13
BCE-T Bell Canada 7.6% $50.83 -15.6% $3.87 5.2% 14
BIP-N Brookfield Infrastructure Partners 4.4% $21.39 -31.7% $1.44 6.3% 15
CCL-B-T CCL Industries 2.0% $53.89 -7.2% $1.06 10.4% 21
CNR-T Canadian National Railway 2.2% $145.05 -10.9% $3.16 7.8% 27
CTC-A-T Canadian Tire 5.1% $136.08 -7.2% $6.90 17.9% 12
CU-T Canadian Utilities Limited 6.2% $29.05 -21.4% $1.79 1.0% 51
DOL-T Dollarama Inc. 0.3% $94.15 17.9% $0.27 23.8% 12
EMA-T Emera 6.1% $45.93 -12.7% $2.82 5.0% 16
ENB-T Enbridge Inc. 8.1% $43.57 -18.3% $3.55 3.2% 27
ENGH-T Enghouse Systems Limited 2.7% $31.86 -10.8% $0.85 18.2% 16
FNV-N Franco Nevada 1.0% $137.47 -0.5% $1.36 6.3% 15
FTS-T Fortis Inc. 4.2% $54.99 -0.6% $2.29 5.3% 49
IFC-T Intact Financial 2.3% $189.34 -3.3% $4.40 10.0% 18
L-T Loblaws 1.6% $110.61 -8.1% $1.74 13.2% 11
MGA-N Magna 3.9% $47.65 -17.2% $1.84 2.2% 13
MRU-T Metro 1.8% $68.74 -8.9% $1.21 10.0% 28
RY-T Royal Bank of Canada 4.9% $108.47 -15.3% $5.34 7.7% 12
SJ-T Stella-Jones Inc. 1.3% $71.67 44.6% $0.92 15.0% 18
STN-T Stantec Inc. 0.9% $83.16 27.3% $0.77 8.5% 11
TD-T TD Bank 5.0% $76.16 -13.1% $3.84 7.9% 12
TFII-N TFI International 1.3% $107.53 7.4% $1.40 29.6% 12
TIH-T Toromont Industries 1.6% $102.71 5.1% $1.68 10.5% 33
TRP-T TC Energy Corp. 7.9% $46.95 -11.9% $3.69 3.4% 22
T-T Telus Corp. 6.5% $22.01 -16.4% $1.43 7.4% 19
WCN-N Waste Connections 0.8% $128.04 -2.8% $1.05 10.5% 13
Averages 3.7% -5.0% 8.8% 19

Six Canadian stocks on ‘The List’ declare earnings and dividends in US dollars and are inter-listed on a US exchange in US dollars. The simplest way to display dividend and price metrics for these stocks is to show their US exchange symbols along with their US dividends and price. The stocks I am referring to have a -N at the end of their symbols. You can still buy their Canadian counterparts (-T), but your dividends will be converted into CDN dollars and will fluctuate based on the exchange rate.

Note: When the dividend and share price currency match, the calculation is straightforward. But it’s not so simple when the dividend is declared in one currency, and the share price is quoted in another. Dividing the former by the latter would produce a meaningless result because it’s a case of apples and oranges. To calculate the yield properly, you must express the dividend and share price in the same currency.

Performance of ‘The List’

Feel free to click on this link, ‘The List’ for a sortable version from our website.

Last week, ‘The List’ was down with a YTD price return of -5.0% (capital). Dividend growth was up and is now at +8.8% YTD, highlighting growth in income over the past year.

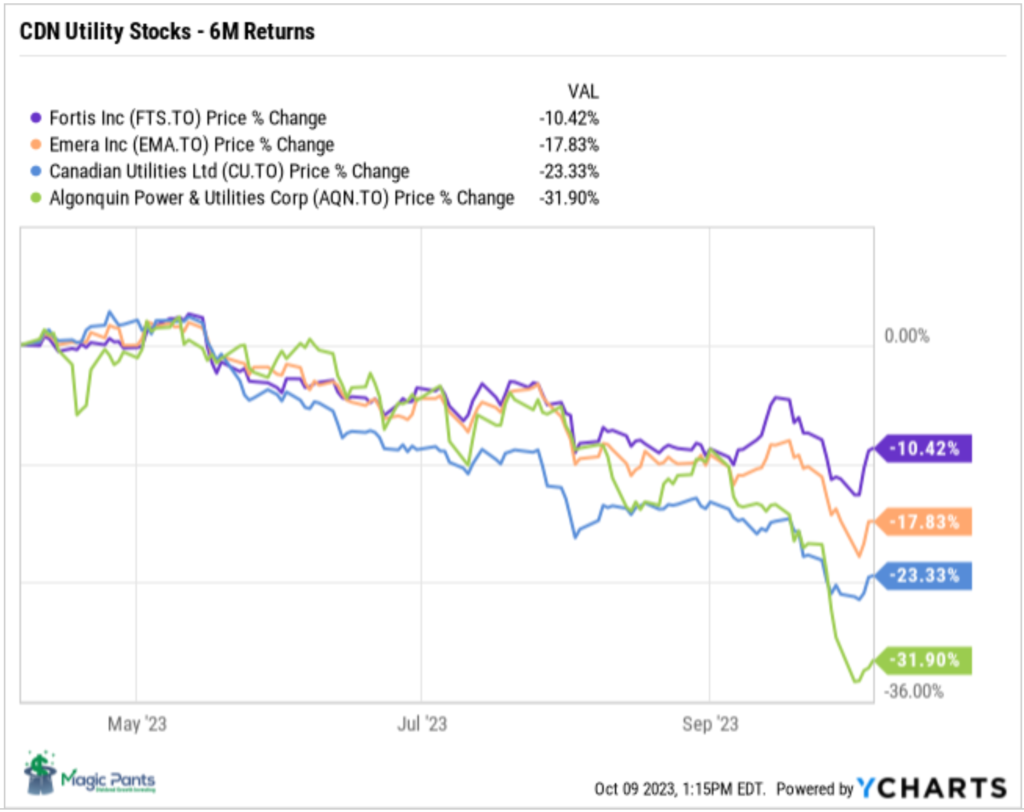
The best performers last week on ‘The List’ were Emera (EMA-T), up +3.68%; Fortis Inc. (FTS-T), up +2.71%; and TC Energy Corp. (TRP-T), up +0.95%.

TFI International (TFII-N) was the worst performer last week, down -9.30%.


Dividend Increases

“The growth of dividend paying ability is of significance in the determination of a stock’s quality, or general safety…”

– Arnold Bernhard (the founder of Value Line)

“As a dividend increase is a positive sign of a company’s financial strength, the safest purchase, after research, is a stock with a recent dividend increase.”

– Tom Connolly (the founder of dividendgrowth.ca)

Two companies on ‘The List’ announced a dividend increase last week.

TFI International (TFII-N)) on Monday said it increased its 2024 quarterly dividend from $0.35 to $0.40 per share, payable January 13, 2024, to shareholders of record on December 29, 2023.

This represents a dividend increase of +14.0%, marking the 13th straight year of dividend growth for this quality transportation and logistics company.

Waste Connections (WCN-N) on Wednesday said it increased its 2023 quarterly dividend from $0.255 to $0.285 per share, payable November 28, 2023, to shareholders of record on November 8, 2023.

This represents a dividend increase of +11.8%, marking the 14th straight year of dividend growth for this quality solid waste and recycling services company.


Earnings Releases

Benjamin Graham once remarked that earnings are the principal factor driving stock prices.

Each quarter, we will provide readers with weekly earnings updates of stocks on ‘The List’ during the calendar earnings season. 

The updated earnings calendar can be found here.

Earnings growth and dividend growth tend to go hand in hand, so this information can tell us a lot about the future dividend growth of our quality companies. Monitoring our dividend growers periodically is part of the process, and reading the quarterly earnings releases is a good place to start.

Five earnings reports from companies on ‘The List’ this week

Toromont Industries (TIH-T) will release its third-quarter fiscal 2023 results on Monday, October 30, 2023, after markets close.

Bell Canada (BCE-T) will release its third-quarter fiscal 2023 results on Thursday, November 2, 2023, before markets open.

Telus (T-T) will release its third-quarter fiscal 2023 results on Friday, November 3, 2023, before markets open.

Enbridge Inc. (ENB-T) will release its third-quarter fiscal 2023 results on Friday, November 3, 2023, before markets open.

Magna (MGA-N) will release its third-quarter fiscal 2023 results on Friday, November 3, 2023, before markets open.

Last week, five earnings reports from companies on ‘The List’.

TFI International (TFII-N) released its third-quarter fiscal 2023 results on Monday, October 23, 2023, after markets closed.

“We executed well during this stretch of weaker demand as our team was able to quickly adapt to changing market conditions while further streamlining operations. As a result, we were able to post solid results including close to $280 million of net cash from operating activities. Looking ahead, we’re well positioned to capitalize on the eventual pick-up in demand given our efficient platform, our team’s focus on profitability and cash flow, and our solid financial foundation, which further benefitted from our post-quarter, half billion dollar private placement. It’s this foundation that allows us to strategically allocate capital including eleven acquisitions this year, along with our share repurchases and our Board’s recently approved dividend increase.”

– Alain Bedard, President and Chief Executive Officer

Highlights:

  • Third quarter operating income of $200.6 million compares to $318.4 million the same quarter last year, reflecting reduced freight volumes and non-recurring costs, including the prior year divestiture of CFI and the related gain, $5.6 million and $75.7 million, respectively, $5.5 million of IT systems and related transition expenses in U.S. LTL, a $4.7 million expense for the MTM of director share units, and $2.9 million unfavorable currency translation impact1 relative to the same period last year.
  • Third quarter net income of $133.3 million compared to $245.2 million in Q3 2022, while adjusted net income1 of $136.0 million compared to $181.2 million as a result of the items described above.
  • Third quarter diluted earnings per share (diluted “EPS”) of $1.54 compared to $2.72 in Q3 2022, while adjusted diluted EPS1 of $1.57 compared to $2.01.
  • Third quarter net cash from operating activities of $278.7 million compares to $337.8 million in Q3 2022 and free cash flow1 of $198.3 million compares to $292.1 million in Q3 2022.
  • The Board of Directors approved a $0.40 quarterly dividend, an increase of 14%.

Outlook:

We are reaffirming our 2023 EPS guidance provided in July of a range of $6 to $6.50. We’re also maintaining our full-year free cash flow outlook at $700 million to $800 million, including CapEx of $200 million to $225 million. In addition, we have already exceeded a combined total of $500 million this year of capital deployed in M&A and share repurchase given our very strong financial position.

Source: (TFII-N) Q3-2023 Quarterly Review


Canadian National Railway (CNR-T) released its third-quarter fiscal 2023 results on Tuesday, October 24, 2023, after markets closed.

“Our ‘Make the Plan, Run the Plan, Sell the Plan’ approach continued to perform well, delivering strong customer service despite weak consumer demand as well as external challenges. As volumes continue to improve, we are well positioned to deliver incremental operating leverage. We remain confident in our ability to accelerate sustainable, profitable growth in 2024 through 2026.”

– Tracy Robinson, President and Chief Executive Officer

Highlights:

  • Revenues of C$3,987 million for the third quarter of 2023, a decrease of C$526 million, or 12%, and C$12,357 million for the first nine months of 2023, a decrease of C$208 million, or 2%.
  • Operating income of C$1,517 million for the third quarter of 2023, a decrease of C$415 million, or 21% and C$4,779 million for the first nine months of 2023, a decrease of C$149 million, or 3%.
  • Operating ratio, defined as operating expenses as a percentage of revenues, of 62.0% for the third quarter of 2023, an increase of 4.8-points and 61.3% for the first nine months of 2023, an increase 0.5-points or an increase of 0.7- points on an adjusted basis.
  • Diluted earnings per share (EPS) of C$1.69 for the third quarter of 2023, a decrease of 21% and C$5.27 for the first nine months of 2023, a decrease of 1% or a decrease of 2% on an adjusted basis.
  • Free cash flow was C$581 million for the third quarter of 2023, a decrease of C$775 million, or 57% and C$2,274 million for the first nine months of 2023, a decrease of C$650 million, or 22%.

Outlook:

CN continues to expect flat to slightly negative year-over-year growth in adjusted diluted EPS in 2023. CN reiterates its longer-term financial perspective and continues to target compounded annual diluted EPS growth in the range of 10%-15% over the 2024-2026 period driven by growing volumes more than the economy, pricing above rail inflation and incrementally improving efficiency, all of which assumes a supportive economy.

Source: (CNR-T) Q2-2023 Quarterly Review

Waste Connections (WCN-N) released its third-quarter fiscal 2023 results on Wednesday, October 25, 2023, after markets closed.

“We are extremely pleased by the durability of our financial and operating results in the quarter, with momentum for continued outsized margin expansion.  Solid operational execution enabled us to deliver adjusted EBITDA(b) margin of 32.5% in the third quarter, as expected, up 140 basis points sequentially and up 120 basis points year over year, in spite of over $15 million in unforeseen headwinds.  During the quarter, we overcame elevated levels of risk-related expenses and other lagging effects of higher employee turnover in prior periods, as well as site-specific incremental operating expenses at one of our landfills in California. The expected Q4 and ongoing expanding impacts from that evolving landfill situation are currently being evaluated, along with a recent shorter-term development at a landfill in Texas, and as such weren’t anticipated in the full year outlook we provided in August. We expect to get more clarity going forward but currently estimate the range of outcomes in Q4 to include impacts of up to $20 million to revenue, adjusted EBITDA and adjusted free cash flow.”

– Ronald J. Mittelstaedt, President and Chief Executive Officer

Highlights:

  • Revenue of $2.065 billion, up 9.8% year over year
  • Net income of $229.0 million, and adjusted EBITDA of $671.2 million, up 14.1% year over year
  • Adjusted EBITDA margin of 32.5% of revenue, up 120 basis points year over year and up 140 basis points sequentially from Q2 – Net income of $0.89 per share, and adjusted net income of $1.17 per share
  • Year to date net cash provided by operating activities of $1.571 billion and adjusted free cash flow of $969.3 million
  • Acquisition activity expected to continue through year-end, with an estimated rollover contribution in 2024 of almost 2% from approximately $250 million in annualized revenues signed or closed to date in 2023

Outlook:

We remain encouraged by the pace of improvement in employee retention, which, along with our differentiated strategy and execution, should provide for above average underlying margin expansion in solid waste collection, transfer and disposal in 2024. On that basis, we should be positioned for high single-digit adjusted EBITDA growth in 2024 on expected mid to high single-digit revenue growth, including approximately $150 million of revenue carryover from acquisitions signed or closed year to date, with upside potential from additional acquisition activity and any further improvement in commodity related activity

Source: (WCN-N) Q3-2023 Quarterly Review


Canadian Utilities Limited (CU-T) released its third-quarter fiscal 2023 results on Thursday, October 26, 2023, before markets opened.

“As you know, we concluded a successful second cycle performance based regulation in our Alberta distribution utilities in 2022. 2023 is a single cost of service rebasing year and in 2024 we will start the third cycle of performance based regulation with final rebased rates.

Performance-based regulation facilitates affordability, which is important to the long term sustainability of the business, as the savings and efficiencies generated in the second PBR cycle are returned to customers through the rebasing process. As expected the impact of our Alberta distribution utilities rebasing resulted in lower year-over-year earnings in the third quarter. On its own, this rebasing contributed to a year-over-year decline in earnings of approximately $70 [ph] million. This is a significant impact to 2023 earnings.”

– Brian Shkrobot, Executive Vice President and Chief Financial Officer

Highlights:

  • Canadian Utilities Limited (Canadian Utilities or the Company) today announced third quarter 2023 adjusted earnings of $87 million ($0.32 per share), $33 million ($0.13 per share) lower compared to $120 million ($0.45 per share) in the third quarter of 2022.
  • Announced a partnership agreement between the Chiniki and Goodstoney First Nations for the Deerfoot and Barlow Solar power projects, the largest solar installation in an urban centre in Western Canada. Under the terms of the agreement, the Chiniki and Goodstoney First Nations have become the majority
  • Entered into a 12.5-year virtual power purchase agreement with Lafarge, an industry leader in sustainable building solutions, in September 2023. Under the terms of the agreement, Lafarge’s Exshaw cement plant will notionally purchase 100 per cent of the solar power generated from the 38.5-MW Empress solar project. wners with a 51 per cent ownership stake in the facilities.
  • Received the Alberta Utilities Commission (AUC) decisions with respect to the parameters of the third generation of performance-based regulation (PBR3) and the future Generic Cost of Capital parameters, on October 4, 2023 and October 9, 2023, respectively. We will begin to operate under these new frameworks in 2024. The receipt of both of these critical regulatory decisions in advance of the respective operating years reinforces the strides we’ve seen in reducing regulatory lag.
  • In October 2023, the South Australian Government announced an Early Contractor Involvement (ECI) agreement with ATCO Australia and our joint venture partner BOC Linde for the South Australian Hydrogen Jobs Plan project, a 250-MW Hydrogen production facility, a 200-MW Hydrogen-fuelled electricity generation facility and a Hydrogen storage facility. Activities under this agreement include developing a contract offer price, and negotiation of engineering, procurement, construction and O&M contracts for delivery and operations of the project. The ECI phase of the project is due for completion in the second quarter of 2024.
  • Appointed John Ivulich to Chief Executive Officer & Country Chair of ATCO Australia, our regulated gas utility and non-regulated renewables, power, and clean fuels businesses in Australia, effective October 1, 2023.
  • Incurred $330 million in capital expenditures in the third quarter of 2023, of which 88 per cent was invested in ATCO Energy Systems and 12 per cent mainly in ATCO EnPower.

Source: (CU-T) Q3-2023 Quarterly Review

Fortis Inc. (FTS-T) released its third-quarter fiscal 2023 results on Friday, October 27, 2023, before markets opened.

“The fundamentals of our North American regulated energy delivery businesses remain resilient despite volatility in the macroenvironment in which we operate. We have delivered strong results for the third quarter, driven by the continued execution of our annual capital plan and the completion of key regulatory proceedings in Arizona and British Columbia.”

– David Hutchens, President and Chief Executive Officer

Highlights:

  • Third quarter net earnings of $394 million or $0.81 per common share, up from $326 million or $0.68 per common share in 2022
  • Adjusted net earnings per common share of $0.84, up from $0.71 in the third quarter of 2022
  • Released 2024-2028 capital plan of $25 billion, representing 6.3% average annualized rate base growth
  • Capital expenditures of $3.0 billion through September; $4.3 billion annual capital plan on track
  • Key regulatory decisions received in Western Canada and Arizona

Outlook:

Fortis continues to enhance shareholder value through the execution of its capital plan, the balance and strength of its diversified portfolio of regulated utility businesses, and growth opportunities within and proximate to its service territories. While energy price volatility, global supply chain constraints, increasing interest rates and inflation represent potential concerns, the Corporation does not expect these factors to have a material impact on its operations or financial results in 2023.

The Corporation’s $25 billion five-year capital plan is expected to increase midyear rate base from $36.8 billion in 2023 to $49.4 billion by 2028, translating into a five-year compound annual growth rate of 6.3%7 .

Beyond the five-year capital plan, additional opportunities to expand and extend growth include: further expansion of the electric transmission grid in the U.S. to facilitate the interconnection of cleaner energy, including infrastructure investments associated with the Inflation Reduction Act of 2022 and the MISO LRTP; climate adaptation and grid resiliency investments; renewable gas solutions and liquefied natural gas infrastructure in British Columbia; and the acceleration of cleaner energy infrastructure investments across our jurisdictions.

Fortis expects its long-term growth in rate base will drive earnings that support dividend growth guidance of 4-6% annually through 2028.

Source: (FTS-T) Q3-2023 Quarterly Review

MP Market Review – October 20, 2023

Last updated by BM on October 23, 2023

Summary 

  • This is a weekly installment of our MP Market Review series, which provides updates on the financial markets and Canadian dividend growth companies we monitor on ‘The List’.
  • Last week, ‘The List’ was down with a YTD price return of -3.4% (capital). Dividend growth is at +8.6% YTD, highlighting growth in income over the past year.
  • Last week, no dividend increases from companies on ‘The List’.
  • Last week, no earnings reports from companies on ‘The List’.
  • Five companies on ‘The List’ are due to report earnings this week.
  • If you’re interested in creating your own dividend growth income portfolio, consider subscribing to our premium service, which grants you access to the MP Wealth-Builder Model Portfolio (CDN) and exclusive subscriber-only content.  Learn More         

Identifying companies whose dividend growth aligns closely with price growth can considerably enhance the predictability of future returns. Dividend growth investors know that the dividend drives the price in a predictable way, not the other way around. Fortis Inc. (FTS-T) is another company on ‘The List’ that aligns very closely with this dividend growth vs price growth pattern we like to see.

Introduction

“You have a pair of pants. In the left pocket, you have $100. You take $1 out of the left pocket and put it in the right pocket. You now have $101. There is no diminution of dollars in your left pocket. That is one magic pair of pants.”

This ‘magic pants’ analogy was from a Seeking Alpha article on dividend investing I read about a decade ago and was one of the catalysts for me to take a closer look at this type of investing and see if it truly was magical. 

After conducting additional research, I have shifted towards utilizing a dividend growth investing (DGI) strategy as my primary investment approach. While I maintain portfolios consisting of high-quality dividend growers from both the United States and Canada, I have opted to concentrate on Canadian (CDN) dividend growth companies in this blog. This is due to several reasons, including a smaller pool of DGI companies to track, a lack of coverage for the DGI strategy by the North American investment media, and a tendency for those who do cover DGI to narrowly focus on only a handful of sectors (Energy and Financials).

While ‘The List’ is not a portfolio in itself, it serves as an excellent initial reference for individuals seeking to diversify their investments and attain higher returns in the Canadian stock market. Through our blog, we provide weekly updates on ‘The List’ and offer valuable perspectives and real-life examples of the dividend growth investing strategy in practice. This helps readers gain a deeper understanding of how to implement and benefit from this investment approach.


DGI Thoughts

“Dividend growth is the hidden magic in plain sight. We hold because after ten years, our yield is at least 5%, on average 7% and often about 10%.”

-Tom Connolly

Growth Yield (formerly known as Yield on Cost)

When you’re dealing with investments, the first thing you should do is decide on a clear goal. After that, you need to check how you’re doing to make sure you’re getting closer to your goal. Many investors usually look at how much money they’ve made each year and compare it to a benchmark. As dividend growth investors we focus on our income and need only one metric to measure how we are doing, and it is called “Yield on Cost” or YOC. It’s a way to see how much money you’re getting from your investment compared to how much you originally spent on it.

Some argue that the only yield that truly matters is the current one. Yield on Cost has faced criticism for not reflecting the current stock yield. While we agree in principle that YOC may not be the best metric for valuing a company at its present state, we still find it highly valuable for assessing the quality of the companies we invest in and for tracking their historical and projected performance over time.

We appreciate the perspective shared by Tom Connolly (dividendgrowth.ca) in addressing YOC and the concerns associated with it in this quote from his blog:

“Some people who do not ‘believe’ in YOC argue that what happened ten or 15 years ago is not always a good indicator of the future. That’s true. I’m not saying that YOC is a good indicator of the future. However, if the dividend has grown since purchase, YOC is a good indicator the company is doing well. If a company has a ‘culture’ of increasing its dividend the pattern could easily continue. If folks are not using YOC to measure because it is rooted in the past, how do they measure their returns? Do they not use a past-connected number also? Growing yield is the essence of what the dividend growth strategy is about. Growing yield drives returns. If the yield does not grow, essentially, you have a bond.”

Chuck Carnevale, another mentor, proposes rebranding the YOC metric as growth yield—a term we also find more attractive. This terminology not only emphasizes the initial yield but also underscores the compounding growth of that yield. A straightforward name change could potentially alleviate the reservations of YOC critics, shifting the focus away from the purchase cost and towards the evolving yield, aligning more closely with our approach.

A helpful tool to demonstrate the power of growth yield is a quick test we like to do called the “7% in 10 years” test. If in ten years, our growth yield, without the reinvestment of dividends, is projected to grow to 7% then it is likely that the company has the right mix of initial yield and dividend growth we look for and a candidate for further research.

One of the reasons we use 7% as our numerical goal is that equities have historically provided ~ 7% returns over the last 100 years. To generate a return within a decade equal to the stock market’s historical total return from just the dividend alone demonstrates once again the compounding power of dividend growth investing.

So, how can an investment made today generate a 7% return solely from dividends ten years from now? The answer lies in the growth of the dividend!

Here is a chart we use to determine quickly if the starting yield and dividend growth will get us to our goal.

The table illustrates the combinations of initial yields (across the top) and annual growth rates (down the left side) required to achieve a 7% income return from dividends alone. When two values intersect, the table indicates the number of years it takes to reach a 7% growth yield. If the number of years is 10 or fewer, the combination is feasible, and these cells are shaded.

For instance, a 3% initial yield, growing at a rate of 9% per year, reaches a 7% growth yield in 10 years. The same result can be obtained with a 4% initial yield growing at 6% annually. Both combinations are viable.

It’s important to note that the 7×10 table focuses exclusively on income and does not take into account the impact of price increases. Additionally, it does not consider the compounding effect of reinvesting dividends, which would reduce the time required to achieve the displayed growth yield increase. The table solely reflects the growth in yield on cost resulting from the dividend’s own growth.

In our approach to constructing the Magic Pants Wealth-Builder Model Portfolio (CDN), we aim to build a concentrated portfolio of quality companies across various sectors and industries. This includes a mix of higher yield, slower growth stocks, and lower yield, higher growth stocks. We then assess their shorter-term growth potential to determine if they are likely to maintain this trajectory.

Beyond delivering strong total returns over time, one of the greatest advantages of the growth yield metric is its ability to help investors ignore the short-term price volatility often observed in the stock market. When investors concentrate on constructing a reliable income-producing plan for their retirement, they are less likely to be swayed by the fluctuations in price of the stock market.

For dividend growth investors whose objective is to invest in securities that provide increasing income over time, the most suitable metric to gauge their success in achieving this objective is growth yield (formerly known as YOC).

If you have not yet joined as a paid subscriber of the blog to receive DGI Alerts on the activity and content related to our model portfolio, it’s not too late. Click Here. 

Recent News 

If we’re talking taxes, dividend stocks crush GICs (Globe & Mail)

https://www.theglobeandmail.com/investing/investment-ideas/article-if-were-talking-taxes-dividend-stocks-crush-gics/

“Someone with an income of $150,000 would have a marginal tax rate of 18.9 to 32 per cent on eligible dividends, and 38 to 47.5 per cent on interest income.”

DGI Truth #5: Dividend growth investing is a tax-efficient strategy

With higher interest rates, many investors are turning to high-interest savings accounts (HISAs) and guaranteed investment certificates (GICs) as a form of risk-free investment. However, it’s essential to be aware that quality dividend growth companies also provide income in the form of dividends, which can offer yields similar to those found in HISAs and GICs. What many people discover too late is how much of their supposedly risk-free money is actually subject to taxation.

It’s worth noting that your first $53,000 of dividend income may be tax-free. Are you aware of any other types of income that are taxed at 0% on the first $53K? It’s always advisable to consult with an accountant regarding your personal tax planning.

Beating the stock market isn’t easy. Many Canadian investors act like it is (Globe & Mail)

https://www.theglobeandmail.com/investing/markets/inside-the-market/article-is-the-stock-market-easy-to-beat/

“The shift to passive investing has been driven, in part, by the relatively disappointing and inconsistent performance record of active managers,” Sean Freer, director of global equity indices at S&P Dow Jones Indices, wrote in a recent report.

Investors who are disappointed in their advisors are now flocking to index investing. What a shame! The financial community needs to do a better job. Next time you meet with your financial advisor, ask them what they would recommend if you wanted to preserve your hard-earned capital and have it provide you with a growing income after you retire. It would be interesting to see what they come back with.

The List (2023)

Last updated by BM on October 20, 2023

The Magic Pants List contains 27 Canadian dividend growth stocks. ‘The List’ contains Canadian companies that have raised their dividend yearly for at least the last ten years and have a market cap of over a billion dollars. Below is each stock’s symbol, name, current yield, current price, price return year-to-date, current dividend, dividend growth year-to-date and current dividend growth streak. Companies on ‘The List’ are added or subtracted once a year, on January 1. After that, ‘The List’ is set for the next twelve months. Prices and dividends are updated weekly.

SYMBOL COMPANY YLD PRICE YTD % DIV YTD % STREAK
AQN-N Algonquin Power & Utilities 10.1% $5.02 -25.4% $0.51 -29.0% 12
ATD-T Alimentation Couche-Tard Inc. 0.8% $73.49 22.2% $0.56 19.1% 13
BCE-T Bell Canada 7.6% $50.68 -15.9% $3.87 5.2% 14
BIP-N Brookfield Infrastructure Partners 4.4% $23.22 -25.9% $1.44 6.3% 15
CCL-B-T CCL Industries 1.9% $55.49 -4.4% $1.06 10.4% 21
CNR-T Canadian National Railway 2.2% $145.93 -10.4% $3.16 7.8% 27
CTC-A-T Canadian Tire 5.0% $137.08 -6.5% $6.90 17.9% 12
CU-T Canadian Utilities Limited 6.3% $28.63 -22.5% $1.79 1.0% 51
DOL-T Dollarama Inc. 0.3% $94.11 17.8% $0.27 23.8% 12
EMA-T Emera 6.4% $44.30 -15.8% $2.82 5.0% 16
ENB-T Enbridge Inc. 8.1% $43.63 -18.2% $3.55 3.2% 27
ENGH-T Enghouse Systems Limited 2.7% $31.74 -11.1% $0.85 18.2% 16
FNV-N Franco Nevada 1.0% $138.93 0.6% $1.36 6.3% 15
FTS-T Fortis Inc. 4.3% $53.54 -3.3% $2.29 5.3% 49
IFC-T Intact Financial 2.3% $194.71 -0.5% $4.40 10.0% 18
L-T Loblaws 1.6% $111.52 -7.3% $1.74 13.2% 11
MGA-N Magna 3.6% $50.92 -11.5% $1.84 2.2% 13
MRU-T Metro 1.7% $70.13 -7.1% $1.21 10.0% 28
RY-T Royal Bank of Canada 4.8% $111.01 -13.3% $5.34 7.7% 12
SJ-T Stella-Jones Inc. 1.3% $72.69 46.6% $0.92 15.0% 18
STN-T Stantec Inc. 0.9% $84.22 28.9% $0.77 8.5% 11
TD-T TD Bank 4.9% $78.71 -10.2% $3.84 7.9% 12
TFII-N TFI International 1.2% $118.55 18.4% $1.40 29.6% 12
TIH-T Toromont Industries 1.6% $104.50 6.9% $1.68 10.5% 33
TRP-T TC Energy Corp. 7.9% $46.51 -12.7% $3.69 3.4% 22
T-T Telus Corp. 6.5% $22.12 -16.0% $1.43 7.4% 19
WCN-N Waste Connections 0.7% $136.45 3.6% $1.02 7.4% 13
Averages 3.7% -3.4% 8.6% 19

Six Canadian stocks on ‘The List’ declare earnings and dividends in US dollars and are inter-listed on a US exchange in US dollars. The simplest way to display dividend and price metrics for these stocks is to show their US exchange symbols along with their US dividends and price. The stocks I am referring to have a -N at the end of their symbols. You can still buy their Canadian counterparts (-T), but your dividends will be converted into CDN dollars and will fluctuate based on the exchange rate.

Note: When the dividend and share price currency match, the calculation is straightforward. But it’s not so simple when the dividend is declared in one currency, and the share price is quoted in another. Dividing the former by the latter would produce a meaningless result because it’s a case of apples and oranges. To calculate the yield properly, you must express the dividend and share price in the same currency.

Performance of ‘The List’

Feel free to click on this link, ‘The List’ for a sortable version from our website.

Last week, ‘The List’ was down with a YTD price return of -3.4% (capital). Dividend growth is now at +8.6% YTD, highlighting growth in income over the past year.

The best performers last week on ‘The List’ were Stella-Jones Inc. (SJ-T), up +6.26%; Enghouse Systems Limited (ENGH-T), up +1.54%; and Franco Nevada (FNV-T), up +0.02%.

Algonquin Power & Utilities (AQN-N) was the worst performer last week, down -12.54%.


Dividend Increases

“The growth of dividend paying ability is of significance in the determination of a stock’s quality, or general safety…”

– Arnold Bernhard (the founder of Value Line)

“As a dividend increase is a positive sign of a company’s financial strength, the safest purchase, after research, is a stock with a recent dividend increase.”

– Tom Connolly (the founder of dividendgrowth.ca)

Last week, no dividend increases from companies on ‘The List’.


Earnings Releases

Benjamin Graham once remarked that earnings are the principal factor driving stock prices.

Each quarter we will provide readers with weekly earnings updates of stocks on ‘The List’ during the calendar earnings season. 

The updated earnings calendar can be found here.

Earnings growth and dividend growth tend to go hand in hand, so this information can tell us a lot about the future dividend growth of our quality companies. Monitoring our dividend growers periodically is part of the process, and reading the quarterly earnings releases is a good place to start.

Five earnings reports from companies on ‘The List’ this week

TFI International (TFII-N) will release its third-quarter fiscal 2023 results on Monday, October 23, 2023, after markets close.

Canadian National Railway (CNR-T) will release its third-quarter fiscal 2023 results on Tuesday, October 24, 2023, after markets close.

Waste Connections (WCN-N) will release its third-quarter fiscal 2023 results on Wednesday, October 25, 2023, after markets close.

Canadian Utilities Limited (CU-T) will release its third-quarter fiscal 2023 results on Thursday, October 26, 2023, before markets open.

Fortis Inc. (FTS-T) will release its third-quarter fiscal 2023 results on Friday, October 27, 2023, before markets open.

Last week, no companies on ‘The List’ reported earnings.


MP Market Review – October 13, 2023

Last updated by BM on October 16, 2023

Summary 

  • This is a weekly installment of our MP Market Review series, which provides updates on the financial markets and Canadian dividend growth companies we monitor on ‘The List’.
  • Last week, ‘The List’ was down with a YTD price return of -1.1% (capital). Dividend growth is at +8.6% YTD, highlighting growth in income over the past year.
  • Last week, no dividend increases from companies on ‘The List’.
  • Last week, no earnings reports from companies on ‘The List’.
  • No companies on ‘The List’ are due to report earnings this week.
  • If you’re interested in creating your own dividend growth income portfolio, consider subscribing to our premium service, which grants you access to the MP Wealth-Builder Model Portfolio (CDN) and exclusive subscriber-only content.  Learn More         

Identifying companies whose dividend growth aligns closely with price growth can considerably enhance the predictability of future returns. Dividend growth investors know that the dividend drives the price in a predictable way, not the other way around. Fortis Inc. (FTS-T) is another company on ‘The List’ that aligns very closely with this dividend growth vs price growth pattern we like to see.

Introduction

“You have a pair of pants. In the left pocket, you have $100. You take $1 out of the left pocket and put it in the right pocket. You now have $101. There is no diminution of dollars in your left pocket. That is one magic pair of pants.”

This ‘magic pants’ analogy was from a Seeking Alpha article on dividend investing I read about a decade ago and was one of the catalysts for me to take a closer look at this type of investing and see if it truly was magical. 

After conducting additional research, I have shifted towards utilizing a dividend growth investing (DGI) strategy as my primary investment approach. While I maintain portfolios consisting of high-quality dividend growers from both the United States and Canada, I have opted to concentrate on Canadian (CDN) dividend growth companies in this blog. This is due to several reasons, including a smaller pool of DGI companies to track, a lack of coverage for the DGI strategy by the North American investment media, and a tendency for those who do cover DGI to narrowly focus on only a handful of sectors (Energy and Financials).

While ‘The List’ is not a portfolio in itself, it serves as an excellent initial reference for individuals seeking to diversify their investments and attain higher returns in the Canadian stock market. Through our blog, we provide weekly updates on ‘The List’ and offer valuable perspectives and real-life examples of the dividend growth investing strategy in practice. This helps readers gain a deeper understanding of how to implement and benefit from this investment approach.


DGI Thoughts

“It’s far better to buy a wonderful company at a fair price than a fair company at a wonderful price.”

– Warren Buffett

Quality vs Value

While we are always hunting for attractive investment opportunities, we must remember that the pursuit of bargains shouldn’t overshadow the importance of quality. This is a snapshot of ‘The List’ as of Friday, October 13, 2023, sorted by valuation according to the dividend yield theory (valuation measure).

At present, half of ‘The List’ is deemed undervalued based on dividend yield theory. However, a different perspective emerges when we sort this list using some of our ‘quality indicators’ like Value Line Safety and Financial ratings, S&P Rating, and Dividend Growth Streak.

As Warren Buffett rightly advises, any investment strategy should prioritize acquiring companies positioned near the top of this list – those considered ‘wonderful companies’ – when they are reasonably priced. This approach, rather than focusing solely on valuation, promises a more favorable outcome.

If you have not yet joined as a paid subscriber of the blog to receive DGI Alerts on the activity and content related to our model portfolio, it’s not too late. Click Here. 

Recent News 

BMO strategist reiterates importance of a dividend growth portfolio in current environment (Globe & Mail)

https://www.theglobeandmail.com/investing/markets/inside-the-market/article-bmo-strategist-reiterates-importance-of-a-dividend-growth-portfolio-in/

“BMO chief investment strategist Brian Belski reiterated his belief that dividend growth is the correct strategy for income-oriented investors.”

The author discusses the limitations of ‘yield-focused strategies’ in this article. For many investors, the key distinction lies in separating high-yield dividend investing from investing in quality dividend growth companies that consistently increase their cash flow each year. It is not the initial high yield that wins; rather, it is the combination of yield plus growth over time.

I would argue that dividend growth investing is important in any environment but then again, I am a little biased.

The carnage in dividend-land is an epic buying opportunity, if you have time to wait (Globe & Mail)

https://www.theglobeandmail.com/investing/personal-finance/carrick-on-money/article-the-carnage-in-dividend-land-is-an-epic-buying-opportunity-if-you-have/

“Prices will rise, yields will come down. Investors who bought dividend stocks when they were beaten down will be rewarded in three ways:

  1. Potential price rebounds: Some blue-chip dividend stocks have fallen so hard lately that their share prices are down or flat over the past five years.
  2. Dividend growth: Bond interest is locked in, but many dividend stocks have a history of annual dividend increases.
  3. Tax: In a non-registered account, the dividend tax credit means you pay less tax on dividends from a corporation than you do on bond interest.”

I’m pleased to see a growing number of articles about dividend growth investing in the financial media. When traditional index and growth-focused approaches no longer deliver the desired results, you can always rely on the time-tested strategy of dividend growth investing.

The List (2023)

Last updated by BM on October 13, 2023

The Magic Pants List contains 27 Canadian dividend growth stocks. ‘The List’ contains Canadian companies that have raised their dividend yearly for at least the last ten years and have a market cap of over a billion dollars. Below is each stock’s symbol, name, current yield, current price, price return year-to-date, current dividend, dividend growth year-to-date and current dividend growth streak. Companies on ‘The List’ are added or subtracted once a year, on January 1. After that, ‘The List’ is set for the next twelve months. Prices and dividends are updated weekly.

SYMBOL COMPANY YLD PRICE YTD % DIV YTD % STREAK
AQN-N Algonquin Power & Utilities 8.8% $5.74 -14.7% $0.51 -29.0% 12
ATD-T Alimentation Couche-Tard Inc. 0.8% $74.40 23.7% $0.56 19.1% 13
BCE-T Bell Canada 7.5% $51.66 -14.2% $3.87 5.2% 14
BIP-N Brookfield Infrastructure Partners 4.4% $25.98 -17.7% $1.44 6.3% 15
CCL-B-T CCL Industries 1.9% $55.98 -3.6% $1.06 10.4% 21
CNR-T Canadian National Railway 2.1% $147.15 -9.7% $3.16 7.8% 27
CTC-A-T Canadian Tire 4.9% $140.85 -3.9% $6.90 17.9% 12
CU-T Canadian Utilities Limited 6.1% $29.46 -20.2% $1.79 1.0% 51
DOL-T Dollarama Inc. 0.3% $95.31 19.3% $0.27 23.8% 12
EMA-T Emera 6.0% $46.72 -11.2% $2.82 5.0% 16
ENB-T Enbridge Inc. 7.9% $44.70 -16.2% $3.55 3.2% 27
ENGH-T Enghouse Systems Limited 2.7% $31.26 -12.5% $0.85 18.2% 16
FNV-N Franco Nevada 1.0% $138.90 0.5% $1.36 6.3% 15
FTS-T Fortis Inc. 4.2% $54.41 -1.7% $2.29 5.3% 49
IFC-T Intact Financial 2.2% $199.95 2.1% $4.40 10.0% 18
L-T Loblaws 1.5% $113.80 -5.4% $1.74 13.2% 11
MGA-N Magna 3.5% $52.21 -9.2% $1.84 2.2% 13
MRU-T Metro 1.7% $71.62 -5.1% $1.21 10.0% 28
RY-T Royal Bank of Canada 4.7% $114.54 -10.5% $5.34 7.7% 12
SJ-T Stella-Jones Inc. 1.3% $68.41 38.0% $0.92 15.0% 18
STN-T Stantec Inc. 0.9% $88.71 35.8% $0.77 8.5% 11
TD-T TD Bank 4.8% $80.35 -8.3% $3.84 7.9% 12
TFII-N TFI International 1.2% $121.29 21.1% $1.40 29.6% 12
TIH-T Toromont Industries 1.5% $110.00 12.6% $1.68 10.5% 33
TRP-T TC Energy Corp. 7.7% $47.90 -10.1% $3.69 3.4% 22
T-T Telus Corp. 6.3% $22.82 -13.3% $1.43 7.4% 19
WCN-N Waste Connections 0.7% $138.41 5.1% $1.02 7.4% 13
Averages 3.6% -1.1% 8.6% 19

Six Canadian stocks on ‘The List’ declare earnings and dividends in US dollars and are inter-listed on a US exchange in US dollars. The simplest way to display dividend and price metrics for these stocks is to show their US exchange symbols along with their US dividends and price. The stocks I am referring to have a -N at the end of their symbols. You can still buy their Canadian counterparts (-T), but your dividends will be converted into CDN dollars and will fluctuate based on the exchange rate.

Note: When the dividend and share price currency match, the calculation is straightforward. But it’s not so simple when the dividend is declared in one currency, and the share price is quoted in another. Dividing the former by the latter would produce a meaningless result because it’s a case of apples and oranges. To calculate the yield properly, you must express the dividend and share price in the same currency.

Performance of ‘The List’

Feel free to click on this link, ‘The List’ for a sortable version from our website.

Last week, ‘The List’ was down with a YTD price return of -1.1% (capital). Dividend growth is now at +8.6% YTD, highlighting growth in income over the past year.

The best performers last week on ‘The List’ were Stella-Jones Inc. (SJ-T), up +5.80%; Franco Nevada (FNV-N), up +5.11%; and TC Energy Corp. (TRP-T), up +4.75%.

Brookfield Infrastructure Partners (BIP-N) was the worst performer again last week, down -7.31%.


Dividend Increases

“The growth of dividend paying ability is of significance in the determination of a stock’s quality, or general safety…”

– Arnold Bernhard (the founder of Value Line)

“As a dividend increase is a positive sign of a company’s financial strength, the safest purchase, after research, is a stock with a recent dividend increase.”

– Tom Connolly (the founder of dividendgrowth.ca)

Last week, no dividend increases from companies on ‘The List’.


Earnings Releases

Benjamin Graham once remarked that earnings are the principal factor driving stock prices.

Each quarter we will provide readers with weekly earnings updates of stocks on ‘The List’ during the calendar earnings season. 

The updated earnings calendar can be found here.

Earnings growth and dividend growth tend to go hand in hand, so this information can tell us a lot about the future dividend growth of our quality companies. Monitoring our dividend growers periodically is part of the process, and reading the quarterly earnings releases is a good place to start.

No earnings reports from companies on ‘The List’ this week

Last week, no companies on ‘The List’ reported earnings.


MP Market Review – October 06, 2023

Last updated by BM on October 09, 2023

Summary 

  • This is a weekly installment of our MP Market Review series, which provides updates on the financial markets and Canadian dividend growth companies we monitor on ‘The List’.
  • Last week, ‘The List’ was down with a YTD price return of -0.9% (capital). Dividend growth remained the same at +8.5% YTD, highlighting growth in income over the past year.
  • Last week, no dividend increases from companies on ‘The List’.
  • Last week, no earnings reports from companies on ‘The List’.
  • No companies on ‘The List’ are due to report earnings this week.
  • If you’re interested in creating your own dividend growth income portfolio, consider subscribing to our premium service, which grants you access to the MP Wealth-Builder Model Portfolio (CDN) and exclusive subscriber-only content.  Learn More         

Identifying companies whose dividend growth aligns closely with price growth can considerably enhance the predictability of future returns. Dividend growth investors know that the dividend drives the price in a predictable way, not the other way around. Fortis Inc. (FTS-T) is another company on ‘The List’ that aligns very closely with this dividend growth vs price growth pattern we like to see.

Introduction

“You have a pair of pants. In the left pocket, you have $100. You take $1 out of the left pocket and put it in the right pocket. You now have $101. There is no diminution of dollars in your left pocket. That is one magic pair of pants.”

This ‘magic pants’ analogy was from a Seeking Alpha article on dividend investing I read about a decade ago and was one of the catalysts for me to take a closer look at this type of investing and see if it truly was magical. 

After conducting additional research, I have shifted towards utilizing a dividend growth investing (DGI) strategy as my primary investment approach. While I maintain portfolios consisting of high-quality dividend growers from both the United States and Canada, I have opted to concentrate on Canadian (CDN) dividend growth companies in this blog. This is due to several reasons, including a smaller pool of DGI companies to track, a lack of coverage for the DGI strategy by the North American investment media, and a tendency for those who do cover DGI to narrowly focus on only a handful of sectors (Energy and Financials).

While ‘The List’ is not a portfolio in itself, it serves as an excellent initial reference for individuals seeking to diversify their investments and attain higher returns in the Canadian stock market. Through our blog, we provide weekly updates on ‘The List’ and offer valuable perspectives and real-life examples of the dividend growth investing strategy in practice. This helps readers gain a deeper understanding of how to implement and benefit from this investment approach.


DGI Thoughts

“Stock returns always add up to the sum of the current dividend yield, plus dividends/earnings per share growth, plus or minus any change in the valuation”.

– Charles Ellis

‘Higher for longer’

Rising interest rates can have a detrimental impact on stocks for two primary reasons. Firstly, interest expenses play a crucial role in a company’s income statement. If the cost of borrowing money increases, companies tend to borrow less and face higher expenses when refinancing existing debt. Secondly, higher yields present more attractive alternatives for investors’ capital, creating stronger competition for their investments.

With recent data still indicating an overheated economy (inflation accelerating), Central Banks may find themselves with no choice but to raise interest rates further or, at the very least, maintain their current trajectory.

Let’s delve deeper into the implications of the increasingly prevalent “higher for longer” narrative within the investment media. Capital-intensive business models, such as pipelines, telecommunications companies (Telcos), Real Estate Investment Trusts (REITs), and utilities, could experience adverse effects if interest rates remain elevated for an extended period. Even the most defensively positioned sector among them, utilities, is not immune to these impacts.

Utility companies are often considered defensive stocks for several reasons:

  1. Steady Demand: Utility services, such as electricity, natural gas, water, and telecommunications, are necessities for both individuals and businesses. Regardless of economic conditions, people continue to use these services. This steady demand provides a reliable source of revenue for utility companies.
  1. Stable Cash Flows: Utility companies typically have a regulated business model. Regulatory bodies often set the rates these companies can charge for their services, which can provide a degree of predictability and stability to their cash flows. This regulation helps ensure that utility companies can cover their operating costs and debt obligations even during economic downturns.
  1. Income Generation: Many investors, especially those seeking income or dividends, are attracted to utility stocks because they tend to offer relatively high dividend yields. Utility companies often distribute a significant portion of their profits to shareholders in the form of dividends. This income can be especially appealing during periods of economic uncertainty when other investment options may offer lower yields or more risk.
  1. Low Price Elasticity: The demand for utility services is relatively price inelastic, meaning that changes in the price of these services do not significantly impact demand. People continue to use electricity, gas, and water even if prices increase moderately. This price inelasticity can help protect utility companies from severe revenue declines during economic downturns.
  1. Defensive Nature: Utility stocks are often considered “defensive” in the sense that they tend to be less sensitive to economic cycles. When the economy is performing poorly, investors may flock to defensive stocks like utilities as a way to preserve capital and maintain income.
  1. Hedging Against Market Volatility: Utility stocks can act as a hedge against market volatility. During periods of stock market turbulence, investors may seek refuge in assets that are less affected by market fluctuations. Utility stocks, with their stable cash flows and dividends, can provide a level of stability to a diversified investment portfolio.
  1. Regulated Monopolies: In many cases, utility companies operate as regulated monopolies in specific regions. This means they have limited competition, allowing them to maintain more consistent pricing power and profitability.

With characteristics like these, it’s no surprise that utility companies appear on ‘The List’ and have consistently delivered increasing income and capital appreciation to dividend growth investors for decades. Recent stock market data, however, paints a different picture of their defensive nature.

High interest rates, particularly the current narrative of “higher for longer” interest rates, have had a negative impact on utility companies, for the reasons explained earlier. To succeed, we must identify the highest quality utility companies and increase our holdings when they are oversold and trading at a discount to their fair value (sensible price). High interest rates are not sustainable over the long term and our good dividend growers will eventually rebound. In the short term there will still be yield and growth in a market sell-off.

If you have not yet joined as a paid subscriber of the blog to receive DGI Alerts on the activity and content related to our model portfolio, it’s not too late. Click Here. 

Recent News 

Dividend stocks may be sinking, but my cash flow keeps growing (Globe & Mail)

https://www.theglobeandmail.com/investing/education/article-dividend-stocks-may-be-sinking-but-my-cash-flow-keeps-growing/

“For the first several years, the model portfolio chugged along nicely. Companies raised their dividends regularly, and their share prices moved steadily higher, too.”

DGI Truth #2: A rising dividend income stream will eventually lead to rising stock prices.

I have been following Mr. Heinzl’s articles for several years now and have commented on the reasons why his ‘Yield Hog Dividend Growth Portfolio’ has underperformed our portfolios in the past. While he includes some of our quality companies, he also incorporates REITs and ETFs for diversification. With rising interest rates, he is finally feeling the impact of his decision to include cyclical and lower-quality companies in his portfolio.

“But the benefits of rising dividends are more than financial. When your investment income is growing steadily, it’s easier to accept market volatility and sliding stock prices as normal parts of investing without panicking and doing something rash.” 

Although the author seems to grasp many of our dividend growth investing principles, a greater emphasis on quality would have helped avoid many of his ‘surprises’ over the years.

A tough year for dividend stocks puts lots of big names on sale (Globe & Mail)

https://www.theglobeandmail.com/investing/markets/inside-the-market/article-a-tough-year-for-dividend-stocks-puts-lots-of-big-names-on-sale/

“But dividend stocks have a couple of advantages when it comes to inflation, Mr. Bushell said. The first is the potential for dividend increases. And the second is that many businesses can pass on some inflation through pricing power.”

DGI Truth #3: Dividend growth investors enjoy inflation-protected income.

Amidst the ongoing discussions regarding the potential for interest rates to remain ‘higher for longer,’ investors seeking greater yields may consider Guaranteed Investment Certificates (GICs) or High-Interest Savings Accounts as more secure options for their funds. However, what they often fail to recognize is that even within these seemingly risk-free investments, their cash remains susceptible to the erosive impact of inflation, resulting in a negative real rate of return. To put it simply, their purchasing power may dwindle over time, despite the appearance of security in their investments.

While we cannot completely shield our capital from price volatility in the short term, we can minimize the impact of inflation on our purchasing power through our income (rising dividends). Thus far, our dividend increases have consistently outpaced the rate of inflation.

The List (2023)

Last updated by BM on October 06, 2023

The Magic Pants List contains 27 Canadian dividend growth stocks. ‘The List’ contains Canadian companies that have raised their dividend yearly for at least the last ten years and have a market cap of over a billion dollars. Below is each stock’s symbol, name, current yield, current price, price return year-to-date, current dividend, dividend growth year-to-date and current dividend growth streak. Companies on ‘The List’ are added or subtracted once a year, on January 1. After that, ‘The List’ is set for the next twelve months. Prices and dividends are updated weekly.

SYMBOL COMPANY YLD PRICE YTD % DIV YTD % STREAK
AQN-N Algonquin Power & Utilities 8.8% $5.77 -14.3% $0.51 -29.0% 12
ATD-T Alimentation Couche-Tard Inc. 0.8% $71.87 19.5% $0.56 19.1% 13
BCE-T Bell Canada 7.6% $51.02 -15.3% $3.87 5.2% 14
BIP-N Brookfield Infrastructure Partners 4.4% $28.03 5.2% $1.44 6.3% 15
CCL-B-T CCL Industries 1.9% $56.26 -3.1% $1.06 10.4% 21
CNR-T Canadian National Railway 2.2% $146.35 -10.1% $3.16 7.8% 27
CTC-A-T Canadian Tire 4.9% $141.56 -3.4% $6.90 17.9% 12
CU-T Canadian Utilities Limited 6.1% $29.42 -20.4% $1.79 1.0% 51
DOL-T Dollarama Inc. 0.3% $94.15 17.9% $0.27 23.8% 12
EMA-T Emera 5.9% $47.39 -9.9% $2.82 5.0% 16
ENB-T Enbridge Inc. 8.2% $43.47 -18.5% $3.55 3.2% 27
ENGH-T Enghouse Systems Limited 2.7% $31.07 -13.0% $0.85 18.2% 16
FNV-N Franco Nevada 1.0% $132.15 -4.3% $1.36 6.3% 15
FTS-T Fortis Inc. 4.3% $53.45 -3.4% $2.29 5.3% 49
IFC-T Intact Financial 2.2% $199.09 1.7% $4.40 10.0% 18
L-T Loblaws 1.5% $116.46 -3.2% $1.74 10.3% 11
MGA-N Magna 3.4% $54.18 -5.8% $1.84 2.2% 13
MRU-T Metro 1.7% $71.51 -5.3% $1.21 10.0% 28
RY-T Royal Bank of Canada 4.6% $114.90 -10.3% $5.34 7.7% 12
SJ-T Stella-Jones Inc. 1.4% $64.66 30.4% $0.92 15.0% 18
STN-T Stantec Inc. 0.9% $89.88 37.6% $0.77 8.5% 11
TD-T TD Bank 4.8% $79.80 -9.0% $3.84 7.9% 12
TFII-N TFI International 1.1% $124.78 24.6% $1.40 29.6% 12
TIH-T Toromont Industries 1.5% $110.49 13.1% $1.68 10.5% 33
TRP-T TC Energy Corp. 8.1% $45.73 -14.2% $3.69 3.4% 22
T-T Telus Corp. 6.3% $22.55 -14.3% $1.43 7.4% 19
WCN-N Waste Connections 0.8% $135.96 3.2% $1.02 7.4% 13
Averages 3.6% -0.9% 8.5% 19

Six Canadian stocks on ‘The List’ declare earnings and dividends in US dollars and are inter-listed on a US exchange in US dollars. The simplest way to display dividend and price metrics for these stocks is to show their US exchange symbols along with their US dividends and price. The stocks I am referring to have a -N at the end of their symbols. You can still buy their Canadian counterparts (-T), but your dividends will be converted into CDN dollars and will fluctuate based on the exchange rate.

Note: When the dividend and share price currency match, the calculation is straightforward. But it’s not so simple when the dividend is declared in one currency, and the share price is quoted in another. Dividing the former by the latter would produce a meaningless result because it’s a case of apples and oranges. To calculate the yield properly, you must express the dividend and share price in the same currency.

Performance of ‘The List’

Feel free to click on this link, ‘The List’ for a sortable version from our website.

Last week, ‘The List’ was down with a YTD price return of -0.9% (capital). Dividend growth remained the same at +8.5% YTD, highlighting growth in income over the past year.

The best performers last week on ‘The List’ were Alimentation Couche-Tard Inc. (ATD-T), up +4.19%; Enghouse Systems Limited (ENGH-T), up +3.64%; and Fortis Inc. (FTS-T), up +3.61%.

Brookfield Infrastructure Partners (BIP-N) was the worst performer last week, down -4.66%.


Dividend Increases

“The growth of dividend paying ability is of significance in the determination of a stock’s quality, or general safety…”

– Arnold Bernhard (the founder of Value Line)

“As a dividend increase is a positive sign of a company’s financial strength, the safest purchase, after research, is a stock with a recent dividend increase.”

– Tom Connolly (the founder of dividendgrowth.ca)

Last week, no dividend increases from companies on ‘The List’.


Earnings Releases

Benjamin Graham once remarked that earnings are the principal factor driving stock prices.

Each quarter we will provide readers with weekly earnings updates of stocks on ‘The List’ during the calendar earnings season. 

The updated earnings calendar can be found here.

Earnings growth and dividend growth tend to go hand in hand, so this information can tell us a lot about the future dividend growth of our quality companies. Monitoring our dividend growers periodically is part of the process, and reading the quarterly earnings releases is a good place to start.

No earnings reports from companies on ‘The List’ this week

Last week, no companies on ‘The List’ reported earnings.


MP Market Review – September 29, 2023

Last updated by BM on October 02, 2023

Summary 

  • This is a weekly installment of our MP Market Review series, which provides updates on the financial markets and Canadian dividend growth companies we monitor on ‘The List’.
  • Last week, ‘The List’ was down with a YTD price return of -0.8% (capital). Dividend growth remained the same at +8.5% YTD, highlighting growth in income over the past year.
  • Last week, no dividend increases from companies on ‘The List’.
  • Last week, no earnings report from companies on ‘The List’.
  • No companies on ‘The List’ are due to report earnings this week.
  • If you’re interested in creating your own dividend growth income portfolio, consider subscribing to our premium service, which grants you access to the MP Wealth-Builder Model Portfolio (CDN) and exclusive subscriber-only content.  Learn More         

Identifying companies whose dividend growth aligns closely with price growth can considerably enhance the predictability of future returns. Dividend growth investors know that the dividend drives the price in a predictable way, not the other way around. Fortis Inc. (FTS-T) is another company on ‘The List’ that aligns very closely with this dividend growth vs price growth pattern we like to see.

Introduction

“You have a pair of pants. In the left pocket, you have $100. You take $1 out of the left pocket and put it in the right pocket. You now have $101. There is no diminution of dollars in your left pocket. That is one magic pair of pants.”

This ‘magic pants’ analogy was from a Seeking Alpha article on dividend investing I read about a decade ago and was one of the catalysts for me to take a closer look at this type of investing and see if it truly was magical. 

After conducting additional research, I have shifted towards utilizing a dividend growth investing (DGI) strategy as my primary investment approach. While I maintain portfolios consisting of high-quality dividend growers from both the United States and Canada, I have opted to concentrate on Canadian (CDN) dividend growth companies in this blog. This is due to several reasons, including a smaller pool of DGI companies to track, a lack of coverage for the DGI strategy by the North American investment media, and a tendency for those who do cover DGI to narrowly focus on only a handful of sectors (Energy and Financials).

While ‘The List’ is not a portfolio in itself, it serves as an excellent initial reference for individuals seeking to diversify their investments and attain higher returns in the Canadian stock market. Through our blog, we provide weekly updates on ‘The List’ and offer valuable perspectives and real-life examples of the dividend growth investing strategy in practice. This helps readers gain a deeper understanding of how to implement and benefit from this investment approach.


DGI Thoughts

“If you are not going to sell a stock, what happens to its price is a matter of indifference. For true long-term investors – that small group of people like Warren Buffett who can shut their eyes to short-term fluctuations and have no doubt that what goes down will come back up – volatility represents opportunity rather than risk.”

–  Peter L. Bernstein, Against the Gods, page 261

One of my mentors, Tom Connolly, published a report back in 2018 that I revisit and review when the market experiences a significant downturn with no clear end in sight. I believe now is a good time to share some of his insights with our readers.

Why dividend growth investors do not worry in a market sell off.

  • What really matters is the rising future stream of dividends and retained earnings. Eventually, there will also be a commensurate rise in the capital value of the stock.
  • In a market sell-off, it’s the excitement factor/transient return (p/e) that drops. Dividends, intrinsic values, retained earnings actually continue to grow in a bear market. This is the ultimate solid foundation under our dividend growth strategy.
  • “In violent market sell-offs even solid names get treated as ‘lemons’, initially”. M. El-Erain. Take advantage of this shoddy thinking.
  • Shut your eyes to short term fluctuations: we do not buy to sell. The market is a mind game. Be disciplined. Hold for the cash flow. Think very long term.
  • Volatility is not risk!
  • Yield on Cost – If market gyrations bother you, study the yield on the original price of stocks you purchased years ago. Such data is relaxing.
  • Market price can be volatile: intrinsic value and dividends do not fluctuate much.
  • We own companies that have increased dividends each year for years. Quality!
  • Study year-over-year dividend data for a decade. Market bleeps are hardly there.
  • Charles Ellis – “Stock returns always add up to the sum of the current dividend yield, plus dividends/earnings per share growth, plus or minus any change in the valuation”. There will still be yield and growth in a market sell-off. p.130
  • Peter L. Bernstein – “If you are not going to sell a stock, what happens to its price is a matter of indifference. For true long-term investors – that small group of people like Warren Buffett who can shut their eyes to short-term fluctuations and have no doubt that what goes down will come back up – volatility represents opportunity rather than risk.” Peter L. Bernstein, Against the Gods, page 261
  • James Montier – “In the long-run, the return is almost exclusively driven by dividends”
  • Steven Jarislowsky – “If you have premium high compound growth noncyclicals, it is not really necessary to get out if the stock price goes too high. If far too high, obviously you can trim a bit and pay some tax, but be sure your gains have been real, not inflation mirages. Personally, I normally just hold and take a few down drafts, counting on the next bull market to take me up again.”
  • Dimson, Marsh and Staunton “the vast majority of long-term real returns are derived from equity income”.
  • Ben Graham – “Basically, price fluctuations have only one significant meaning for the true investor. They provide an opportunity to buy wisely when prices fall sharply and to sell wisely when they advance a great deal. At other times he will do better if he forgets about the stock market and pays attention to his dividend returns and to the operating results of his companies.” Intelligent Investor C-8
  • Warren Buffett – Feb 24, 2018 “undistributed earnings…will, over time. Translate into commensurate capital gains. Quality. Always and only quality companies.
  • Jack Bogle – “the stock market is a giant distraction from the business of investing”

If you have not yet joined as a paid subscriber of the blog to receive DGI Alerts on the activity and content related to our model portfolio, it’s not too late. Click Here. 

Recent News 

Dividend-paying stocks will be far more important than in the past (Globe & Mail)

https://www.theglobeandmail.com/investing/investment-ideas/article-dividend-paying-stocks-will-be-far-more-important-than-in-the-past/

A few of my favourite quotes from the article:

“A US$10,000 investment in 1960 in the S&P 500 would be worth more than US$4-million now, with more than 80 per cent of that gain from dividends (assuming reinvestment) and 20 per cent from capital gains.”

“Dividend stocks are attractive, but not all are the same. The most attractive firms are in good businesses with great management that can consistently increase dividends.”

There is no point in buying stocks that pay dividends if you are going to give up a portion of your cash flows by paying large fees to active managers, most of whom, if you believe the empirical evidence, do not add any value over the long run.”

Build your own dividend growth portfolio with quality companies that have a track record of dividend growth by subscribing today. We will show you how!

I’m buying Fortis while this dividend growth darling is still cheap (Globe & Mail)

https://www.theglobeandmail.com/investing/education/article-im-buying-fortis-while-this-dividend-growth-darling-is-still-cheap/

“… when it comes to investing, there is one thing that’s virtually certain: Shareholders of Fortis Inc. will get a dividend increase every year.”

Utility stocks, such as Fortis Inc., tend to be sensitive to changes in interest rates. When interest rates are low, the dividend offered by these stocks becomes more attractive to investors. Currently, investors are finding higher rates in alternative investments, which is putting pressure on the stock price. Like the author’s perspective, we also anticipate a buying opportunity for this high-quality dividend growth stock in the near future.

The List (2023)

Last updated by BM on September 29, 2023

The Magic Pants List contains 27 Canadian dividend growth stocks. ‘The List’ contains Canadian companies that have raised their dividend yearly for at least the last ten years and have a market cap of over a billion dollars. Below is each stock’s symbol, name, current yield, current price, price return year-to-date, current dividend, dividend growth year-to-date and current dividend growth streak. Companies on ‘The List’ are added or subtracted once a year, on January 1. After that, ‘The List’ is set for the next twelve months. Prices and dividends are updated weekly.

SYMBOL COMPANY YLD PRICE YTD % DIV YTD % STREAK
AQN-N Algonquin Power & Utilities 8.6% $5.92 -12.0% $0.51 -29.0% 12
ATD-T Alimentation Couche-Tard Inc. 0.8% $68.98 14.7% $0.56 19.1% 13
BCE-T Bell Canada 7.4% $51.85 -13.9% $3.82 5.0% 14
BIP-N Brookfield Infrastructure Partners 4.4% $29.40 5.2% $1.44 6.3% 15
CCL-B-T CCL Industries 1.9% $57.01 -1.8% $1.06 10.4% 21
CNR-T Canadian National Railway 2.1% $147.09 -9.7% $3.16 7.8% 27
CTC-A-T Canadian Tire 4.7% $146.05 -0.4% $6.90 17.9% 12
CU-T Canadian Utilities Limited 6.3% $28.70 -22.3% $1.79 1.0% 51
DOL-T Dollarama Inc. 0.3% $93.58 17.2% $0.27 23.8% 12
EMA-T Emera 5.8% $47.42 -9.9% $2.76 3.0% 16
ENB-T Enbridge Inc. 7.9% $45.05 -15.5% $3.55 3.2% 27
ENGH-T Enghouse Systems Limited 2.8% $29.98 -16.0% $0.85 18.2% 16
FNV-N Franco Nevada 1.0% $133.49 -3.4% $1.36 6.3% 15
FTS-T Fortis Inc. 4.4% $51.59 -6.8% $2.29 5.3% 49
IFC-T Intact Financial 2.2% $198.02 1.1% $4.40 10.0% 18
L-T Loblaws 1.5% $115.40 -4.1% $1.74 10.3% 11
MGA-N Magna 3.4% $53.61 -6.8% $1.84 2.2% 13
MRU-T Metro 1.7% $70.54 -6.5% $1.21 10.0% 28
RY-T Royal Bank of Canada 4.5% $118.70 -7.3% $5.34 7.7% 12
SJ-T Stella-Jones Inc. 1.4% $65.32 31.7% $0.92 15.0% 18
STN-T Stantec Inc. 0.9% $88.13 34.9% $0.77 8.5% 11
TD-T TD Bank 4.7% $81.83 -6.7% $3.84 7.9% 12
TFII-N TFI International 1.1% $128.41 28.2% $1.40 29.6% 12
TIH-T Toromont Industries 1.5% $110.62 13.2% $1.68 10.5% 33
TRP-T TC Energy Corp. 7.9% $46.71 -12.4% $3.69 3.4% 22
T-T Telus Corp. 6.4% $22.18 -15.7% $1.43 7.4% 19
WCN-N Waste Connections 0.8% $134.30 2.0% $1.02 7.4% 13
Averages 3.6% -0.8% 8.5% 19

Six Canadian stocks on ‘The List’ declare earnings and dividends in US dollars and are inter-listed on a US exchange in US dollars. The simplest way to display dividend and price metrics for these stocks is to show their US exchange symbols along with their US dividends and price. The stocks I am referring to have a -N at the end of their symbols. You can still buy their Canadian counterparts (-T), but your dividends will be converted into CDN dollars and will fluctuate based on the exchange rate.

Note: When the dividend and share price currency match, the calculation is straightforward. But it’s not so simple when the dividend is declared in one currency, and the share price is quoted in another. Dividing the former by the latter would produce a meaningless result because it’s a case of apples and oranges. To calculate the yield properly, you must express the dividend and share price in the same currency.

Performance of ‘The List’

Feel free to click on this link, ‘The List’ for a sortable version from our website.

Last week, ‘The List’ was down with a YTD price return of -0.8% (capital). Dividend growth remained the same at +8.5% YTD, highlighting growth in income over the past year.

The best performers last week on ‘The List’ were Loblaws (L-T), up +2.08%; Stella-Jones Inc. (SJ-T), up +1.57%; and Enghouse Systems Limited (ENGH-T), up +0.64%.

Algonquin Power & Utilities (AQN-N) was the worst performer last week, down -13.83%.


Dividend Increases

“The growth of dividend paying ability is of significance in the determination of a stock’s quality, or general safety…”

– Arnold Bernhard (the founder of Value Line)

“As a dividend increase is a positive sign of a company’s financial strength, the safest purchase, after research, is a stock with a recent dividend increase.”

– Tom Connolly (the founder of dividendgrowth.ca)

Last week, no dividend increases from companies on ‘The List’.


Earnings Releases

Benjamin Graham once remarked that earnings are the principal factor driving stock prices.

Each quarter we will provide readers with weekly earnings updates of stocks on ‘The List’ during the calendar earnings season. 

The updated earnings calendar can be found here.

Earnings growth and dividend growth tend to go hand in hand, so this information can tell us a lot about the future dividend growth of our quality companies. Monitoring our dividend growers periodically is part of the process, and reading the quarterly earnings releases is a good place to start.

No earnings reports from companies on ‘The List’ this week

Last week, no companies on ‘The List’ reported earnings.


We buy quality individual dividend growth stocks when they are sensibly priced and hold for the growing income.