Last updated by BM on October 23, 2023
Summary
- This is a weekly installment of our MP Market Review series, which provides updates on the financial markets and Canadian dividend growth companies we monitor on ‘The List’.
- Last week, ‘The List’ was down with a YTD price return of -3.4% (capital). Dividend growth is at +8.6% YTD, highlighting growth in income over the past year.
- Last week, no dividend increases from companies on ‘The List’.
- Last week, no earnings reports from companies on ‘The List’.
- Five companies on ‘The List’ are due to report earnings this week.
- If you’re interested in creating your own dividend growth income portfolio, consider subscribing to our premium service, which grants you access to the MP Wealth-Builder Model Portfolio (CDN) and exclusive subscriber-only content. Learn More

Identifying companies whose dividend growth aligns closely with price growth can considerably enhance the predictability of future returns. Dividend growth investors know that the dividend drives the price in a predictable way, not the other way around. Fortis Inc. (FTS-T) is another company on ‘The List’ that aligns very closely with this dividend growth vs price growth pattern we like to see.
Introduction
“You have a pair of pants. In the left pocket, you have $100. You take $1 out of the left pocket and put it in the right pocket. You now have $101. There is no diminution of dollars in your left pocket. That is one magic pair of pants.”
This ‘magic pants’ analogy was from a Seeking Alpha article on dividend investing I read about a decade ago and was one of the catalysts for me to take a closer look at this type of investing and see if it truly was magical.
After conducting additional research, I have shifted towards utilizing a dividend growth investing (DGI) strategy as my primary investment approach. While I maintain portfolios consisting of high-quality dividend growers from both the United States and Canada, I have opted to concentrate on Canadian (CDN) dividend growth companies in this blog. This is due to several reasons, including a smaller pool of DGI companies to track, a lack of coverage for the DGI strategy by the North American investment media, and a tendency for those who do cover DGI to narrowly focus on only a handful of sectors (Energy and Financials).
While ‘The List’ is not a portfolio in itself, it serves as an excellent initial reference for individuals seeking to diversify their investments and attain higher returns in the Canadian stock market. Through our blog, we provide weekly updates on ‘The List’ and offer valuable perspectives and real-life examples of the dividend growth investing strategy in practice. This helps readers gain a deeper understanding of how to implement and benefit from this investment approach.
DGI Thoughts
“Dividend growth is the hidden magic in plain sight. We hold because after ten years, our yield is at least 5%, on average 7% and often about 10%.”
-Tom Connolly
Growth Yield (formerly known as Yield on Cost)
When you’re dealing with investments, the first thing you should do is decide on a clear goal. After that, you need to check how you’re doing to make sure you’re getting closer to your goal. Many investors usually look at how much money they’ve made each year and compare it to a benchmark. As dividend growth investors we focus on our income and need only one metric to measure how we are doing, and it is called “Yield on Cost” or YOC. It’s a way to see how much money you’re getting from your investment compared to how much you originally spent on it.
Some argue that the only yield that truly matters is the current one. Yield on Cost has faced criticism for not reflecting the current stock yield. While we agree in principle that YOC may not be the best metric for valuing a company at its present state, we still find it highly valuable for assessing the quality of the companies we invest in and for tracking their historical and projected performance over time.
We appreciate the perspective shared by Tom Connolly (dividendgrowth.ca) in addressing YOC and the concerns associated with it in this quote from his blog:
“Some people who do not ‘believe’ in YOC argue that what happened ten or 15 years ago is not always a good indicator of the future. That’s true. I’m not saying that YOC is a good indicator of the future. However, if the dividend has grown since purchase, YOC is a good indicator the company is doing well. If a company has a ‘culture’ of increasing its dividend the pattern could easily continue. If folks are not using YOC to measure because it is rooted in the past, how do they measure their returns? Do they not use a past-connected number also? Growing yield is the essence of what the dividend growth strategy is about. Growing yield drives returns. If the yield does not grow, essentially, you have a bond.”
Chuck Carnevale, another mentor, proposes rebranding the YOC metric as growth yield—a term we also find more attractive. This terminology not only emphasizes the initial yield but also underscores the compounding growth of that yield. A straightforward name change could potentially alleviate the reservations of YOC critics, shifting the focus away from the purchase cost and towards the evolving yield, aligning more closely with our approach.
A helpful tool to demonstrate the power of growth yield is a quick test we like to do called the “7% in 10 years” test. If in ten years, our growth yield, without the reinvestment of dividends, is projected to grow to 7% then it is likely that the company has the right mix of initial yield and dividend growth we look for and a candidate for further research.
One of the reasons we use 7% as our numerical goal is that equities have historically provided ~ 7% returns over the last 100 years. To generate a return within a decade equal to the stock market’s historical total return from just the dividend alone demonstrates once again the compounding power of dividend growth investing.
So, how can an investment made today generate a 7% return solely from dividends ten years from now? The answer lies in the growth of the dividend!
Here is a chart we use to determine quickly if the starting yield and dividend growth will get us to our goal.
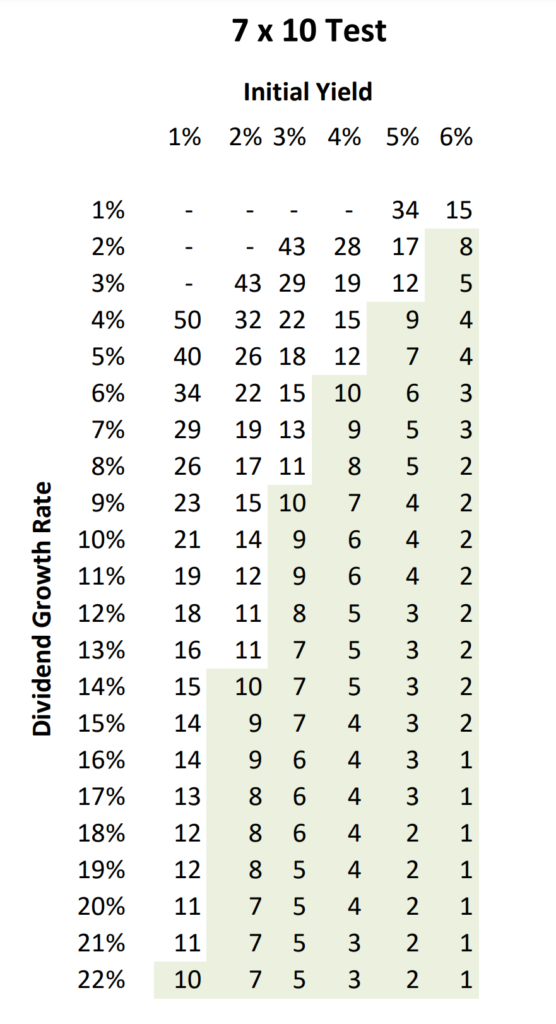
The table illustrates the combinations of initial yields (across the top) and annual growth rates (down the left side) required to achieve a 7% income return from dividends alone. When two values intersect, the table indicates the number of years it takes to reach a 7% growth yield. If the number of years is 10 or fewer, the combination is feasible, and these cells are shaded.
For instance, a 3% initial yield, growing at a rate of 9% per year, reaches a 7% growth yield in 10 years. The same result can be obtained with a 4% initial yield growing at 6% annually. Both combinations are viable.
It’s important to note that the 7×10 table focuses exclusively on income and does not take into account the impact of price increases. Additionally, it does not consider the compounding effect of reinvesting dividends, which would reduce the time required to achieve the displayed growth yield increase. The table solely reflects the growth in yield on cost resulting from the dividend’s own growth.
In our approach to constructing the Magic Pants Wealth-Builder Model Portfolio (CDN), we aim to build a concentrated portfolio of quality companies across various sectors and industries. This includes a mix of higher yield, slower growth stocks, and lower yield, higher growth stocks. We then assess their shorter-term growth potential to determine if they are likely to maintain this trajectory.
Beyond delivering strong total returns over time, one of the greatest advantages of the growth yield metric is its ability to help investors ignore the short-term price volatility often observed in the stock market. When investors concentrate on constructing a reliable income-producing plan for their retirement, they are less likely to be swayed by the fluctuations in price of the stock market.
For dividend growth investors whose objective is to invest in securities that provide increasing income over time, the most suitable metric to gauge their success in achieving this objective is growth yield (formerly known as YOC).
If you have not yet joined as a paid subscriber of the blog to receive DGI Alerts on the activity and content related to our model portfolio, it’s not too late. Click Here.
Recent News
If we’re talking taxes, dividend stocks crush GICs (Globe & Mail)
“Someone with an income of $150,000 would have a marginal tax rate of 18.9 to 32 per cent on eligible dividends, and 38 to 47.5 per cent on interest income.”
DGI Truth #5: Dividend growth investing is a tax-efficient strategy
With higher interest rates, many investors are turning to high-interest savings accounts (HISAs) and guaranteed investment certificates (GICs) as a form of risk-free investment. However, it’s essential to be aware that quality dividend growth companies also provide income in the form of dividends, which can offer yields similar to those found in HISAs and GICs. What many people discover too late is how much of their supposedly risk-free money is actually subject to taxation.
It’s worth noting that your first $53,000 of dividend income may be tax-free. Are you aware of any other types of income that are taxed at 0% on the first $53K? It’s always advisable to consult with an accountant regarding your personal tax planning.
Beating the stock market isn’t easy. Many Canadian investors act like it is (Globe & Mail)
“The shift to passive investing has been driven, in part, by the relatively disappointing and inconsistent performance record of active managers,” Sean Freer, director of global equity indices at S&P Dow Jones Indices, wrote in a recent report.
Investors who are disappointed in their advisors are now flocking to index investing. What a shame! The financial community needs to do a better job. Next time you meet with your financial advisor, ask them what they would recommend if you wanted to preserve your hard-earned capital and have it provide you with a growing income after you retire. It would be interesting to see what they come back with.
The List (2023)
Last updated by BM on October 20, 2023
The Magic Pants List contains 27 Canadian dividend growth stocks. ‘The List’ contains Canadian companies that have raised their dividend yearly for at least the last ten years and have a market cap of over a billion dollars. Below is each stock’s symbol, name, current yield, current price, price return year-to-date, current dividend, dividend growth year-to-date and current dividend growth streak. Companies on ‘The List’ are added or subtracted once a year, on January 1. After that, ‘The List’ is set for the next twelve months. Prices and dividends are updated weekly.
| SYMBOL | COMPANY | YLD | PRICE | YTD % | DIV | YTD % | STREAK |
|---|---|---|---|---|---|---|---|
| AQN-N | Algonquin Power & Utilities | 10.1% | $5.02 | -25.4% | $0.51 | -29.0% | 12 |
| ATD-T | Alimentation Couche-Tard Inc. | 0.8% | $73.49 | 22.2% | $0.56 | 19.1% | 13 |
| BCE-T | Bell Canada | 7.6% | $50.68 | -15.9% | $3.87 | 5.2% | 14 |
| BIP-N | Brookfield Infrastructure Partners | 4.4% | $23.22 | -25.9% | $1.44 | 6.3% | 15 |
| CCL-B-T | CCL Industries | 1.9% | $55.49 | -4.4% | $1.06 | 10.4% | 21 |
| CNR-T | Canadian National Railway | 2.2% | $145.93 | -10.4% | $3.16 | 7.8% | 27 |
| CTC-A-T | Canadian Tire | 5.0% | $137.08 | -6.5% | $6.90 | 17.9% | 12 |
| CU-T | Canadian Utilities Limited | 6.3% | $28.63 | -22.5% | $1.79 | 1.0% | 51 |
| DOL-T | Dollarama Inc. | 0.3% | $94.11 | 17.8% | $0.27 | 23.8% | 12 |
| EMA-T | Emera | 6.4% | $44.30 | -15.8% | $2.82 | 5.0% | 16 |
| ENB-T | Enbridge Inc. | 8.1% | $43.63 | -18.2% | $3.55 | 3.2% | 27 |
| ENGH-T | Enghouse Systems Limited | 2.7% | $31.74 | -11.1% | $0.85 | 18.2% | 16 |
| FNV-N | Franco Nevada | 1.0% | $138.93 | 0.6% | $1.36 | 6.3% | 15 |
| FTS-T | Fortis Inc. | 4.3% | $53.54 | -3.3% | $2.29 | 5.3% | 49 |
| IFC-T | Intact Financial | 2.3% | $194.71 | -0.5% | $4.40 | 10.0% | 18 |
| L-T | Loblaws | 1.6% | $111.52 | -7.3% | $1.74 | 13.2% | 11 |
| MGA-N | Magna | 3.6% | $50.92 | -11.5% | $1.84 | 2.2% | 13 |
| MRU-T | Metro | 1.7% | $70.13 | -7.1% | $1.21 | 10.0% | 28 |
| RY-T | Royal Bank of Canada | 4.8% | $111.01 | -13.3% | $5.34 | 7.7% | 12 |
| SJ-T | Stella-Jones Inc. | 1.3% | $72.69 | 46.6% | $0.92 | 15.0% | 18 |
| STN-T | Stantec Inc. | 0.9% | $84.22 | 28.9% | $0.77 | 8.5% | 11 |
| TD-T | TD Bank | 4.9% | $78.71 | -10.2% | $3.84 | 7.9% | 12 |
| TFII-N | TFI International | 1.2% | $118.55 | 18.4% | $1.40 | 29.6% | 12 |
| TIH-T | Toromont Industries | 1.6% | $104.50 | 6.9% | $1.68 | 10.5% | 33 |
| TRP-T | TC Energy Corp. | 7.9% | $46.51 | -12.7% | $3.69 | 3.4% | 22 |
| T-T | Telus Corp. | 6.5% | $22.12 | -16.0% | $1.43 | 7.4% | 19 |
| WCN-N | Waste Connections | 0.7% | $136.45 | 3.6% | $1.02 | 7.4% | 13 |
| Averages | 3.7% | -3.4% | 8.6% | 19 |
Six Canadian stocks on ‘The List’ declare earnings and dividends in US dollars and are inter-listed on a US exchange in US dollars. The simplest way to display dividend and price metrics for these stocks is to show their US exchange symbols along with their US dividends and price. The stocks I am referring to have a -N at the end of their symbols. You can still buy their Canadian counterparts (-T), but your dividends will be converted into CDN dollars and will fluctuate based on the exchange rate.
Note: When the dividend and share price currency match, the calculation is straightforward. But it’s not so simple when the dividend is declared in one currency, and the share price is quoted in another. Dividing the former by the latter would produce a meaningless result because it’s a case of apples and oranges. To calculate the yield properly, you must express the dividend and share price in the same currency.
Performance of ‘The List’
Feel free to click on this link, ‘The List’ for a sortable version from our website.
Last week, ‘The List’ was down with a YTD price return of -3.4% (capital). Dividend growth is now at +8.6% YTD, highlighting growth in income over the past year.
The best performers last week on ‘The List’ were Stella-Jones Inc. (SJ-T), up +6.26%; Enghouse Systems Limited (ENGH-T), up +1.54%; and Franco Nevada (FNV-T), up +0.02%.
Algonquin Power & Utilities (AQN-N) was the worst performer last week, down -12.54%.
Dividend Increases
“The growth of dividend paying ability is of significance in the determination of a stock’s quality, or general safety…”
– Arnold Bernhard (the founder of Value Line)
“As a dividend increase is a positive sign of a company’s financial strength, the safest purchase, after research, is a stock with a recent dividend increase.”
– Tom Connolly (the founder of dividendgrowth.ca)
Last week, no dividend increases from companies on ‘The List’.
Earnings Releases
Benjamin Graham once remarked that earnings are the principal factor driving stock prices.
Each quarter we will provide readers with weekly earnings updates of stocks on ‘The List’ during the calendar earnings season.
The updated earnings calendar can be found here.
Earnings growth and dividend growth tend to go hand in hand, so this information can tell us a lot about the future dividend growth of our quality companies. Monitoring our dividend growers periodically is part of the process, and reading the quarterly earnings releases is a good place to start.
Five earnings reports from companies on ‘The List’ this week
TFI International (TFII-N) will release its third-quarter fiscal 2023 results on Monday, October 23, 2023, after markets close.
Canadian National Railway (CNR-T) will release its third-quarter fiscal 2023 results on Tuesday, October 24, 2023, after markets close.
Waste Connections (WCN-N) will release its third-quarter fiscal 2023 results on Wednesday, October 25, 2023, after markets close.
Canadian Utilities Limited (CU-T) will release its third-quarter fiscal 2023 results on Thursday, October 26, 2023, before markets open.
Fortis Inc. (FTS-T) will release its third-quarter fiscal 2023 results on Friday, October 27, 2023, before markets open.
Last week, no companies on ‘The List’ reported earnings.
This material may not be suitable for all investors and is not intended to be an offer, or the solicitation of any offer, to buy or sell any securities.
Disclaimer | © Copyright 2026 Magic Pants Dividend Growth Investing.
