Last updated by BM on February 19, 2024
Summary
This is a weekly installment of our MP Market Review series, which provides updates on the financial markets and Canadian dividend growth companies we monitor on ‘The List’.
- Last week, ‘The List’ was up from the previous week with a YTD price return of +3.5% (capital). Dividends were up and have increased by +5.5% YTD, highlighting the growth in our income.
- Last week, there were four dividend announcements from companies on ‘The List’.
- Last week, there were six earnings reports from companies on ‘The List’.
- Two companies on ‘The List’ are due to report earnings this week.
DGI Scorecard
The List (2024)
The Magic Pants 2024 list includes 28 Canadian dividend growth stocks. Here are the criteria to be considered a candidate on ‘The List’:
- Dividend growth streak: 10 years or more.
- Market cap: Minimum one billion dollars.
- Diversification: Limit of five companies per sector, preferably two per industry.
- Cyclicality: Exclude REITs and pure-play energy companies due to high cyclicality.
Based on these criteria, companies on ‘The List’ are added or removed annually on Jan. 1. Prices and dividends are updated weekly.
While ‘The List’ is not a standalone portfolio, it functions admirably as an initial guide for those seeking to broaden their investment portfolio and attain superior returns in the Canadian stock market. Our newsletter provides readers with a comprehensive insight into the implementation and advantages of our Canadian dividend growth investing strategy. This evidence-based, unbiased approach empowers DIY investors to outperform both actively managed dividend funds and passively managed indexes and dividend ETFs over longer-term horizons.
For those interested in something more, please upgrade to a paid subscriber; you get the enhanced weekly newsletter, access to premium content, full privileges on the new Substack website magicpants.substack.com and DGI alerts whenever we make stock transactions in our portfolio.
Performance of ‘The List’
Last week, ‘The List’ was up from the previous week with a YTD price return of +3.5% (capital). Dividends were up and have increased by +5.5% YTD, highlighting the growth in our income.
The best performers last week on ‘The List’ were Intact Financial (IFC-T), up +9.50%; Manulife Financial (MFC-T), up +9.50%; and Waste Connections (WCN-N), up +7.12%.
Enghouse Systems Limited (ENGH-T) was the worst performer last week, down -3.50%.
| SYMBOL | COMPANY | YLD | PRICE | YTD % | DIV | YTD % | STREAK |
|---|---|---|---|---|---|---|---|
| ATD-T | Alimentation Couche-Tard Inc. | 0.9% | $82.00 | 6.8% | $0.70 | 17.4% | 14 |
| BCE-T | Bell Canada | 7.8% | $50.83 | -6.2% | $3.99 | 3.1% | 15 |
| BIP-N | Brookfield Infrastructure Partners | 4.4% | $31.78 | 3.6% | $1.62 | 5.9% | 15 |
| CCL-B-T | CCL Industries | 1.8% | $58.38 | 0.9% | $1.06 | 0.0% | 22 |
| CNR-T | Canadian National Railway | 1.9% | $175.06 | 4.9% | $3.38 | 7.0% | 28 |
| CTC-A-T | Canadian Tire | 5.0% | $140.01 | 1.0% | $7.00 | 1.4% | 13 |
| CU-T | Canadian Utilities Limited | 5.9% | $30.18 | -6.0% | $1.79 | 0.0% | 52 |
| DOL-T | Dollarama Inc. | 0.3% | $103.34 | 8.8% | $0.28 | 5.8% | 13 |
| EMA-T | Emera | 5.9% | $48.38 | -4.7% | $2.87 | 3.0% | 17 |
| ENB-T | Enbridge Inc. | 7.9% | $46.46 | -4.0% | $3.66 | 3.1% | 28 |
| ENGH-T | Enghouse Systems Limited | 2.5% | $35.02 | 3.1% | $0.88 | 4.1% | 17 |
| FNV-N | Franco Nevada | 1.3% | $109.08 | -1.0% | $1.44 | 5.9% | 16 |
| FTS-T | Fortis Inc. | 4.5% | $52.95 | -3.5% | $2.36 | 3.3% | 50 |
| IFC-T | Intact Financial | 2.1% | $228.67 | 12.5% | $4.84 | 10.0% | 19 |
| L-T | Loblaw Companies Limited | 1.3% | $137.76 | 7.2% | $1.78 | 2.4% | 12 |
| MFC-T | Manulife Financial | 4.8% | $33.30 | 15.3% | $1.60 | 9.6% | 10 |
| MGA-N | Magna | 3.3% | $54.94 | -1.0% | $1.84 | 0.0% | 14 |
| MRU-T | Metro Inc. | 1.9% | $71.02 | 3.7% | $1.34 | 10.7% | 29 |
| RY-T | Royal Bank of Canada | 4.2% | $131.94 | -0.8% | $5.52 | 3.4% | 13 |
| SJ-T | Stella-Jones Inc. | 1.2% | $79.86 | 4.3% | $0.92 | 0.0% | 19 |
| STN-T | Stantec Inc. | 0.7% | $112.57 | 7.6% | $0.78 | 2.0% | 12 |
| T-T | Telus | 6.3% | $23.94 | 0.9% | $1.50 | 5.2% | 20 |
| TD-T | TD Bank | 5.0% | $80.87 | -4.5% | $4.08 | 6.3% | 13 |
| TFII-N | TFI International | 1.1% | $145.90 | 11.2% | $1.60 | 10.3% | 13 |
| TIH-T | Toromont Industries | 1.5% | $124.58 | 10.4% | $1.92 | 11.6% | 34 |
| TRI-N | Thomson Reuters | 1.3% | $160.29 | 11.8% | $2.16 | 10.2% | 30 |
| TRP-T | TC Energy Corp. | 7.2% | $53.32 | 1.9% | $3.84 | 3.2% | 23 |
| WCN-N | Waste Connections | 0.7% | $167.87 | 13.3% | $1.14 | 8.6% | 14 |
| Averages | 3.3% | 3.5% | 5.5% | 21 |
Note: Stocks ending in “-N” declare earnings and dividends in US dollars. To achieve currency consistency between dividends and share price for these stocks, we have shown dividends in US dollars and share price in US dollars (these stocks are listed on a US exchange). The dividends for their Canadian counterparts (-T) would be converted into CDN dollars and would fluctuate with the exchange rate.
DGI Clipboard
“The best time to plant a tree was 20 years ago. The second best time is now.”
– Chinese Proverb
Working Backwards To Plan Your Retirement With DGI
One of the magical things about a dividend growth investing (DGI) strategy is the predictability of both the dividend and the growth of that dividend. Because we are not predicting stock market returns, which can change from year to year or trend downward just as we are about to retire, it becomes much easier to plan our retirement if we focus more on the dividend.
In the context of retirement planning, let us start by outlining our objectives. We aim to retire in fifteen years and sustain our lifestyle through dividends. After conducting some research, we believe that $100,000 annually would provide us with a comfortable standard of living at that time. The pivotal question becomes: What amount do we need to invest today to reach this goal? Let us now work backwards to answer our question.
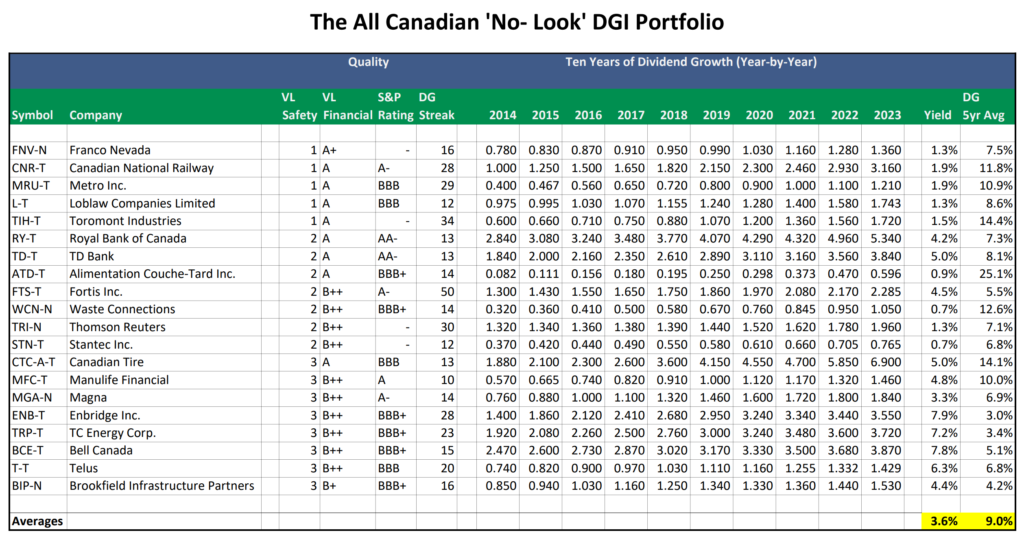
Employing our DGI strategy, which prioritizes a secure dividend and consistent dividend growth based on company fundamentals rather than market speculation, we introduce our All Canadian ‘No-Look’ DGI Portfolio. The portfolio is a condensed version of ‘The List’ we follow, which contains a diversified list of the top twenty Canadian stocks rated by third-party rating agencies as of January 2024.
We will distribute equal investments across all twenty companies, basing our current yield on the average of last Friday’s closing yields (3.6%). The estimated average annual forward dividend growth rate will mirror the five-year average growth rate of the stocks in the portfolio (9%). Our investment horizon spans fifteen years, aligning with our retirement goal.
Source: Magic Pants Dividend Growth Investing
Estimated Growth Yield Formula:
Current Yield * Average Annual Forward Dividend Growth Rate ^ Period = Estimated Growth Yield
3.6% * 1.09 ^ 15 = 13.1%
Using our estimated growth yield calculation, we arrive at an estimated growth yield (in fifteen years) of 12.1%. With a starting yield of 3.6%, that is more than triple what the yield is today.
Next, we calculate the amount we must invest today to generate the desired income.
Desired Dividend Income/Growth Yield=Investment Required
$100,000/.131 = $763,359
Divide this by twenty ($38,168); we know how much to invest in each company in the ‘No-Look’ portfolio.
This scenario does not include dividend reinvestment or any further capital contributions to the portfolio over the next fifteen years. Doing so, however, would allow us to reach our goal even faster. Moreover, our capital has consistently grown in tandem with the dividend, providing an emergency fund should the need arise.
Achieving our financial milestone of $100,000 in annual dividends does not signal an end to income growth. With continued dividend growth, our income remains shielded against inflation and enjoys favourable tax treatment compared to other fixed-income alternatives.
Living off dividends alone in retirement is possible if you start early enough. It may be time to plant that tree!
Check us out on magicpants.substack.com for more info in this week’s issue….
