Last updated by BM on February 12, 2024
Summary
This is a weekly installment of our MP Market Review series, which provides updates on the financial markets and Canadian dividend growth companies we monitor on ‘The List’.
- Last week, ‘The List’ was down slightly from the previous week with a YTD price return now of +1.1% (capital). Dividends were up and have increased by +4.3% YTD, highlighting the growth in our income.
- Last week, there were three dividend announcements from companies on ‘The List’.
- Last week, there were seven earnings reports from companies on ‘The List’.
- Five companies on ‘The List’ are due to report earnings this week.
DGI Scoreboard
The List (2024)
The Magic Pants 2024 list includes 28 Canadian dividend growth stocks. Here are the criteria to be considered a candidate on ‘The List’:
- Dividend growth streak: 10 years or more.
- Market cap: Minimum one billion dollars.
- Diversification: Limit of five companies per sector, preferably two per industry.
- Cyclicality: Exclude REITs and pure-play energy companies due to high cyclicality.
Based on these criteria, companies on ‘The List’ are added or removed annually on Jan. 1. Prices and dividends are updated weekly.
While ‘The List’ is not a standalone portfolio, it functions admirably as an initial guide for those seeking to broaden their investment portfolio and attain superior returns in the Canadian stock market. Our newsletter provides readers with a comprehensive insight into the implementation and advantages of our Canadian dividend growth investing strategy. This evidence-based, unbiased approach empowers DIY investors to outperform both actively managed dividend funds and passively managed indexes and dividend ETFs over longer-term horizons.
For those interested in something more, please upgrade to a paid subscriber; you get the enhanced weekly newsletter, access to premium content, full privileges on the new Substack website magicpants.substack.com and DGI alerts whenever we make stock transactions in our portfolio.
Performance of ‘The List’
Last week, ‘The List’ was down slightly from the previous week with a YTD price return of +1.1% (capital). Dividends were up and have increased by +4.3% YTD, highlighting the growth in our income.
The best performers last week on ‘The List’ were TFI International (TFII-N), up +7.11%; Thomson Reuters (TRI-N), up +5.05%; and Manulife Financial (MFC-T), up +3.29%.
Bell Canada (BCE-T) was the worst performer last week, down -5.09%.
| SYMBOL | COMPANY | YLD | PRICE | YTD % | DIV | YTD % | STREAK |
|---|---|---|---|---|---|---|---|
| ATD-T | Alimentation Couche-Tard Inc. | 0.9% | $81.13 | 5.7% | $0.70 | 17.4% | 14 |
| BCE-T | Bell Canada | 7.9% | $50.52 | -6.8% | $3.99 | 3.1% | 15 |
| BIP-N | Brookfield Infrastructure Partners | 4.4% | $31.15 | 1.5% | $1.62 | 5.9% | 15 |
| CCL-B-T | CCL Industries | 1.9% | $56.56 | -2.2% | $1.06 | 0.0% | 22 |
| CNR-T | Canadian National Railway | 2.0% | $173.01 | 3.7% | $3.38 | 7.0% | 28 |
| CTC-A-T | Canadian Tire | 5.0% | $141.02 | 1.8% | $7.00 | 1.4% | 13 |
| CU-T | Canadian Utilities Limited | 6.0% | $29.91 | -6.9% | $1.79 | 0.0% | 52 |
| DOL-T | Dollarama Inc. | 0.3% | $100.70 | 6.0% | $0.28 | 5.8% | 13 |
| EMA-T | Emera | 6.1% | $46.75 | -8.0% | $2.87 | 3.0% | 17 |
| ENB-T | Enbridge Inc. | 8.0% | $46.03 | -4.9% | $3.66 | 3.1% | 28 |
| ENGH-T | Enghouse Systems Limited | 2.4% | $36.29 | 6.8% | $0.88 | 4.1% | 17 |
| FNV-N | Franco Nevada | 1.3% | $108.84 | -1.2% | $1.44 | 5.9% | 16 |
| FTS-T | Fortis Inc. | 4.5% | $52.56 | -4.2% | $2.36 | 3.3% | 50 |
| IFC-T | Intact Financial | 2.1% | $208.84 | 2.7% | $4.40 | 0.0% | 19 |
| L-T | Loblaw Companies Limited | 1.3% | $134.00 | 4.2% | $1.78 | 2.4% | 12 |
| MFC-T | Manulife Financial | 4.8% | $30.41 | 5.3% | $1.46 | 0.0% | 10 |
| MGA-N | Magna | 3.4% | $54.69 | -1.5% | $1.84 | 0.0% | 14 |
| MRU-T | Metro Inc. | 1.9% | $69.26 | 1.1% | $1.34 | 10.7% | 29 |
| RY-T | Royal Bank of Canada | 4.2% | $131.01 | -1.5% | $5.52 | 3.4% | 13 |
| SJ-T | Stella-Jones Inc. | 1.2% | $79.36 | 3.6% | $0.92 | 0.0% | 19 |
| STN-T | Stantec Inc. | 0.7% | $109.48 | 4.6% | $0.78 | 2.0% | 12 |
| T-T | Telus | 6.4% | $23.64 | -0.3% | $1.50 | 5.2% | 20 |
| TD-T | TD Bank | 5.1% | $79.88 | -5.7% | $4.08 | 6.3% | 13 |
| TFII-N | TFI International | 1.1% | $142.30 | 8.5% | $1.60 | 10.3% | 13 |
| TIH-T | Toromont Industries | 1.4% | $119.45 | 5.9% | $1.72 | 0.0% | 34 |
| TRI-N | Thomson Reuters | 1.4% | $158.63 | 10.7% | $2.16 | 10.2% | 30 |
| TRP-T | TC Energy Corp. | 7.4% | $50.48 | -3.5% | $3.72 | 0.0% | 23 |
| WCN-N | Waste Connections | 0.7% | $156.71 | 5.8% | $1.14 | 8.6% | 14 |
| Averages | 3.3% | 1.1% | 4.3% | 21 |
Note: Stocks ending in “-N” declare earnings and dividends in US dollars. To achieve currency consistency between dividends and share price for these stocks, we have shown dividends in US dollars and share price in US dollars (these stocks are listed on a US exchange). The dividends for their Canadian counterparts (-T) would be converted into CDN dollars and would fluctuate with the exchange rate.
DGI Clipboard
“In a one-year timeframe, Dividend Kings estimates that merely 5% of total returns are explained by fundamentals and valuation. But over time, market sentiment tends to more appropriately reflect fundamentals.”
– The Dividend Kings, Seeking Alpha Contributor
Reconciliation Principle: Returns and Forecasts Must Add Up.
Crestmont Research has introduced the ‘Reconciliation Principle’ as a tool for forecasting future stock market returns and evaluating the accuracy of past predictions made by analysts and pundits.
According to Crestmont, conventional wisdom suggests that stock market returns are essentially random and cannot be reliably forecasted in the short term (spanning days, weeks, months, or even a few years). However, they argue that short-term fluctuations can deviate temporarily from long-term principles that hold true over extended periods. Interestingly, stock market returns exhibit a high degree of predictability on either side of a decade.
We’ve observed a similar pattern with our Dividend Growth Investing (DGI) strategy and our ten-year compound annual growth rate charts, utilizing the stocks we monitor on ‘The List’. Initially, we were uncertain about the reasons behind this predictability until we came across an article by Ed Easterling at Crestmont Research. This predictability arises from the underlying components that drive stock market returns.
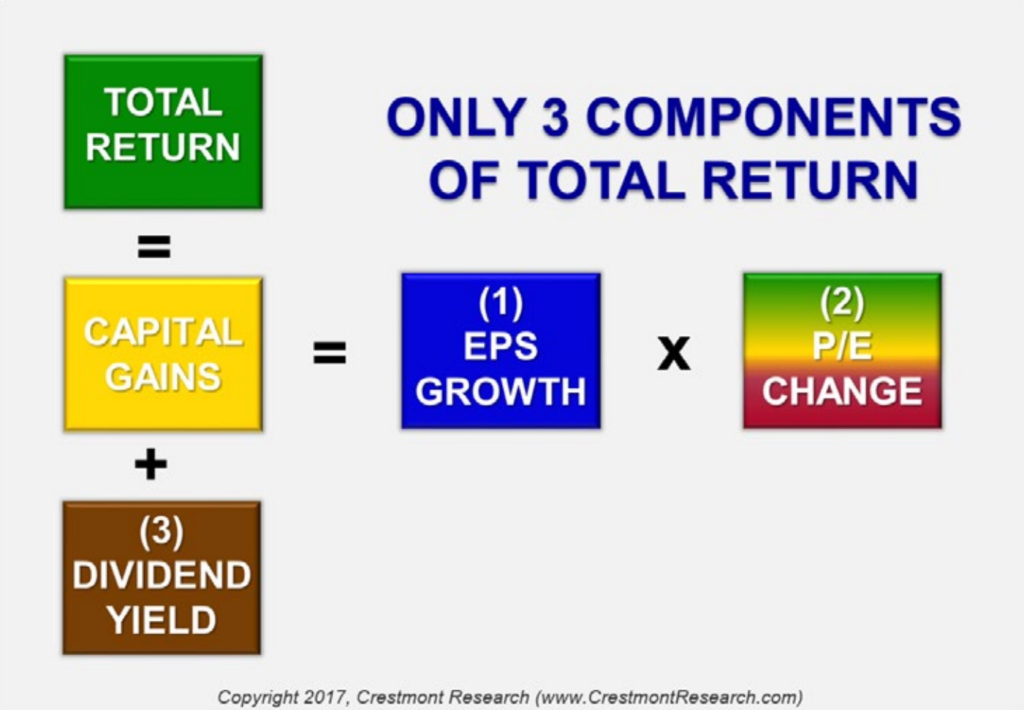
Source: Crestmont Research
These components—Earnings Per Share Growth (EPS), Price-to-Earnings Change (+/- Change in P/E), and Dividend Yield—are metrics we also monitor closely. We substitute Dividend Growth with EPS Growth, as they often align, to construct our dividend growth magic formula.
The formula for forecasting future market returns thus becomes: Future Market Returns = Dividend Yield + Dividend Growth +/- Change in P/E Ratio.
Now, let’s employ the current iteration of ‘The List’ to evaluate the validity of Crestmont’s Reconciliation Principle retrospectively.
Ten Year Compound Annual Growth Rates of ‘The List’:
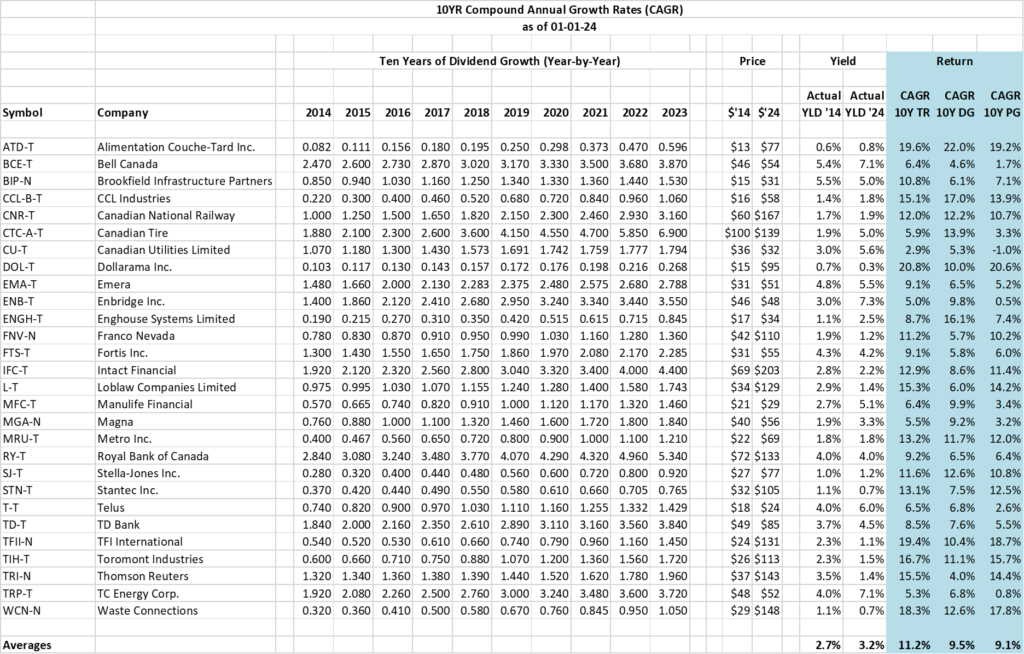
Source: Magic Pants Dividend Growth Investing
In 2014, ‘The List’ began with a yield of 2.7%. Over the past decade, it experienced an average annual dividend growth rate of 9.5%. Adding these figures together yields a total return of 12.2%. However, the actual total return of ‘The List’ stood at 11.2%.
According to Ed Easterling, the 1% disparity in total return (12.2% – 11.2%) is attributable to changes in the price-to-earnings ratio (P/E) between January 2014 and January 2024.
Using the reconciliation principle, projecting returns for the next decade can be simplified by combining the current starting yield of 3.7% with the anticipated annualized dividend growth rate of ‘The List’ (estimated between 8% and 10%), provided there are no significant shifts in the P/E ratio over the next ten years.
Developing a thorough understanding of how our Dividend Growth Investing (DGI) strategy interacts with these market dynamics and their potential outcomes will enable investors to employ our strategy, make informed decisions, and maintain confidence in what we do over the long haul.
In this week’s full edition of our newsletter, discover which companies on ‘The List’ recently disclosed earnings and dividend announcements. Preview upcoming earnings reports and what two factors will boost revenue at Thomson Reuters in the years to come.
Check us out on magicpants.substack.com for more info in this week’s issue….
