Last updated by BM on February 5, 2024
Summary
This is a weekly installment of our MP Market Review series, which provides updates on the financial markets and Canadian dividend growth companies we monitor on ‘The List’.
- Last week, ‘The List’ was down slightly from the previous week with a YTD price return now of +1.9% (capital). Dividends were up and have increased by +3.8% YTD, highlighting the growth in our income.
- Last week, there were three dividend announcements from companies on ‘The List’.
- Last week, there were two earnings reports from companies on ‘The List’.
- Seven companies on ‘The List’ are due to report earnings this week.
DGI Scoreboard
The List (2024)
The Magic Pants 2024 list includes 28 Canadian dividend growth stocks. Here are the criteria to be considered a candidate on ‘The List’:
- Dividend growth streak: 10 years or more.
- Market cap: Minimum one billion dollars.
- Diversification: Limit of five companies per sector, preferably two per industry.
- Cyclicality: Exclude REITs and pure-play energy companies due to high cyclicality.
Based on these criteria, companies on ‘The List’ are added or removed annually on Jan. 1. Prices and dividends are updated weekly.
While ‘The List’ is not a standalone portfolio, it functions admirably as an initial guide for those seeking to broaden their investment portfolio and attain superior returns in the Canadian stock market. Our newsletter provides readers with a comprehensive insight into the implementation and advantages of our Canadian dividend growth investing strategy. This evidence-based, unbiased approach empowers DIY investors to outperform both actively managed dividend funds and passively managed indexes and dividend ETFs over longer-term horizons.
For those interested in something more, please upgrade to a paid subscriber; you get the enhanced weekly newsletter, access to premium content, full privileges on the new Substack website magicpants.substack.com and DGI alerts whenever we make stock transactions in our portfolio.
Performance of ‘The List’
Last week, ‘The List’ was down slightly from the previous week with a YTD price return of +1.9% (capital). Dividend growth is looking as dependable as always. Dividends have increased by +3.8% YTD, highlighting the growth in our income.
The best performers last week on ‘The List’ were Waste Connections (WCN-N), up +2.36%; Canadian National Railway (CNR-T), up +2.34%; and Magna (MGA-N), up +2.31%.
CCL Industries (CCL-B-T) was the worst performer last week, down -2.85%.
| SYMBOL | COMPANY | YLD | PRICE | YTD % | DIV | YTD % | STREAK |
|---|---|---|---|---|---|---|---|
| ATD-T | Alimentation Couche-Tard Inc. | 0.9% | $80.06 | 4.3% | $0.70 | 17.4% | 14 |
| BCE-T | Bell Canada | 7.3% | $53.23 | -1.8% | $3.87 | 0.0% | 15 |
| BIP-N | Brookfield Infrastructure Partners | 4.4% | $31.39 | 2.3% | $1.62 | 5.9% | 15 |
| CCL-B-T | CCL Industries | 1.9% | $57.25 | -1.0% | $1.06 | 0.0% | 22 |
| CNR-T | Canadian National Railway | 2.0% | $170.55 | 2.2% | $3.38 | 7.0% | 28 |
| CTC-A-T | Canadian Tire | 4.8% | $146.32 | 5.6% | $7.00 | 1.4% | 13 |
| CU-T | Canadian Utilities Limited | 5.8% | $30.94 | -3.7% | $1.79 | 0.0% | 52 |
| DOL-T | Dollarama Inc. | 0.3% | $100.31 | 5.6% | $0.28 | 5.8% | 13 |
| EMA-T | Emera | 5.9% | $48.42 | -4.7% | $2.87 | 3.0% | 17 |
| ENB-T | Enbridge Inc. | 7.7% | $47.51 | -1.8% | $3.66 | 3.1% | 28 |
| ENGH-T | Enghouse Systems Limited | 2.4% | $37.18 | 9.4% | $0.88 | 4.1% | 17 |
| FNV-N | Franco Nevada | 1.3% | $107.25 | -2.6% | $1.44 | 5.9% | 16 |
| FTS-T | Fortis Inc. | 4.4% | $53.87 | -1.8% | $2.36 | 3.3% | 50 |
| IFC-T | Intact Financial | 2.1% | $210.72 | 3.6% | $4.40 | 0.0% | 19 |
| L-T | Loblaw Companies Limited | 1.3% | $136.06 | 5.8% | $1.78 | 2.4% | 12 |
| MFC-T | Manulife Financial | 5.0% | $29.44 | 1.9% | $1.46 | 0.0% | 10 |
| MGA-N | Magna | 3.2% | $57.02 | 2.7% | $1.84 | 0.0% | 14 |
| MRU-T | Metro Inc. | 1.9% | $70.55 | 3.0% | $1.34 | 10.7% | 29 |
| RY-T | Royal Bank of Canada | 4.2% | $131.22 | -1.4% | $5.52 | 3.4% | 13 |
| SJ-T | Stella-Jones Inc. | 1.2% | $79.97 | 4.4% | $0.92 | 0.0% | 19 |
| STN-T | Stantec Inc. | 0.7% | $110.88 | 5.9% | $0.78 | 2.0% | 12 |
| T-T | Telus | 6.3% | $23.84 | 0.5% | $1.50 | 5.2% | 20 |
| TD-T | TD Bank | 5.0% | $81.10 | -4.2% | $4.08 | 6.3% | 13 |
| TFII-N | TFI International | 1.2% | $132.85 | 1.3% | $1.60 | 10.3% | 13 |
| TIH-T | Toromont Industries | 1.4% | $119.09 | 5.6% | $1.72 | 0.0% | 34 |
| TRI-N | Thomson Reuters | 1.3% | $151.01 | 5.4% | $1.96 | 0.0% | 30 |
| TRP-T | TC Energy Corp. | 7.1% | $52.58 | 0.5% | $3.72 | 0.0% | 23 |
| WCN-N | Waste Connections | 0.7% | $158.06 | 6.7% | $1.14 | 8.6% | 14 |
| Averages | 3.3% | 1.9% | 3.8% | 21 |
Note: Stocks ending in “-N” declare earnings and dividends in US dollars. To achieve currency consistency between dividends and share price for these stocks, we have shown dividends in US dollars and share price in US dollars (these stocks are listed on a US exchange). The dividends for their Canadian counterparts (-T) would be converted into CDN dollars and would fluctuate with the exchange rate.
DGI Clipboard
“They say that more money has been lost chasing yield than in any other area of investing.”
-Richard Russell
We do not chase dividends. We grow dividends.
Data is starting to pour in about the underperformance of actively managed funds over longer time horizons with one research report from S&P Global showing that close to 95% of Canadian fund managers did not even beat the TSX Composite Index over the ten years to June 30, 2023. This is bad news for the wealth management industry in general but also a bit disappointing when you look at where financial journalists and wealth managers are transitioning their clients.
In response to this, there’s a growing interest in passively managed products in the United States, and it seems that Canada is poised to follow suit in the near future. The financial landscape reflects a shift toward the mentality of “if you can’t beat them, join them.” The distinction between actively managed and passively managed products is becoming increasingly blurred. To illustrate this shift, we’ll examine a top-performing dividend fund alongside a popular dividend ETF.
Here are the ten-year cumulative returns of the index, a top actively managed dividend fund and a passively managed dividend ETF:
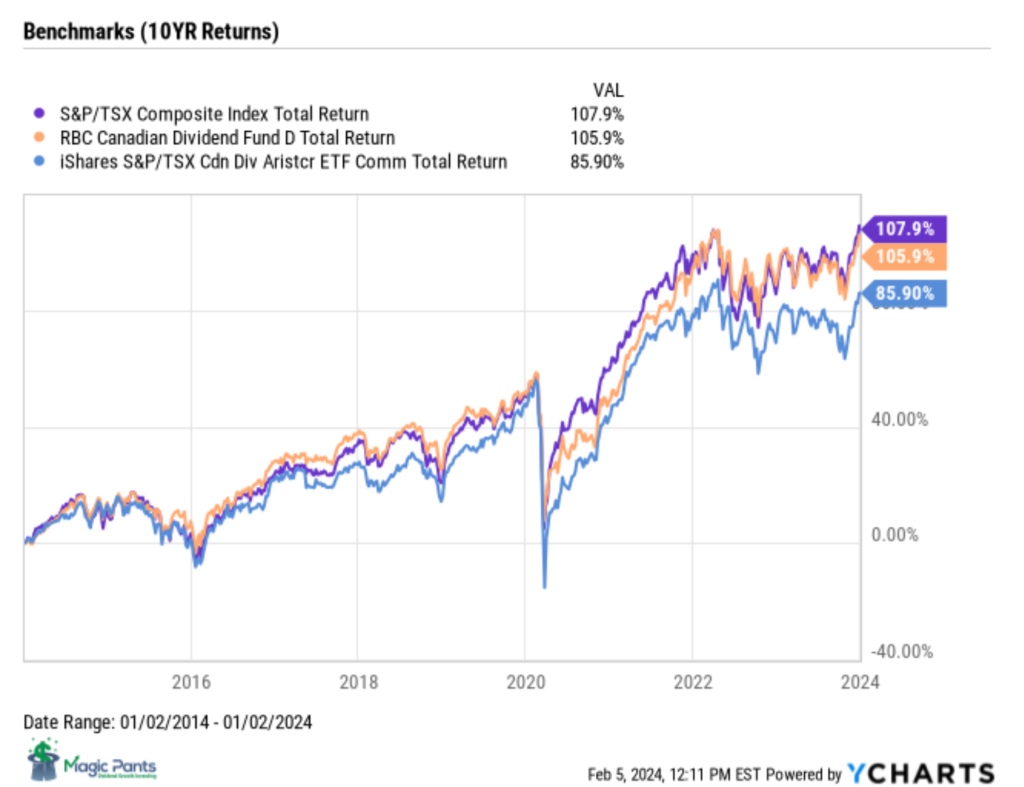
Source: YCHARTS
Observe how they all cluster around the purple line, representing the S&P/TSX Composite Index.
My mentor Tom Connolly believes that most professional managers can’t afford to be wrong, so they must, generally, buy/do what the other pros do. Warren Buffett seems to agree.
“The failure of most professional managers to exceed the major indexes is not a reflection of intelligence, Buffett says, but a symptom of the institutional decision-making process. According to Buffett, most institutional decisions are made by group or committees who possess a strong desire to conform to generally accepted portfolio safeguards. The institution that compensates the money manager equates safe with average. Adherence to standard diversification practices, rational or irrational, is rewarded over independent thinking.”
– Hagstrom, R. G. (1994). The Warren Buffett Way. [John Wiley & Sons]. (p. 73, Chapter 3, Mr. Market and the Lemmings).
Although we already knew that wealth managers like to ‘herd’, do what other professionals do, we were surprised to find that even the dividend products offered by the wealth management industry were underperforming. To understand why, we looked under the hood at the makeup and mandates of these benchmark products and compared them to our own dividend growth investing portfolio.
The S&P/TSX Composite Index comprises two hundred and twenty-five companies, both dividend and non-dividend payers, with an average yield of 3.15%. This market-capitalization-weighted index provides a comprehensive representation of the Canadian equity market, serving as a benchmark for assessing its overall health and trends across various sectors.
The TSX Canadian Dividend Aristocrat Index consists of ninety companies with an average yield of 4.1%. Eligibility criteria include a minimum market cap of $300 million and a 5-year dividend growth record.
The RBC Canadian Dividend Fund currently holds sixty-six companies with an average yield of 3.8%. This fund focuses on companies with above-average dividend yields and may allocate up to 25% of its assets to foreign securities.
Our dividend growth investing portfolio, MP Wealth-Builder Portfolio (CDN), features only twenty carefully selected companies with an average yield of 3.4%. Chosen from a pre-screened list of companies, our criteria include quality indicators like Value Line and S&P ratings, a minimum market cap of $1 billion, a 10-year dividend growth record, alignment of dividend growth with price growth, diversification across sectors and industries, and exclusion of highly cyclical companies.
10YR Comparative Returns showing $100K invested on January 1, 2014:
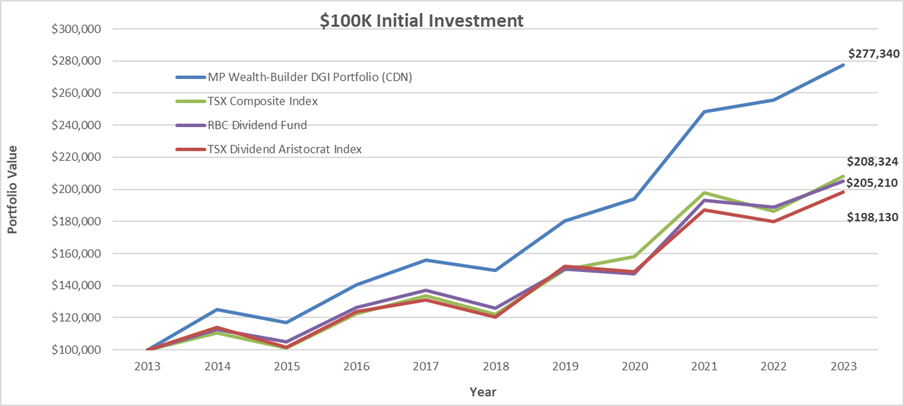
Source: S&P Global and Magic Pants Dividend Growth Investing
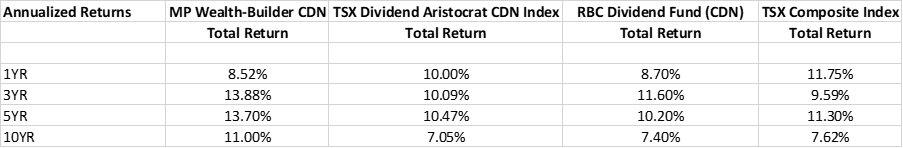
The outperformance of our dividend growth investing portfolio becomes more pronounced with a longer investment horizon, and this can be attributed to key distinctions in our investment strategy:
- We prioritize quality over quantity evident in the select number of companies in our portfolios compared to the benchmark products.
- We emphasize growing yields rather than above-average starting yields distinguishing our approach from most dividend funds and ETFs that focus on high initial yields without recognizing that dividend growth drives prices higher over time, not the starting yield.
Let’s spread the word within the wealth management industry that there’s a superior way to match and surpass indexes—introducing dividend growth investing. We provide a dividend growth model portfolio for DIY investors as part of a paid subscription.
Check us out on magicpants.substack.com for more info in this week’s issue….
