Posted by BM on April 20, 2022
Each month we walk through our valuation process using a stock on ‘The List’ that meets our minimum screen of 6.5% EPS Yield. The company we will review today is TFI International (TFII-T).
A fair valuation is the second rule in our three-step process. Buying when our quality stocks are sensibly priced will help ensure our future investment returns meet our expectations. We rely heavily on the fundamental analyzer software tool (FASTgraphs) to help us understand the fundamentals of the stocks we invest in and then read the company’s website for investor presentations and recent earnings reports to learn more.
Intro:
TFI International Inc is a transportation and logistics company located in Canada. The company organizes itself into four segments: package and courier, less-than-truckload, truckload, and logistics. The package and courier segment picks up, transports, and delivers items across North America. The less-than-truckload segment transports smaller loads. The truckload segment transports goods by flatbed trucks, containers, or a more specialized service. The company provides general logistics services through the logistics segment. TFI International derives the majority of revenue domestically, followed by the United States.

Historical Graph:
Comments:
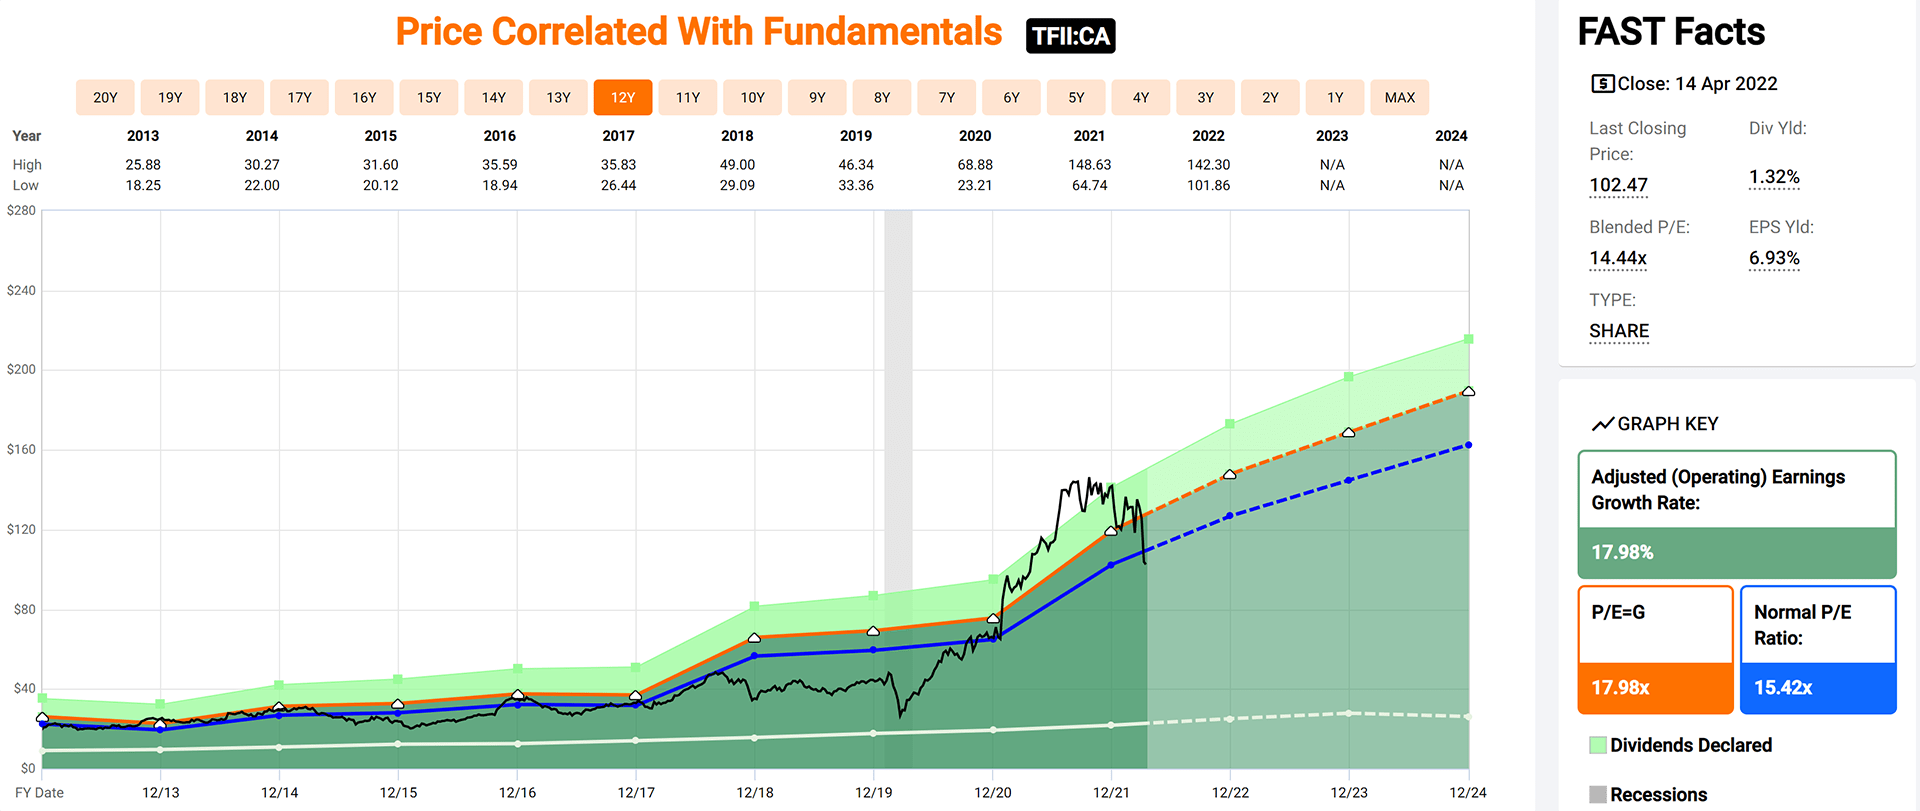
TFI International has a narrow valuation corridor. As you can see from the Blue Line on the graph (Normal P/E) and the Black Line (Price), there seems to be a correlation between Price and P/E. A price below the average P/E line has historically been a good entry point for TFII-T.
The fundamentals show a company whose earnings have grown steadily over the last ten years at an annualized rate of ~17.98%.
Performance Graph:
Comments:
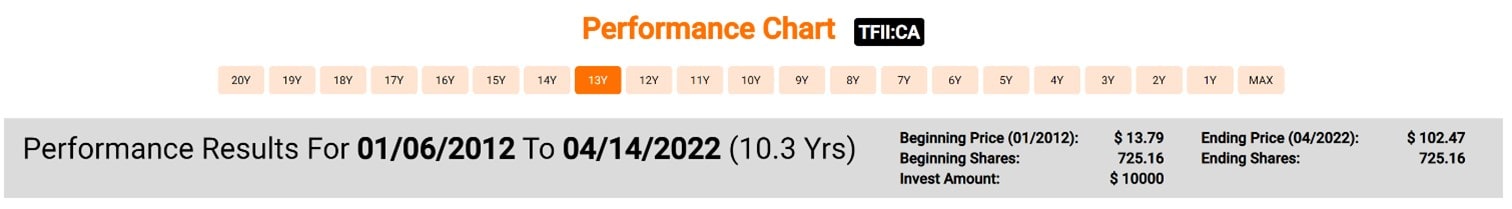
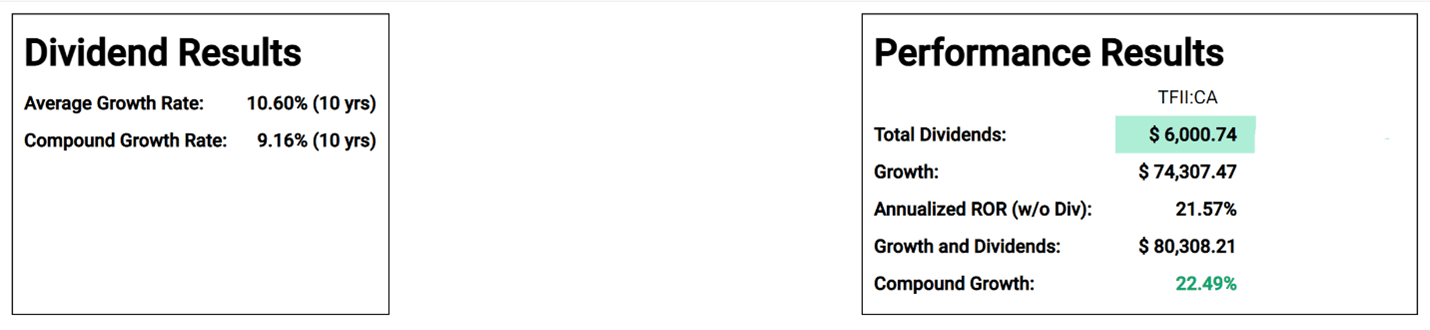
TFI International has an annualized dividend growth rate of 9.16% over the last ten years. The company also has an annualized total return of 22.49% over that period. TFII-T recently announced a dividend increase of ~17.4% for 2022 which is almost double their ten-year growth rate.
Estimated Earnings:

Comments:
Using the “Normal Multiple’ estimating tool from FASTgraphs, we see a blended P/E average over the last five years of 14.91. Based on Analysts’ forecasts two years out, they are estimating an annualized return, based on today’s price, of 21.28% should TFII-T trade at its five-year average blended P/E.
Blended P/E is based upon a weighted average of the most recent actual value and the closest forecast value.
Of importance is that analysts have been revising their estimates upwards recently. Both the six and three months ago projections for 2022 and 2023 have been increasing. It means that analysts are bullish on TFI International in the short term.
Analyst Scorecard:
Comments:
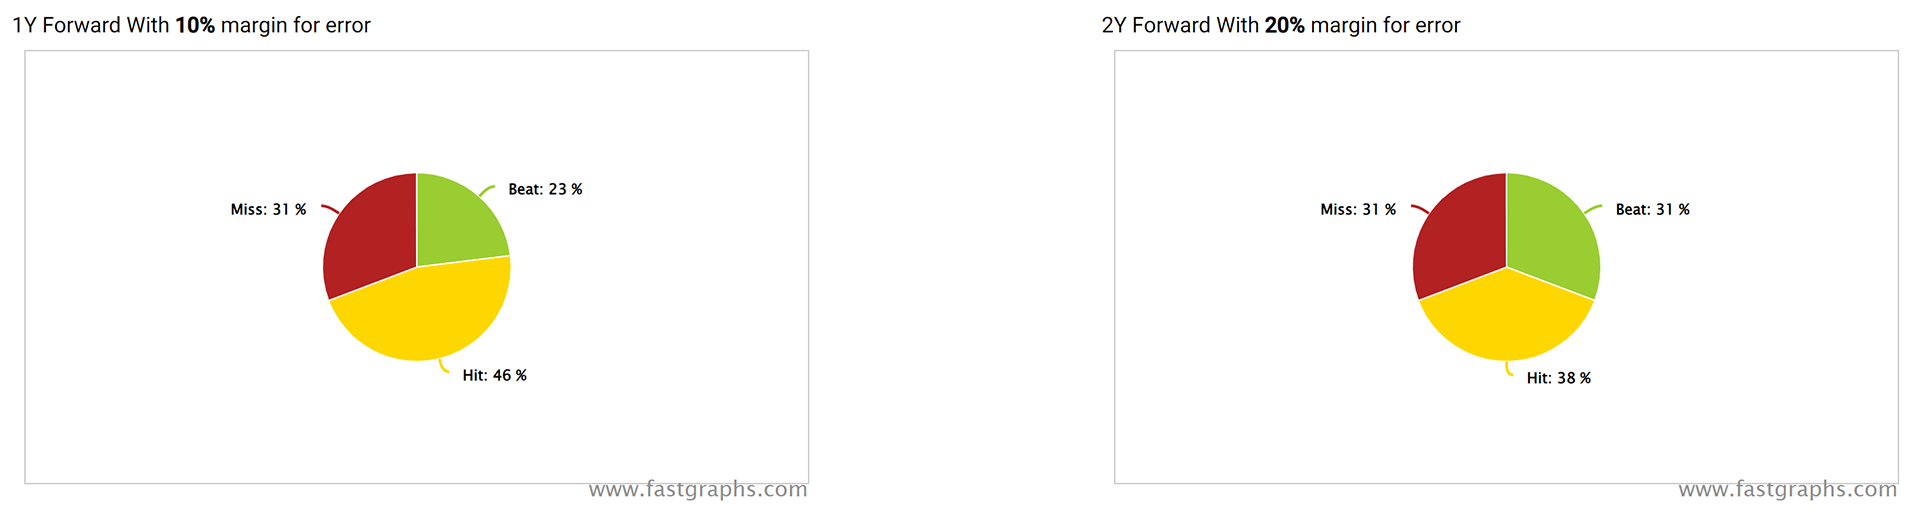
Analyst performance on hitting estimates over the years are above average on one and two-year earnings projections. Analysts’ projections have hit or beat ~69% of the time on one-year estimates and ~69% on two-year estimates.
Recent Earnings Report-Full Year and Q4 2021:
“TFI International completed a highly successful year that featured our transformational acquisition of UPS Ground Freight, which is already helping to drive our robust financial results reported today. During the fourth quarter, our operating income grew 84% and our adjusted diluted EPS grew 60%,” said Alain Bédard, Chairman, President and Chief Executive Officer. “It is gratifying to see all our business segments delivering year-over-year growth in revenues and operating income, on the tremendous efforts of our thousands of talented team members. By focusing through the pandemic on our longstanding operating principles that emphasize efficiency, strong cash flow, and the strategic allocation of capital, we have entered the new year stronger than ever. I am therefore confident that regardless of operating conditions, our proven approach to the business and the synergies still to come from our rebranded TForce Freight position us well over the long term, for additional growth, superior customer service, and the continued creation of shareholder value.”
Q4 2021 Highlights:
- Total revenue of $2.14 billion was up 91% and, revenue before fuel surcharge of $1.89 billion was up 80% compared to the prior year period.
- Operating income grew 84% to $215.0 million from $117.1 million the prior year period, primarily driven by acquisitions, strong execution across the organization, increased quality of revenue, an asset-right approach, and cost efficiencies.
- Net income grew 67% to $144.1 million from $86.3 million the prior year period, and net income of $1.52 per diluted share was up relative to $0.91 the prior year period. Adjusted net income, a non-IFRS measure, was $148.6 million, or $1.57 per diluted
- share, as compared to $93.4 million, or $0.98 per diluted share, the prior year period.
- Total revenue grew for all segments relative to the prior year period with increases of 6% for Package and Courier, 509% for Less-Than-Truckload, 22% for Truckload and 35% for Logistics. Operating income was also higher across all segments in thefourth quarter in comparison to the prior-year.
Full Year 2021 Highlights:
- Total revenue was $7.22 billion for 2021 versus $3.78 billion in 2020. Revenue before fuel surcharge of $6.47 billion was up 86% compared to the prior year.
- Operating income totaled $889.2 million, or 14% of revenue before fuel surcharge, an increase of 113% compared to $416.6 million and 12% of revenue before fuel surcharge in the prior year. The increase is mainly attributable to the contributions from acquisitions, including a bargain purchase gain of $193.5 million, and despite a decrease in the Canadian Emergency Wage Subsidy of $40.0 million and an expense recognized on the mark-to-market of the DSUs of $22.9 million.
- Net income was $664.4 million, or $6.97 per diluted share, compared to $275.7 million, or $3.03 per diluted share a year earlier. Adjusted net income and Adjusted EPS, non-IFRS measures, were $498.3 million, or $5.23 per diluted share, compared to $299.8 million, or $3.30 per diluted share the prior year period.
- During 2021, total revenue grew 21% for Package and Courier, 378% for Less-Than-Truckload, 24% for Truckload and 76% for Logistics relative to the prior year. Operating income was up 38% for Package and Courier, 449% for Less-Than-Truckload, 12% for Truckload and 69% for Logistics.
Summary:
TFI International (TFII-T) was a known entity to me when I worked in the technology sector. One of our target markets was the trucking industry. TFI International was acquiring our customers and prospects at a rapid pace, and they seemed to integrate their acquisitions very well. As an investor, they first came on our radar in 2020 when we noticed that they were knocking on the door of becoming a DGI candidate and meeting our ten-year dividend growth streak criteria. We were fortunate to initiate a position at that time and ride the ecommerce wave over the next few years. During that time, TFI International continued to acquire and integrate, growing their earnings at an even faster rate. It has only been recently that the company’s fundamentals and stock price came back in alignment.
Coming off an amazing 2021 with an over 100% return on its stock price, it was only a matter of time until TFII-T’s P/E came back closer to its historical average. As of last Thursday, the company’s stock price was down ~-27% YTD bringing its P/E down below its ten-year average.
Trucking likes high growth and high inflation economies both of which are under pressure currently. Short term investors looking to initiate or add to their positions must be aware that both growth and inflation rates of change are decelerating which means there may be more bad news to come for this sector. Longer term investors are watching carefully. Based on the fundamentals alone, the company appears ‘sensibly priced’ today.

Comments are closed.