Last updated by BM on November 13, 2023
Summary
- This is a weekly installment of our MP Market Review series, which provides updates on the financial markets and Canadian dividend growth companies we monitor on ‘The List’.
- Last week, ‘The List’ was up over last week with a YTD price return of +1.4% (capital). Dividend growth remained the same and is now at +8.8% YTD, highlighting income growth this year.
- Last week, one dividend increase from companies on ‘The List’.
- Last week, nine earnings reports from companies on ‘The List’.
- Two companies on ‘The List’ are due to report earnings this week.
- If you’re interested in creating your own dividend growth income portfolio, consider subscribing to our premium service, which grants you access to the MP Wealth-Builder Model Portfolio (CDN) and exclusive subscriber-only content. Learn More

Identifying companies whose dividend growth aligns closely with price growth can considerably enhance the predictability of future returns. Dividend growth investors know that the dividend drives the price in a predictable way, not the other way around. Fortis Inc. (FTS-T) is another company on ‘The List’ that aligns very closely with this dividend growth vs price growth pattern we like to see.
Introduction
“You have a pair of pants. In the left pocket, you have $100. You take $1 out of the left pocket and put it in the right pocket. You now have $101. There is no diminution of dollars in your left pocket. That is one magic pair of pants.”
This ‘magic pants’ analogy was from a Seeking Alpha article on dividend investing I read about a decade ago and was one of the catalysts for me to take a closer look at this type of investing and see if it truly was magical.
After conducting additional research, I have shifted towards utilizing a dividend growth investing (DGI) strategy as my primary investment approach. While I maintain portfolios consisting of high-quality dividend growers from both the United States and Canada, I have opted to concentrate on Canadian (CDN) dividend growth companies in this blog. This is due to several reasons, including a smaller pool of DGI companies to track, a lack of coverage for the DGI strategy by the North American investment media, and a tendency for those who do cover DGI to narrowly focus on only a handful of sectors (Energy and Financials).
While ‘The List’ is not a portfolio in itself, it serves as an excellent initial reference for individuals seeking to diversify their investments and attain higher returns in the Canadian stock market. Through our blog, we provide weekly updates on ‘The List’ and offer valuable perspectives and real-life examples of the dividend growth investing strategy in practice. This helps readers gain a deeper understanding of how to implement and benefit from this investment approach.
DGI Clipboard
“As a dividend increase is a positive sign of a company’s financial strength, the safest purchase, after research, is a stock with a recent dividend increase.”
– Tom Connolly (the founder of dividendgrowth.ca)
Dividends send signals

Our list of high-quality dividend stocks is currently in the process of revealing upcoming dividend increases for the next year. While the past couple of years have presented challenges for capital returns, the steady growth of dividends remains a reassuring trend. As we analyze ‘The List,’ it becomes evident that dividends are conveying valuable signals that can inform our decision-making when it comes to purchases.
In his 2006 article, ‘Go for Dividends’, author Steve Hanke says it best:
“The positive, intuitive idea is that companies adjust dividend payouts to signal prospects. Corporate insiders have better information about potential sales growth, margins and free cash flows than investors do. Dividends are simply an efficient way for insiders to convey this valuable information to the market. A rise in dividends signals better prospects, and a decrease signals that a company expects trouble. An increase in dividends signals that corporate insiders believe the company will have enough cash flow to sustain operations and complete investment plans. And, of course, make good on their dividend commitments.”
It’s important to consider the size of the dividend increase. If a company announces a smaller increase than in the previous year, it may suggest impending short-term challenges. This could either reflect prudent management or serve as a signal that all is not well.
Here are a couple of recent dividend announcements as examples:
Waste Connections (WCN-N) on Wednesday, October 25th, said it increased its 2023 quarterly dividend from $0.255 to $0.285 per share, payable November 28, 2023, to shareholders of record on November 8, 2023.
This represents a dividend increase of +11.8%, marking the 14th straight year of dividend growth for this quality solid waste and recycling services company.
(WCN-N) raised its dividend by +10.5% in the past year, maintaining a five-year average increase of +13.7%. The announced increase for next year (+11.8%) aligns with its historical average, suggesting that management is expressing confidence in the company’s outlook.
Canadian Tire (CTC-A-T) on Thursday, November 9, said it increased its 2024 quarterly dividend from $1.725 to $1.750 per share, payable March 01, 2024, to shareholders of record on January 31, 2024.
This represents a dividend increase of +1.45%, marking the 13th straight year of dividend growth for this quality retailer.
On the flip side, (CTC-A-T) raised its dividend by +17.9% in the past year, maintaining a five-year average increase of +15.8%. The modest increase for next year (+1.45%) suggests that management is expressing heightened caution about their prospects in 2024. Nonetheless, their commitment to sustaining their dividend streak remains evident.
In both cases, you see a commitment to not only paying a dividend but growing that dividend. Not all companies on ‘The List’ consistently raise their dividends by the same rate each year so pay attention to the signals!
If you have not yet joined as a paid subscriber of the blog to receive DGI Alerts on the activity and content related to our model portfolio, it’s not too late. Click Here.
Recent News
Are there any dividend growth stocks that haven’t been pounded this year? (Globe & Mail)
I couldn’t help but leave a comment for the author.
When you mention dividend growth you should not put so much attention on initial yield. This is where you make your mistake. There are several good Canadian dividend growth stocks that have performed well this year if you do not start your ‘screen’ with such a high initial yield. After all, it is the dividend growth that drives the price growth not the starting yield. Stella Jones (SJ); Stantec (STN); Alimentation Couche-Tard Inc. (ATD); Dollarama Inc. (DOL) all have capital returns over 20% YTD. Magically, the average dividend growth of this list is 17% YTD as well.
To receive breaking news about companies on ‘The List’, follow us on Twitter @MagicPants_DGI.
The List (2023)
Last updated by BM on November 10, 2023
The Magic Pants List contains 27 Canadian dividend growth stocks. ‘The List’ contains Canadian companies that have raised their dividend yearly for at least the last ten years and have a market cap of over a billion dollars. Below is each stock’s symbol, name, current yield, current price, price return year-to-date, current dividend, dividend growth year-to-date and current dividend growth streak. Companies on ‘The List’ are added or subtracted once a year, on January 1. After that, ‘The List’ is set for the next twelve months. Prices and dividends are updated weekly.
| SYMBOL | COMPANY | YLD | PRICE | YTD % | DIV | YTD % | STREAK |
|---|---|---|---|---|---|---|---|
| AQN-N | Algonquin Power & Utilities | 9.0% | $5.61 | -16.6% | $0.51 | -29.0% | 12 |
| ATD-T | Alimentation Couche-Tard Inc. | 0.7% | $78.65 | 30.8% | $0.56 | 19.1% | 13 |
| BCE-T | Bell Canada | 7.3% | $53.12 | -11.8% | $3.87 | 5.2% | 14 |
| BIP-N | Brookfield Infrastructure Partners | 4.4% | $25.53 | -18.5% | $1.44 | 6.3% | 15 |
| CCL-B-T | CCL Industries | 2.0% | $53.96 | -7.0% | $1.06 | 10.4% | 21 |
| CNR-T | Canadian National Railway | 2.1% | $154.14 | -5.4% | $3.16 | 7.8% | 27 |
| CTC-A-T | Canadian Tire | 4.9% | $140.31 | -4.3% | $6.90 | 17.9% | 12 |
| CU-T | Canadian Utilities Limited | 5.8% | $30.71 | -16.9% | $1.79 | 1.0% | 51 |
| DOL-T | Dollarama Inc. | 0.3% | $98.87 | 23.8% | $0.27 | 23.8% | 12 |
| EMA-T | Emera | 5.9% | $48.08 | -8.6% | $2.82 | 5.0% | 16 |
| ENB-T | Enbridge Inc. | 7.7% | $46.10 | -13.6% | $3.55 | 3.2% | 27 |
| ENGH-T | Enghouse Systems Limited | 2.5% | $34.07 | -4.6% | $0.85 | 18.2% | 16 |
| FNV-N | Franco Nevada | 1.1% | $119.40 | -13.6% | $1.36 | 6.3% | 15 |
| FTS-T | Fortis Inc. | 4.1% | $55.70 | 0.7% | $2.29 | 5.3% | 49 |
| IFC-T | Intact Financial | 2.1% | $206.37 | 5.4% | $4.40 | 10.0% | 18 |
| L-T | Loblaws | 1.4% | $121.31 | 0.8% | $1.74 | 13.2% | 11 |
| MGA-N | Magna | 3.5% | $52.62 | -8.5% | $1.84 | 2.2% | 13 |
| MRU-T | Metro | 1.6% | $74.53 | -1.3% | $1.21 | 10.0% | 28 |
| RY-T | Royal Bank of Canada | 4.6% | $116.78 | -8.8% | $5.34 | 7.7% | 12 |
| SJ-T | Stella-Jones Inc. | 1.1% | $83.03 | 67.5% | $0.92 | 15.0% | 18 |
| STN-T | Stantec Inc. | 0.8% | $94.66 | 44.9% | $0.77 | 8.5% | 11 |
| TD-T | TD Bank | 4.7% | $81.96 | -6.5% | $3.84 | 7.9% | 12 |
| TFII-N | TFI International | 1.3% | $111.59 | 11.4% | $1.40 | 29.6% | 12 |
| TIH-T | Toromont Industries | 1.5% | $112.99 | 15.6% | $1.68 | 10.5% | 33 |
| TRP-T | TC Energy Corp. | 7.5% | $49.49 | -7.1% | $3.69 | 3.4% | 22 |
| T-T | Telus Corp. | 6.0% | $23.79 | -9.6% | $1.43 | 7.4% | 19 |
| WCN-N | Waste Connections | 0.8% | $130.54 | -0.9% | $1.05 | 10.5% | 13 |
| Averages | 3.5% | 1.4% | 8.8% | 19 |
Six Canadian stocks on ‘The List’ declare earnings and dividends in US dollars and are inter-listed on a US exchange in US dollars. The simplest way to display dividend and price metrics for these stocks is to show their US exchange symbols along with their US dividends and price. The stocks I am referring to have a -N at the end of their symbols. You can still buy their Canadian counterparts (-T), but your dividends will be converted into CDN dollars and will fluctuate based on the exchange rate.
Note: When the dividend and share price currency match, the calculation is straightforward. But it’s not so simple when the dividend is declared in one currency, and the share price is quoted in another. Dividing the former by the latter would produce a meaningless result because it’s a case of apples and oranges. To calculate the yield properly, you must express the dividend and share price in the same currency.
Performance of ‘The List’
Feel free to click on this link, ‘The List’ for a sortable version from our website.
Last week, ‘The List’ was up over last week with a YTD price return of +1.4% (capital). Dividend growth remained the same and is at +8.8% YTD, highlighting growth in income.
The best performers last week on ‘The List’ were Stella-Jones Inc. (SJ-T), up +11.32%; Stantec Inc. (STN-T), up +8.72%; and Intact Financial (IFC-T), up +3.79%.
Brookfield Infrastructure Partners (BIP-N) was the worst performer last week, down -5.58%.
Dividend Increases
“The growth of dividend paying ability is of significance in the determination of a stock’s quality, or general safety…”
– Arnold Bernhard (the founder of Value Line)
One company on ‘The List’ announced a dividend increase last week.
Canadian Tire (CTC-A-T) on Thursday said it increased its 2024 quarterly dividend from $1.725 to $1.750 per share, payable March 01, 2024, to shareholders of record on January 31, 2024.
This represents a dividend increase of +1.45%, marking the 13th straight year of dividend growth for this quality retailer.
Earnings Releases
Benjamin Graham once remarked that earnings are the principal factor driving stock prices.
Each quarter, we will provide readers with weekly earnings updates of stocks on ‘The List’ during the calendar earnings season.
The updated earnings calendar can be found here.
Earnings growth and dividend growth tend to go hand in hand, so this information can tell us a lot about the future dividend growth of our quality companies. Monitoring our dividend growers periodically is part of the process, and reading the quarterly earnings releases is a good place to start.
Two earnings reports from companies on ‘The List’ this week
Loblaw Companies Limited (L-T) will release its third-quarter fiscal 2023 results on Wednesday, November 15, 2023, before markets open.
Metro Inc. (MRU-T) will release its fourth-quarter fiscal 2023 results on Wednesday, November 15, 2023, before markets open.
Last week, nine earnings reports from companies on ‘The List’.
Stella-Jones Inc. (SJ-T) released its third-quarter fiscal 2023 results on Tuesday, November 07, 2023, before markets opened.
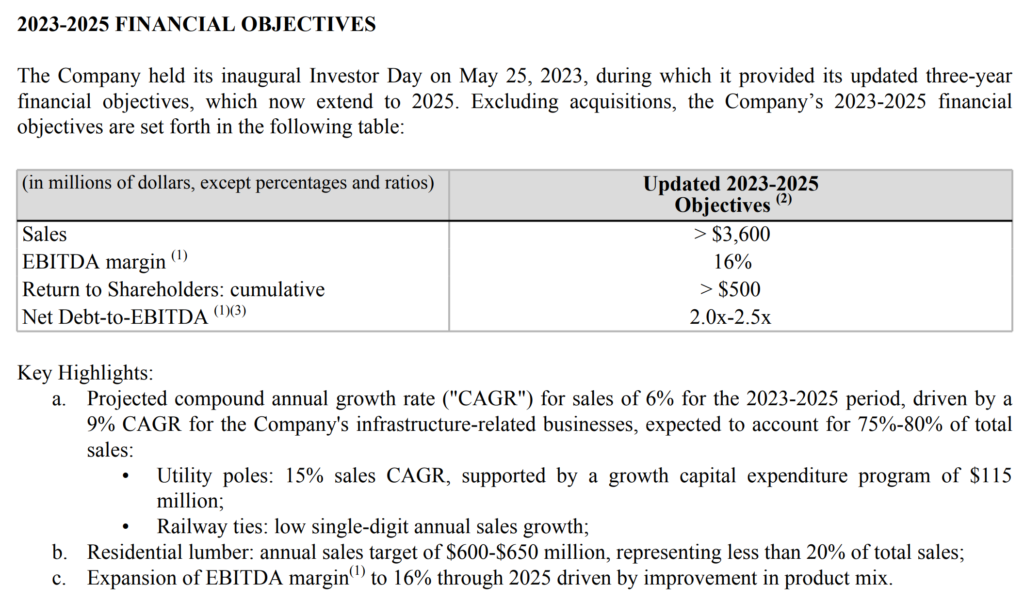
“In Q3, Stella-Jones made notable progress in its growth trajectory, delivering not only another quarter of strong sales growth, but record increase in profitability.”
– Eric Vachon, President and Chief Executive Officer
Highlights:
- Sales of $949 million, up 13%
- 17% organic sales growth in infrastructure-related businesses
- EBITDA of $193 million, or a margin of 20.3%, up from 14.1% in Q3 2022
- Net income of $110 million, or $1.91 per share, up 79% from EPS in Q3 2022
- Acquired utility pole manufacturing business of Baldwin Pole and Piling (“Baldwin”)
- Normal Course Issuer Bid announced for 2023-2024
Outlook:
Source: (SJ-T) Q3-2023 Quarterly Review
Intact Financial (IFC-T) released its third-quarter fiscal 2023 results on Tuesday, November 07, 2023, after markets closed.
“Our teams remain hard at work getting customers back on track after several months of elevated severe weather activity. It is in precisely these moments that we can best demonstrate our purpose – to help people, businesses and society be resilient in bad times. We have a long track record of successfully navigating volatility in catastrophe losses. The third quarter was no different, as we delivered an operating ROE of 12.2%, and our balance sheet remained strong with $2.8 billion of total capital margin. I am pleased to see continued organic growth momentum, in the context of strong underlying underwriting performance and an acceleration in the UK&I segment’s path to outperformance.”
– Charles Brindamour, Chief Executive Officer
Highlights:
- Net operating income per share of $2.10 despite elevated catastrophe losses, driven by solid underlying performance in all geographies and 50% growth in net investment income
- Undiscounted combined ratio of 98.3% (93.5% discounted) included 8 points of catastrophe losses in excess of expectations, while inflation moderated as expected in personal auto, and results remained strong across commercial lines
- Operating DPW growth of 6% led by good momentum in personal lines, and continued rate action across all business segments
- Strong balance sheet with $2.8 billion of total capital margin1 and BVPS increasing 1% sequentially, reflecting EPS of $0.83 and an equity issuance for the acquisition of Direct Line Insurance Group plc’s brokered commercial lines operations
- Accelerated our strategy by materially increasing our presence in the outperforming UK commercial lines business, while a strategic review of UK personal lines is underway
Outlook:
- Over the next twelve months, we expect hard insurance market conditions to continue in most lines of business, driven by inflation and natural disasters.
- In Canada, both personal property and auto premiums are expected to grow by high single-digits in response to higher severity.
- In commercial and specialty lines across all geographies, we expect hard market conditions to continue in most lines of business, with high single-digit premium growth on average.
- Given the rise in interest rates, we expect pre-tax investment yield for the industry to continue increasing as portfolios roll over.
Source: (IFC-T) Q3-2023 Quarterly Review
TC Energy (TRP-T) released its third-quarter fiscal 2023 results on Wednesday, November 08, 2023, before markets opened.
“During the third quarter, we made monumental progress on Coastal GasLink and have achieved mechanical completion ahead of our year-end target. The team’s exceptional safety and construction execution on this challenging project means that we have reached 100 per cent pipeline installation, including the successful hydrotesting of the full 670 km pipeline length. The project remains on track with the approximately $14.5 billion cost estimate. We are also delivering on our 2023 strategic priorities, including strengthening the balance sheet with the recent receipt of $5.3 billion of asset sale proceeds that will be utilized for debt repayment and funding, along with maximizing the value of our assets with the announced intention to spin off our Liquids Pipelines business. Our focus on safety and the reliability of our assets continues to deliver strong year-over-year growth, and we remain on track to deliver a record year for 2023 comparable EBITDA despite macroeconomic headwinds.”
– François Poirier, President and Chief Executive Officer
Highlights:
- Delivered approximately seven per cent comparable EBITDA growth of $2.6 billion in third quarter 2023 compared to $2.5 billion in third quarter 2022. Segmented earnings were $0.6 billion in third quarter 2023 compared to $1.8 billion in third quarter 2022, largely due to the after-tax impairment charge of $1,179 million for the three months ended September 30, 2023 related to TC Energy’s equity investment in Coastal GasLink Pipeline Limited Partnership (Coastal GasLink LP)
- Third quarter 2023 results were underpinned by solid utilization and reliability across our assets. While our Natural Gas Pipelines business does not carry material volumetric or price risk, strong utilization rates demonstrate the demand for our services and the longer-term criticality of our assets
- NGTL System receipts averaged 14.0 Bcf/d, up 0.5 Bcf/d from third quarter 2022
- NGTL System daily receipts reached 14.6 Bcf on August 6, 2023, the highest single day average on the pipeline
- S. Natural Gas Pipelines LNG deliveries averaged 3.1 Bcf/d, up 1.4 per cent from third quarter 2022
- S. Natural Gas Pipelines business achieved a new record of deliveries to power generators of 5.2 Bcf on July 28, 2023
- Gas Transmission Northwest (GTN) system achieved an all-time delivery record of 2.96 Bcf on July 25, 2023
- Keystone Pipeline System achieved 93.7 per cent operational reliability year-to-date
- Successfully completed two open seasons on Marketlink, supporting the sustained demand for Canadian crude on the Keystone Pipeline and Marketlink systems
- Alberta cogeneration power plant fleet achieved approximately 98 per cent peak price availability
- Bruce Power achieved 94 per cent availability and successfully completed the Unit 6 Major Component Replacement (MCR) within budget and ahead of schedule
- Third quarter 2023 financial results:
- Net losses attributable to common shares of $0.2 billion or $0.19 per common share compared to net income of $0.8 billion or $0.84 per common share in third quarter 2022. Comparable earnings of $1.0 billion or $1.00 per common share compared to $1.1 billion or $1.07 per common share in 2022
- Comparable EBITDA of $2.6 billion compared to $2.5 billion in 2022 and segmented earnings of $0.6 billion compared to $1.8 billion in 2022
- Reflecting strong year-to-date operational and financial performance, we now expect 2023 comparable EBITDA to be at the upper end of the five to seven per cent outlook compared to 2022, while 2023 comparable earnings per common share is expected to be generally consistent with 2022
- Year to date, we have placed approximately $5 billion of projects into service on our natural gas and liquids pipeline systems, as well as the Bruce Power Unit 6 MCR which was declared commercially operational on September 14, 2023
- Placed the lateral section of the Villa de Reyes (VdR) pipeline in commercial service
- Placed substantially all assets of the NGTL System/Foothills West Path Delivery Program into service on November 1, 2023
- On October 4, 2023, we successfully completed the sale of a 40 per cent non-controlling equity interest in Columbia Gas Transmission, LLC (Columbia Gas) and Columbia Gulf Transmission, LLC (Columbia Gulf) systems to Global Infrastructure Partners (GIP) for total cash proceeds of $5.3 billion (US$3.9 billion), which were directed towards reducing leverage
- Coastal GasLink has achieved mechanical completion, ahead of its year-end target and the project remains on track with the cost estimate of approximately $14.5 billion
- The Southeast Gateway Pipeline project continues to progress to our US$4.5 billion cost estimate and schedule. Land rights and rights of way negotiations have closed and all critical permits for onshore construction have been received. We are advancing construction of on-shore facilities and landfalls. Offshore engineering is complete and offshore installation expected to commence prior to the end of 2023
- Approved the Bison XPress expansion project on Northern Border and Bison systems that will replace and upgrade certain facilities and provide production egress from the Bakken basin to a delivery point at the Cheyenne Hub
- GTN XPress project received FERC approval to expand the GTN system that will provide for the transport of incremental contracted export capacity facilitated by the NGTL System/Foothills West Path Delivery Program
- John E. Lowe will be appointed as TC Energy’s Board Chair, effective January 1, 2024
- Progressing proposed Liquids Pipelines spinoff with the announcement of the Board Chair and company name, South Bow Corporation
- Declared a quarterly dividend of $0.93 per common share for the quarter ending December 31, 2023.
Outlook:
Reflecting strong year-to-date operational and financial performance, we now expect 2023 comparable EBITDA to be at the upper end of the five to seven per cent outlook compared to 2022 and 2023 comparable earnings per share to be generally consistent with 2022. Total capital expenditures for 2023 are now expected to be approximately $12.0 billion to $12.5 billion. While the estimated capital costs associated with our major projects remains consistent, the increase from the range as outlined in our 2022 Annual Report is primarily related to shifts in timing for some of our growth projects and maintenance capital expenditures in our natural gas pipelines businesses, as well as the foreign exchange impact of a stronger U.S. dollar. We continue to work on cost mitigation strategies and assess developments in our construction projects and market conditions for changes to our overall capital program. To date, we have placed approximately $5 billion of assets into service on budget, further supporting comparable EBITDA growth. Beyond 2024, we remain committed to limiting annual sanctioned net capital expenditures to $6 billion to $7 billion. At this level, we believe we can continue to grow our business at a commensurate rate with our dividend growth outlook of three to five per cent, while also providing the optionality to further reduce leverage and/or return incremental capital to shareholders. TC Energy’s Board of Directors declared a quarterly dividend of $0.93 per common share for the quarter ending December 31, 2023, equating to $3.72 on an annualized basis.
Source: (TRP-T) Q3-2023 Quarterly Review
CCL Industries (CCL-B-T) released its third-quarter fiscal 2023 results on Wednesday, November 08, 2023, after markets closed.
“The Company posted another solid quarter despite soft demand from customer destocking initiatives, the impact of inflation and higher interest rates on consumers plus the geopolitical uncertainties unfolding around the world. Excluding an $11.9 million gain on the sale of excess real estate recorded at Checkpoint in the 2022 third quarter, I am pleased to report all Segments reported operating income gains compared to the prior year period. Consolidated, the Company posted $0.95 basic and adjusted basic earning per Class B share for the third quarter of 2023, equal to the record prior year period.”
– Geoffrey T. Martin, President and Chief Executive Officer
Highlights:
CCL
- Sales increased 6.4% to $1.1 billion, on 3.6% organic decline, offset by 4.0% acquisition contribution and 6.0% positive impact from foreign currency translation
- Regional organic sales growth: almost flat in the Americas, mid-single digit decline in Europe and double digit decline in Asia Pacific
- Operating income $169.7 million, increased 5.9%, 15.9% operating margin down 10 bps
- Label joint ventures added $0.03 earnings per Class B share
Avery
- Sales increased 4.9% to $269.5 million, on 0.7% organic decline, offset by 1.2% acquisition contribution and 4.4% positive impact from foreign currency translation
- Operating income $50.7 million, up 13.4%, 18.8% operating margin , up 140 bps
Checkpoint
- Sales increased 7.2% to $210.1 million, on organic growth of 4.1% and 3.1% positive impact from foreign currency translation
- Operating income $28.8 million, down 17.9%, 13.7% operating margin , down 420 bps. Excluding the $11.9 million gain on sale of excess real estate in China in 2022, operating income up 24.1%
Innovia
- Sales declined 28.4% to $146.3 million with 34.4% organic decline partially offset by 6.0% positive impact from foreign currency translation
- Operating income $6.9 million, up 1.5%, 4.7% operating margin, up 140 bps
Outlook:
- Core CCL business units’ expect similar conditions to Q3 for the coming quarter
- CCL Design expected to return to profit growth as we lap the change in demand in the electronics industry
- CCL Secure should post modest progress
- Avery results expected to be stable, horticulture moves into busy production season
- Checkpoint faces tough comps compared to a strong end to 2022, RFID continues to grow
- Innovia expected to outperform weak Q422, perhaps significantly if the label materials industry volume recovery gains traction
- FX tailwind to continue at current exchange rates
Source: (CCL-B-T) Q3-2023 Quarterly Review
Franco Nevada (FNV-N) released its third-quarter fiscal 2023 results on Wednesday, November 08, 2023, after markets closed.
“Our core precious metal assets anchored the quarter, resulting in increased revenue and earnings over the prior year period. We are looking forward to added precious metal contributions from a number of new mines in 2024 and, in particular, from the Tocantinzinho stream where G Mining Ventures is progressing construction on time and budget. Franco-Nevada is debt-free and is growing its cash balances.”
– Paul Brink, Chief Executive Officer
Highlights:
- In Q3 2023, we earned $309.5 million in revenue, up 1.7% from Q3 2022. We benefited from an increase in GEOs from our Precious Metal assets as well as higher gold prices. This more than offset the decrease in revenue from our Diversified assets, which reflect lower oil and gas prices when compared to the relative highs of the prior year quarter.
- Precious Metal revenue accounted for 77.8% of our revenue (64.5% gold, 10.2% silver, 3.1% PGM). Revenue was sourced 88.0% from the Americas (28.7% South America, 28.4% Central America & Mexico, 15.9% U.S. and 15.0% Canada).
Outlook:
The Panamanian National Assembly approved the revised Cobre Panama concession agreement in October 2023. In response to protests that followed the approval, the Government proposed but did not proceed with a popular consultation on the revised concession contract. The Panamanian Supreme Court is, however, considering a number of lawsuits challenging the constitutionality of the law pertaining to the contract. Production at the Cobre Panama mine has not been impacted and we, along with the operator, First Quantum, are closely monitoring the unfolding situation.
Source: (FNV-N) Q3-2023 Quarterly Review
Canadian Tire (CTC-A-T) released its third-quarter fiscal 2023 results on Thursday, November 09, 2023, before markets opened.
“Against softening consumer demand, our Q3 results show the continued resilience, relevance, and underlying strength of our business as we leveraged loyalty and prioritized essential categories within our multi-category assortment. We remain focused on driving value for our customers as we head into the important fourth quarter.”
– Greg Hicks, President and Chief Executive Officer
Highlights:
- Consolidated comparable sales1 down 1.6% as consumers continue to shift to essentials
- Increase in Retail Gross margin rate as higher CTR product margin offset promotional intensity at other banners
- Normalized diluted Earnings Per Share1 (“EPS”) was $2.96; Diluted EPS was $(1.19)
- Annualized dividend increased from $6.90 to $7.00 per share; intention to repurchase up to an additional $200.0 million Class A Non-Voting Shares during 2024
Outlook:
“In a more challenging economic environment, we are accelerating efficiency initiatives, prioritizing investments within our Better Connected strategy, and actively managing our resource allocation,” added Hicks.
Source: (CTC-A-T) Q3-2023 Quarterly Review
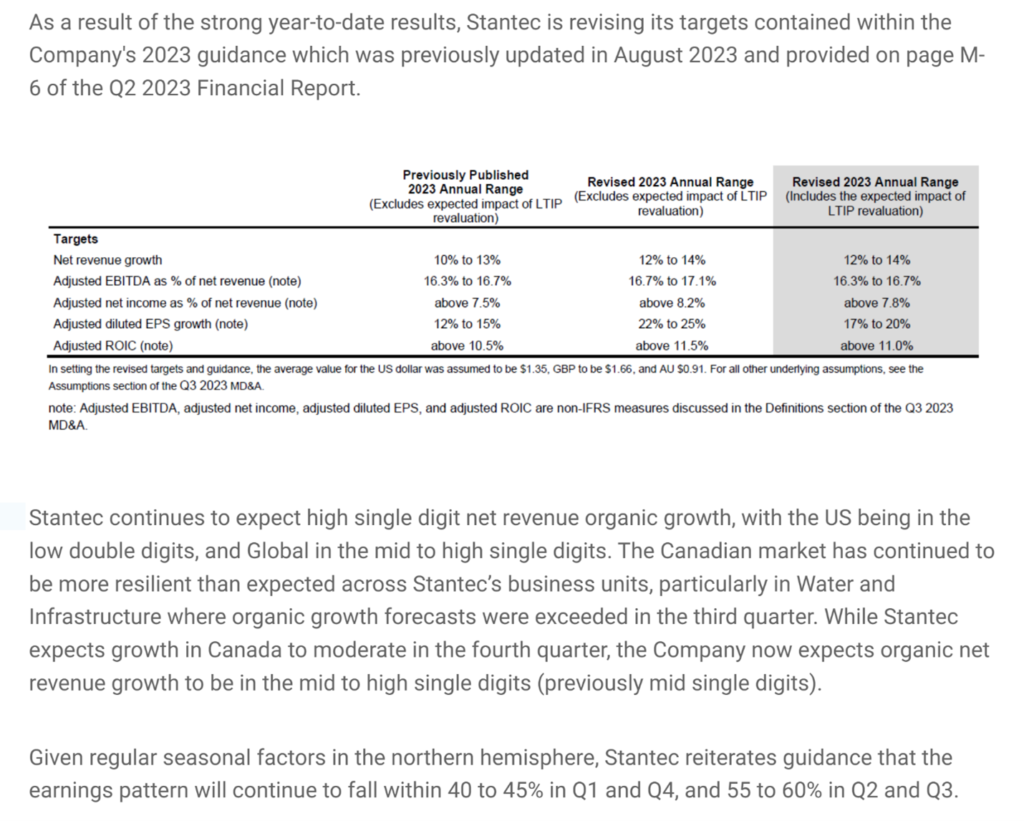
Stantec (STN-T) released its third-quarter fiscal 2023 results on Thursday, November 09, 2023, after markets closed.
“I am extremely pleased with our third quarter results as we continued to deliver exceptional growth in revenue and earnings through excellent operational performance. As a result of our outperformance this quarter, our strong year-to-date results, and the continued favorable market demand, we are increasing our guidance for 2023 once more. Our backlog is at a near-record high level and market demand continues to be robust, bolstering our optimism for ongoing strong growth in 2024 and beyond. We are confident that our diverse business model and engaged workforce ideally position Stantec to continue delivering industry-leading results.”
– Gord Johnston, President and Chief Executive Officer
Highlights:
- Net revenue of $1.3 billion, an increase of 13.5% over Q3 2022
- Adjusted EBITDA margin1of 18.3%, up 160 basis points over Q3 2022
- Adjusted diluted EPS1of $1.14, up 32.6% over Q3 2022
- Backlog of $6.4 billion, up 7.6% since December 31, 2022
Outlook:
Source: (STN-T) Q3-2023 Quarterly Review
Emera Inc. (EMA-T) released its third-quarter fiscal 2023 results on Friday, November 10, 2023, before markets opened.
“Continued strong operational performance across Emera is helping to offset the headwinds of higher interest costs, and we continue to see solid growth throughout our business. Our $8.9 billion 3-year capital plan underpins this growth as we continue to invest to deliver upon our customer’s demand for cleaner, reliable and cost-effective energy.”
– Scott Balfour, President and Chief Executive Officer
Highlights:
- Quarterly adjusted EPS was $0.75 compared to $0.76 in Q3 2022. Quarterly reported net income per common share decreased $0.26 to $0.37 in Q3 2023 compared to $0.63 in Q3 2022 due to higher mark-to-market (“MTM”) losses.
- Year-to-date, adjusted EPS increased $0.06 or 3% to $2.33 compared to $2.27 in 2022. Year-to-date reported EPS was $2.53 compared to $1.75 in 2022, primarily due to year-over-year differences in MTM impacts.
- Operating cash flow before changes in working capital increased 125% to $1.8 billion compared to $806 million in 2022 due to solid operating performance and the recovery of fuel and storm costs in 2023 that were under-recovered in 2022.
- 2024-2026 capital plan of $8.9 billion predominately focused on reliability, customer growth and cleaner energy investments is driving approximately 7% annualized rate base growth.
- Approximately 75% of our capital plan to be invested in Florida.
- The Florida Public Service Commission approved new rates for Peoples Gas Systems, Inc. (“PGS”) which will provide additional annual revenues of $107M USD starting in 2024. This outcome from the PGS rate case application positions us to advance important investments to support the growth of that business for the benefit of customers.
Outlook:
There have been no material changes in Emera’s business overview and outlook from the Company’s 2022 annual MD&A. Emera’s year-to-date results have been impacted by macroeconomic conditions, specifically higher interest rates as well as other impacts of inflation. These macroeconomic conditions are likely to continue for the near term.
Source: (EMA-T) Q3-2023 Quarterly Review
Algonquin Power & Utilities (AQN-N) released its third-quarter fiscal 2023 results on Friday, November 10, 2023, before markets opened.
“We have launched the sale process for our portfolio of high-quality renewable assets and extensive development pipeline, and we remain focused on appropriate valuation. Having now served as Interim CEO for three months and met with various stakeholders, I believe the Company’s two businesses have untapped potential and bright futures ahead. With regards to the quarter, we continued to see constructive growth from rate cases and new development projects year over year. However, we also saw those efforts partially offset by unfavourable weather and higher interest rates. On balance, our Adjusted Net Earnings1 grew at a healthy pace for the quarter.”
– Chris Huskilson, Interim Chief Executive Officer
Highlights:
- Adjusted EBITDA of $281.3 million, an increase of 2%;
- Adjusted Net Earnings of $79.3 million, an increase of 8%; and
- Adjusted Net Earnings1per common share of $0.11, no change, in each case on a year-over-year basis.
Outlook:
- YTD results challenged by unfavourable weather
- 2023 Adjusted Net EPS expected to be at or below lower end of 2023 guidance
- Remain focused on renewables sales process
Source: (AQN-N) Q3-2023 Quarterly Review
