Last updated by BM on November 06, 2023
Summary
- This is a weekly installment of our MP Market Review series, which provides updates on the financial markets and Canadian dividend growth companies we monitor on ‘The List’.
- Last week, ‘The List’ was up with a YTD price return of +0.8% (capital). Dividend growth remained the same and is now at +8.8% YTD, highlighting income growth this year.
- Last week, one dividend increase from companies on ‘The List’.
- Last week, six earnings reports from companies on ‘The List’.
- Nine companies on ‘The List’ are due to report earnings this week.
- If you’re interested in creating your own dividend growth income portfolio, consider subscribing to our premium service, which grants you access to the MP Wealth-Builder Model Portfolio (CDN) and exclusive subscriber-only content. Learn More

Identifying companies whose dividend growth aligns closely with price growth can considerably enhance the predictability of future returns. Dividend growth investors know that the dividend drives the price in a predictable way, not the other way around. Fortis Inc. (FTS-T) is another company on ‘The List’ that aligns very closely with this dividend growth vs price growth pattern we like to see.
Introduction
“You have a pair of pants. In the left pocket, you have $100. You take $1 out of the left pocket and put it in the right pocket. You now have $101. There is no diminution of dollars in your left pocket. That is one magic pair of pants.”
This ‘magic pants’ analogy was from a Seeking Alpha article on dividend investing I read about a decade ago and was one of the catalysts for me to take a closer look at this type of investing and see if it truly was magical.
After conducting additional research, I have shifted towards utilizing a dividend growth investing (DGI) strategy as my primary investment approach. While I maintain portfolios consisting of high-quality dividend growers from both the United States and Canada, I have opted to concentrate on Canadian (CDN) dividend growth companies in this blog. This is due to several reasons, including a smaller pool of DGI companies to track, a lack of coverage for the DGI strategy by the North American investment media, and a tendency for those who do cover DGI to narrowly focus on only a handful of sectors (Energy and Financials).
While ‘The List’ is not a portfolio in itself, it serves as an excellent initial reference for individuals seeking to diversify their investments and attain higher returns in the Canadian stock market. Through our blog, we provide weekly updates on ‘The List’ and offer valuable perspectives and real-life examples of the dividend growth investing strategy in practice. This helps readers gain a deeper understanding of how to implement and benefit from this investment approach.
DGI Clipboard
“Think of stocks as being chickens, and dividends as being the eggs that those stocks provide.”
-(Jim Garland, 2013, P.4, ‘Memo to the Darcy Family: To Thine Own Self Be True’)
Egg Farming in a Chicken Farming World
One of my greatest joys as a father was sharing Aesop’s fables with my kids when they were younger. The simple yet timeless moral lessons from these stories served as a foundation for conveying important values to my children in an enjoyable and educational manner.
From time to time, I come across stories that, like Aesop’s fables, convey essential investment principles. These principles have stood the test of time but are often overshadowed by the next ‘bright shiny object’ out there.
The story of the two farmers told by Jim Garland in his 2013 paper, ‘Memo to the Darcy Family: To Thine Own Self Be True’, is one such story.
“Imagine two farms and two farmers. One farmer raises chickens and sells them to grocery stores. We’ll call him a chicken farmer. The other farmer keeps hens in a henhouse and feeds the eggs to his rather large family. The second one is an egg farmer.
The first person, the chicken farmer, is vitally interested in the market value of chickens. The second one, the egg farmer, is vitally interested in the number of eggs that his hens can lay, and in the health of the hens, but he doesn’t care at all about the market value of his hens.
For the chicken farmer, risk means the probability of a decline in the price of chickens. On the other hand, the egg farmer could care less about market values. His risks are foxes, viruses, and other such threats to the well-being of his hens.
Think of stocks as being chickens, and dividends as being the eggs that those stocks provide. Total return investors are chicken farmer investors, because total return investors worry about the market value of their “chickens” – of their stocks. On the other hand endowment investors are egg farmer investors. All that endowment investors worry about is the current and future quantities of their “eggs” – of their dividends.”
The moral of the story: As dividend growth investors who purchase quality companies, we share a resemblance with egg farmers in that our primary concern is the present and future quantities of our growing dividends, not the volatility in the price.
If you have not yet joined as a paid subscriber of the blog to receive DGI Alerts on the activity and content related to our model portfolio, it’s not too late. Click Here.
Recent News
First Quantum faces ‘shocker’ in Panama as president calls referendum on Cobre Panama contract (Globe & Mail)
The Panamanian government swiftly reversed its decision just one week after implementing a new law that would have allowed First Quantum to pay higher taxes to the government in exchange for keeping the mine operational. It now appears that a referendum may be necessary to officially enact this agreement into law.
Franco Nevada (FNV-T) holds a significant royalty stake with First Quantum in their Panama mine, and this surprising turn of events had a noticeable impact on the company’s share price last week. According to reports from Panama, it seems that resolving this situation may take some time.
Coastal GasLink completes B.C. pipeline installation after five years (Globe & Mail)
“Now that the pipeline has reached this milestone, it will soon enter the testing phase required before it can begin transporting natural gas to LNG Canada’s liquefied natural gas export terminal, which is still under construction in Kitimat, on the West Coast.
The terminal will be the first facility in Canada capable of loading natural gas in liquid form onto tankers for shipping abroad. It and the pipeline are critical to the industry’s hopes of supplying Asian markets with Canadian fuel.”
Coastal GasLink is operated by TC Energy Corp. (TRP-T), which currently owns 35 per cent of the project. This is good news for TC Energy who have run into several obstacles along the way in building this pipeline.
To receive breaking news about companies on ‘The List’, follow us on Twitter @MagicPants_DGI.
The List (2023)
Last updated by BM on November 03, 2023
The Magic Pants List contains 27 Canadian dividend growth stocks. ‘The List’ contains Canadian companies that have raised their dividend yearly for at least the last ten years and have a market cap of over a billion dollars. Below is each stock’s symbol, name, current yield, current price, price return year-to-date, current dividend, dividend growth year-to-date and current dividend growth streak. Companies on ‘The List’ are added or subtracted once a year, on January 1. After that, ‘The List’ is set for the next twelve months. Prices and dividends are updated weekly.
| SYMBOL | COMPANY | YLD | PRICE | YTD % | DIV | YTD % | STREAK |
|---|---|---|---|---|---|---|---|
| AQN-N | Algonquin Power & Utilities | 8.8% | $5.75 | -14.6% | $0.51 | -29.0% | 12 |
| ATD-T | Alimentation Couche-Tard Inc. | 0.7% | $76.80 | 27.7% | $0.56 | 19.1% | 13 |
| BCE-T | Bell Canada | 7.1% | $54.52 | -9.5% | $3.87 | 5.2% | 14 |
| BIP-N | Brookfield Infrastructure Partners | 4.4% | $27.04 | -13.7% | $1.44 | 6.3% | 15 |
| CCL-B-T | CCL Industries | 1.9% | $55.57 | -4.3% | $1.06 | 10.4% | 21 |
| CNR-T | Canadian National Railway | 2.1% | $151.77 | -6.8% | $3.16 | 7.8% | 27 |
| CTC-A-T | Canadian Tire | 4.8% | $144.81 | -1.2% | $6.90 | 17.9% | 12 |
| CU-T | Canadian Utilities Limited | 5.7% | $31.29 | -15.3% | $1.79 | 1.0% | 51 |
| DOL-T | Dollarama Inc. | 0.3% | $95.96 | 20.2% | $0.27 | 23.8% | 12 |
| EMA-T | Emera | 5.8% | $48.48 | -7.9% | $2.82 | 5.0% | 16 |
| ENB-T | Enbridge Inc. | 7.7% | $46.26 | -13.3% | $3.55 | 3.2% | 27 |
| ENGH-T | Enghouse Systems Limited | 2.5% | $34.17 | -4.3% | $0.85 | 18.2% | 16 |
| FNV-N | Franco Nevada | 1.1% | $124.69 | -9.7% | $1.36 | 6.3% | 15 |
| FTS-T | Fortis Inc. | 4.0% | $56.85 | 2.7% | $2.29 | 5.3% | 49 |
| IFC-T | Intact Financial | 2.2% | $198.84 | 1.6% | $4.40 | 10.0% | 18 |
| L-T | Loblaws | 1.5% | $119.57 | -0.6% | $1.74 | 13.2% | 11 |
| MGA-N | Magna | 3.4% | $53.51 | -7.0% | $1.84 | 2.2% | 13 |
| MRU-T | Metro | 1.7% | $73.33 | -2.8% | $1.21 | 10.0% | 28 |
| RY-T | Royal Bank of Canada | 4.6% | $116.05 | -9.4% | $5.34 | 7.7% | 12 |
| SJ-T | Stella-Jones Inc. | 1.2% | $74.59 | 50.4% | $0.92 | 15.0% | 18 |
| STN-T | Stantec Inc. | 0.9% | $87.07 | 33.3% | $0.77 | 8.5% | 11 |
| TD-T | TD Bank | 4.7% | $80.98 | -7.6% | $3.84 | 7.9% | 12 |
| TFII-N | TFI International | 1.2% | $114.02 | 13.9% | $1.40 | 29.6% | 12 |
| TIH-T | Toromont Industries | 1.5% | $110.05 | 12.6% | $1.68 | 10.5% | 33 |
| TRP-T | TC Energy Corp. | 7.4% | $49.92 | -6.3% | $3.69 | 3.4% | 22 |
| T-T | Telus Corp. | 5.9% | $24.25 | -7.9% | $1.43 | 7.4% | 19 |
| WCN-N | Waste Connections | 0.8% | $133.23 | 1.2% | $1.05 | 10.5% | 13 |
| Averages | 3.5% | 0.8% | 8.8% | 19 |
Six Canadian stocks on ‘The List’ declare earnings and dividends in US dollars and are inter-listed on a US exchange in US dollars. The simplest way to display dividend and price metrics for these stocks is to show their US exchange symbols along with their US dividends and price. The stocks I am referring to have a -N at the end of their symbols. You can still buy their Canadian counterparts (-T), but your dividends will be converted into CDN dollars and will fluctuate based on the exchange rate.
Note: When the dividend and share price currency match, the calculation is straightforward. But it’s not so simple when the dividend is declared in one currency, and the share price is quoted in another. Dividing the former by the latter would produce a meaningless result because it’s a case of apples and oranges. To calculate the yield properly, you must express the dividend and share price in the same currency.
Performance of ‘The List’
Feel free to click on this link, ‘The List’ for a sortable version from our website.
Last week, ‘The List’ was up with a YTD price return of +0.8% (capital). Dividend growth remained the same and is now at +8.8% YTD, highlighting income growth this year.
The best performers last week on ‘The List’ were Brookfield Infrastructure Partners (BIP-N), up +26.41%; Algonquin Power & Utilities (AQN-N), up +14.31%; and Magna (MGA-N), up +12.30%.
Franco Nevada (FNV-N) was the worst performer last week, down -9.30%.
Dividend Increases
“The growth of dividend paying ability is of significance in the determination of a stock’s quality, or general safety…”
– Arnold Bernhard (the founder of Value Line)
“As a dividend increase is a positive sign of a company’s financial strength, the safest purchase, after research, is a stock with a recent dividend increase.”
– Tom Connolly (the founder of dividendgrowth.ca)
One company on ‘The List’ announced a dividend increase last week.
Telus (T-T) on Friday said it increased its 2024 quarterly dividend from $0.3636 to $0.3761 per share, payable January 02, 2024, to shareholders of record on December 11, 2023.
This represents a dividend increase of +3.40%, marking the 20th straight year of dividend growth for this quality telco.
Earnings Releases
Benjamin Graham once remarked that earnings are the principal factor driving stock prices.
Each quarter, we will provide readers with weekly earnings updates of stocks on ‘The List’ during the calendar earnings season.
The updated earnings calendar can be found here.
Earnings growth and dividend growth tend to go hand in hand, so this information can tell us a lot about the future dividend growth of our quality companies. Monitoring our dividend growers periodically is part of the process, and reading the quarterly earnings releases is a good place to start.
Nine earnings reports from companies on ‘The List’ this week
Stella-Jones Inc. (SJ-T) will release its third-quarter fiscal 2023 results on Tuesday, November 07, 2023, before markets open.
Intact Financial (IFC-T) will release its third-quarter fiscal 2023 results on Tuesday, November 07, 2023, after markets close.
TC Energy (TRP-T) will release its third-quarter fiscal 2023 results on Wednesday, November 08, 2023, before markets open.
CCL Industries (CCL-B-T) will release its third-quarter fiscal 2023 results on Wednesday, November 08, 2023, after markets close.
Franco Nevada (FNV-N) will release its third-quarter fiscal 2023 results on Wednesday, November 08, 2023, after markets close.
Canadian Tire (CTC-A-T) will release its third-quarter fiscal 2023 results on Thursday, November 09, 2023, before markets open.
Stantec (STN-T) will release its third-quarter fiscal 2023 results on Thursday, November 09, 2023, after markets close.
Emera Inc. (EMA-T) will release its third-quarter fiscal 2023 results on Friday, November 10, 2023, before markets open.
Algonquin Power & Utilities (AQN-N) will release its third-quarter fiscal 2023 results on Friday, November 10, 2023, before markets open.
Last week, six earnings reports from companies on ‘The List’.
Toromont Industries (TIH-T) released its third-quarter fiscal 2023 results on Monday, October 30, 2023, after markets closed.
“We are pleased with the operating and financial performance through the first nine months of the year. The Equipment Group executed well, delivering against the opening order backlog in line with customer schedules and improvement in inventory flow, coupled with good growth in rental and product support activity, as well as a continued focus on expense control. CIMCO revenue and bottom line improved in the quarter on good execution and higher product support activity. Across the organization, we continue to navigate through uncertain economic conditions and remain committed to our operating disciplines, driving our after-market strategies and delivering customer solutions.”
– Michael S. McMillan, President and Chief Executive Officer
Highlights:
- Revenue increased $87.5 million or 8% in the third quarter compared to the similar period last year, with higher revenues in both groups. Equipment Group was up 7% in the quarter on higher equipment sales (up 7%), product support revenues (up 7%) and rental activity (up 11%). CIMCO revenue increased 15%, with progress on package sales (up 2%) and strong product support growth (up 29%).
- Revenue increased $408.5 million (14%) to $3.4 billion for the year-to-date period. Revenue increased in both groups, with the Equipment Group up 13% and CIMCO up 17% year-to-date, on similar trends as noted for the quarter.
- Operating income increased 17% in the quarter reflecting the higher revenue and gross margins, along with the lower relative expense ratio. Operating income as a percentage of sales increased to 16.4% from 15.3% in the prior year.
- Operating income increased 22% in the year-to-date period, and was 14.7% of revenue compared to 13.7% in the similar period last year, reflecting similar trends as noted for the quarter
- Net earnings from continuing operations increased $25.1 million or 21% in the quarter versus a year ago to $145.6 million or $1.77 EPS (basic) and $1.76 EPS (fully diluted).
- For the year-to-date period, net earnings from continuing operations increased $83.2 million or 29% to $375.1 million, or $4.56 EPS (basic) and $4.52 EPS (fully diluted).
- Bookings for the third quarter decreased 5% compared to last year and increased 5% on a year-to-date basis. The Equipment Group reported lower bookings during the quarter (down 10%), after a strong start to the year and given the uncertain economic conditions. CIMCO reported increased bookings (up 18%) on good demand for our products and services. Year-to-date both groups reported increased bookings, with the Equipment Group up 4% and CIMCO up 17%.
- Backlog was $1.2 billion as at September 30, 2023, compared to $1.4 billion as at September 30, 2022, reflecting good order intake, progress on construction and delivery schedules as well as some improvement in equipment flow through the supply chain.
Outlook:
We are mindful of the uncertain economic environment and continue to monitor key metrics and supply‑dynamics,” continued Mr. McMillan. “We have seen some softening in demand for equipment in construction markets after a period of strong growth. We will continue to follow our disciplined approach, working our operational model while delivering results for our customers, suppliers and employees. While focused on managing discretionary spend, we continue to recruit technicians, to support our critical after-market service strategies and value‑added product offering over the long term.
Source: (TIH-T) Q3-2023 Quarterly Review
Brookfield Infrastructure Partners (BIP-N) released its third-quarter fiscal 2023 results on Wednesday, November 1, 2023, before markets opened.
“We had strong financial results and delivered on all of our strategic initiatives to date in 2023. We have demonstrated our ability to use our size, scale and diversification to continue recycling capital at good valuations, while investing at higher returns on our new investments.”
– Sam Pollock, CEO
Highlights:
- Brookfield Infrastructure reported net income of $104 million for the three-month period ended September 30, 2023 compared to $113 million in the prior year. Current year results benefited from the contribution associated with recently completed acquisitions and organic growth across our base business. These positive impacts were partially offset by higher borrowing costs associated with the financing of growth initiatives and lower gains on currency and commodity contracts than in the same period last year.
- Funds from operations (FFO) in the quarter was $560 million, a 7% increase compared with the same period last year. Results benefited from strong base business performance reflecting higher tariffs and the commissioning of approximately $1 billion of capital projects in the past 12 months. Our financial results do not reflect the benefit of new investments this year and we are conversely impacted by nearly $2 billion of asset sales that primarily closed in the second quarter of 2023. The fourth quarter will fully reflect the contributions of our new investments, which closed right before, or subsequent to, September 30.
Outlook:
The market backdrop has created a strong environment for capital deployment, with returns on new investments expected to be well in excess of our 12-15% target. Our 2023 deployment is expected to provide us with some of the best risk-adjusted returns we have seen in the last decade.
Source: (BIP-N) Q3-2023 Quarterly Review
Bell Canada (BCE-T) released its third-quarter fiscal 2023 results on Thursday, November 2, 2023, before markets opened.
“The Bell team has demonstrated continued operational excellence, delivering results that place us in a solid position as we look ahead to the end of the year.”
– Mirko Bibic, President and CEO
Highlights:
- 1% consolidated adjusted EBITDA growth delivered 0.9 percentage-point increase in adjusted EBITDA margin2 to 43.9% — best quarterly result since Q2 2022
- Net earnings of $707 million down 8.3% with net earnings attributable to common shareholders of $640 million, down 10.5% or $0.70 per common share; adjusted net earnings of $741 million yielded adjusted EPS1 of $0.81, down 8.0% reflecting higher interest expense, increased depreciation and amortization and higher income taxes
- Cash flows from operating activities down 1.8% to $1,961 million; stronger Q3 free cash flow growth trajectory as profiled in 2023 quarterly budget, increasing 17.4% to $754 million on strong adjusted EBITDA flow-through and lower capital expenditures
- Strong wireless performance with 231,212 total mobile phone and connected device net subscriber activations3 — second-best ever quarterly result; 3.9% wireless service revenue growth as blended average revenue per user remains essentially stable in a competitive market
- Record quarter for fibre Internet net activations of 104,159, up 7.9%, driving total retail Internet net activations of 79,327 and 6.1% residential Internet revenue growth; on track to achieve 85% planned broadband buildout target by year end
- Bell Media adjusted EBITDA up 11.5% on lower operating costs and restructuring initiatives as total revenue declined 1.3% due to ongoing advertising recession; digital revenue5 up 26% as digital platforms and advertising technology drive digital advertising market share growth
- Reconfirming all 2023 financial guidance targets
Outlook:
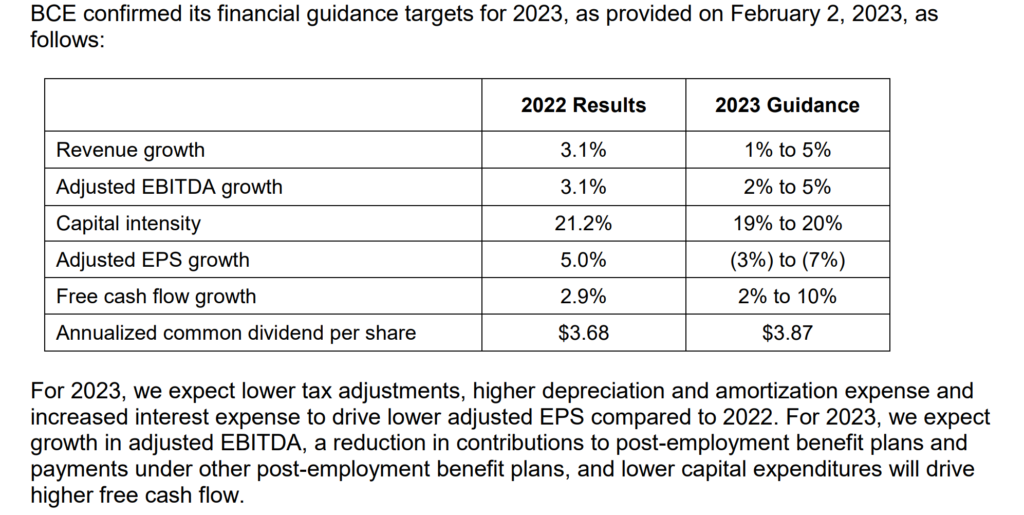
Source: (BCE-T) Q3-2023 Quarterly Review
Telus (T-T) released its third-quarter fiscal 2023 results on Friday, November 3, 2023, before markets opened.
“For the third quarter, our TELUS team once again demonstrated execution strength in our TTech business segment, characterized by the potent combination of leading customer growth, complemented by strong operational and financial results, alongside improving EBITDA growth and margin expansion in our DLCX segment.”
– Darren Entwistle, President and CEO
Highlights:
- Total telecom customer growth of 406,000, up 59,000 over last year, an all-time quarterly record, driven by strong customer demand for our leading portfolio of bundled services across Mobility and Fixed
- Mobile Phone net additions of 160,000, our best third quarter on record, and a record setting quarter for Connected Device net additions of 179,000
- Robust third quarter Fixed customer net additions of 67,000, including 37,000 internet customer additions, powered by leading customer loyalty in combination with TELUS’ PureFibre network
- Consolidated Operating Revenue and Adjusted EBITDA growth of 7.2 per cent and 5.5 per cent, respectively, and Free Cash Flow growth of 7.3 per cent; Net Income lower by 75 per cent on higher efficiency-related restructuring and other costs, higher depreciation, amortization and financing costs; Adjusted Net Income down 21 per cent
- Quarterly dividend increased to $0.3761, up 7.1 per cent over the same period last year, representing a dividend yield of approximately 6.5 per cent
- Reconfirming our 2023 Consolidated Financial Targets
Outlook:
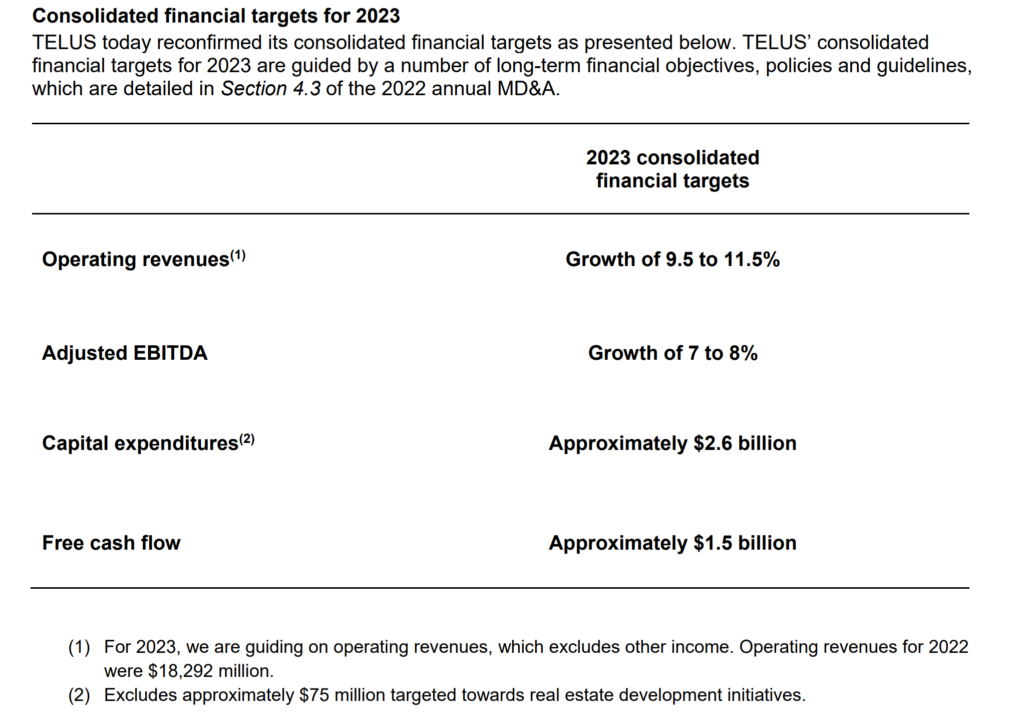
Source: (T-T) Q3-2023 Quarterly Review
Enbridge Inc. (ENB-T) released its third-quarter fiscal 2023 results on Friday, November 3, 2023, before markets opened.
“Despite ongoing market volatility, Enbridge’s four businesses delivered another solid quarter of financial performance. We saw high utilization across our systems delivering reliable, affordable, and sustainable energy for our customers while upholding industry leading safety standards. We’re tracking to plan and expect to achieve our 2023 EBITDA and DCF per share guidance for the 18th consecutive year.”
– Greg Ebel, President and CEO
Highlights:
- Third quarter GAAP earnings of $0.5 billion or $0.26 per common share, compared with GAAP earnings of $1.3 billion or $0.63 per common share in 2022
- Adjusted earnings of $1.3 billion or $0.62 per common share, compared with $1.4 billion or $0.67 per common share in 2022
- Adjusted earnings before interest, income taxes and depreciation and amortization (EBITDA) of $3.9 billion, an increase of 3%, compared with $3.8 billion in 2022
- Cash provided by operating activities of $3.1 billion, compared with $2.1 billion in 2022
- Distributable cash flow (DCF) of $2.6 billion, an increase of $0.1 billion, compared with $2.5 billion in 2022
- Reaffirmed 2023 full year financial guidance for EBITDA and DCF inclusive of the recent share offering dilution
- Enbridge entered into definitive agreements (the “Acquisitions”) with Dominion Energy, Inc. (“Dominion”) to acquire The East Ohio Gas Company, Questar Gas Company and its related Wexpro companies, and Public Service Company of North Carolina, Incorporated for an aggregate purchase price of US$14 billion (CDN$19 billion)
- Enbridge has filed applications for all key federal and state required regulatory approvals to complete the pending Acquisitions and approximately 75% of the financing for the aggregate purchase price has been secured
- Signed an agreement to increase ownership in Hohe See Offshore Wind Farm and Albatros Offshore Wind Farm by a further 24.45%, bringing Enbridge’s interest to 49.89%, for €625 million (including €358 million of assumed debt)
- Signed a definitive agreement to acquire seven operating landfill-to-renewable natural gas (RNG) assets located in Texas and Arkansas for US$1.2 billion with staggered consideration
- Upsized and relaunched the Flanagan South Pipeline (FSP) binding open season for US Gulf Coast delivery service
- Closed the acquisition of Aitken Creek Gas Storage on November 1
- Debt-to-EBITDA expected to exit the year below the target range of 4.5x to 5.0x reflecting substantial equity pre-funding prior to closing the Acquisitions
Outlook:
The Company reaffirms its 2023 financial guidance for EBITDA and DCF. Results for the first nine months of 2023 are in line with the Company’s expectations and the Company anticipates that its businesses will continue to experience strong capacity utilization and operating performance through the balance of the year with normal course seasonality. Strong operational performance in the first nine months of the year is expected to be offset by higher financing costs, due to increased interest rates, pre-funding of the U.S. gas utilities acquisitions and a lower toll on the Mainline.
Source: (ENB-T) Q3-2023 Quarterly Review
Magna (MGA-N) released its third-quarter fiscal 2023 results on Friday, November 3, 2023, before markets opened.
“We continue to execute across all segments of our business through a combination of launching new programs, working to offset inflationary pressures, reducing expenses, and optimizing our cost structure. Our raised Outlook reflects our relentless focus on delivering short- and long-term margin expansion and increased returns on investment.”
– Swamy Kotagiri, Magna’s Chief Executive Officer
Highlights:
- Sales increased 15% to $10.7 billion, compared to a global light vehicle production increase of 4%
- Diluted earnings per share were $1.37
- Adjusted diluted earnings per share increased 33% to $1.46
- Raised Outlook for Adjusted EBIT Margin and Adjusted Net Income attributable to Magna, including UAW strike impact
Outlook:
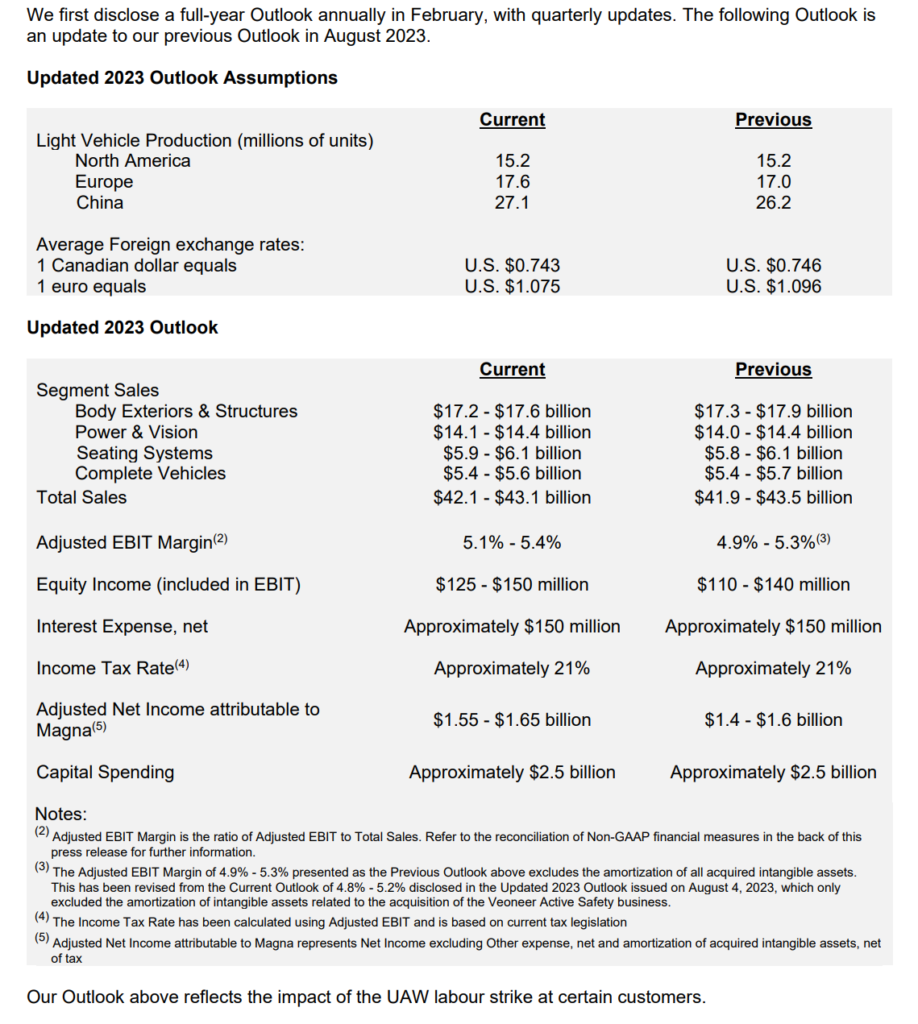
Source: (MGA-N) Q3-2023 Quarterly Review
