Last updated by BM on August 14, 2023
Summary
- This is a weekly installment of our MP Market Review series, which provides updates on the financial markets and Canadian dividend growth companies we monitor on ‘The List’.
- Last week, ‘The List’ was up with a YTD price return of +4.1% (capital). Dividend growth remained the same and is now at +8.4% YTD, highlighting growth in income over the past year.
- Last week, no dividend increases from companies on ‘The List’.
- Last week, eight earnings reports from companies on ‘The List’.
- No companies on ‘The List’ are due to report earnings this week.
- If you’re interested in creating your own dividend growth income portfolio, consider subscribing to our premium service, which grants you access to the MP Wealth-Builder Model Portfolio (CDN) and exclusive subscriber-only content. Learn More
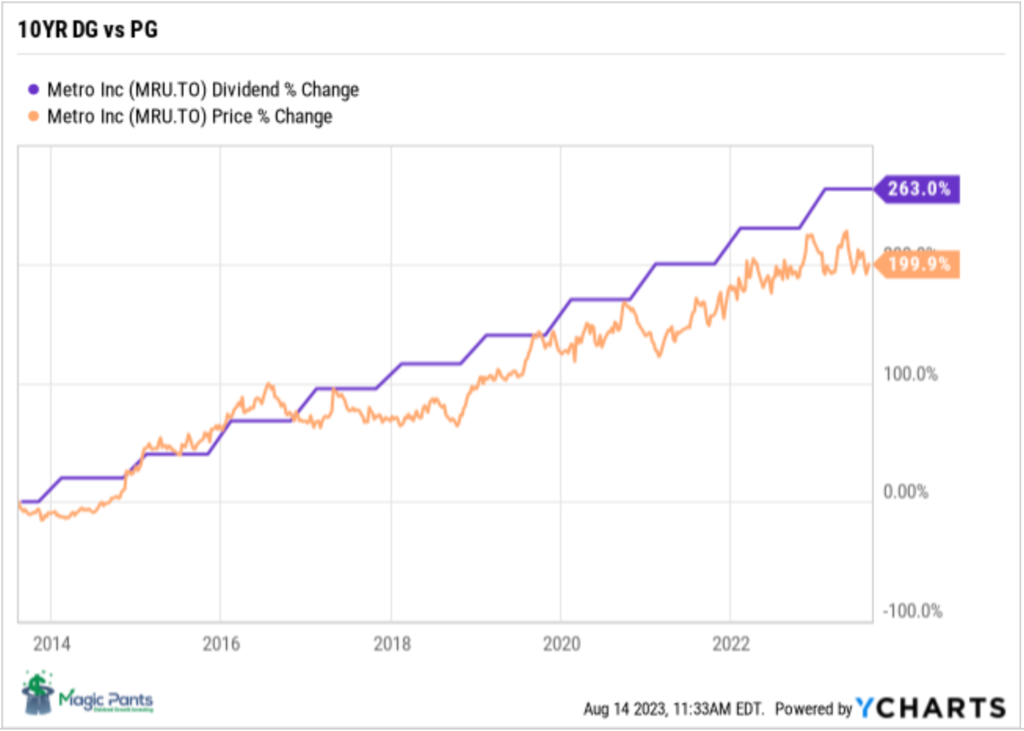
Identifying companies whose dividend growth aligns closely with price growth can considerably enhance the predictability of future returns. Dividend growth investors know that the dividend drives the price in a predictable way, not the other way around. Metro Inc. (MRU-T) is another company on ‘The List’ that follows this dividend growth principle.
Introduction
“You have a pair of pants. In the left pocket, you have $100. You take $1 out of the left pocket and put it in the right pocket. You now have $101. There is no diminution of dollars in your left pocket. That is one magic pair of pants.”
This ‘magic pants’ analogy was from a Seeking Alpha article on dividend investing I read about a decade ago and was one of the catalysts for me to take a closer look at this type of investing and see if it truly was magical.
After conducting additional research, I have shifted towards utilizing a dividend growth investing (DGI) strategy as my primary investment approach. While I maintain portfolios consisting of high-quality dividend growers from both the United States and Canada, I have opted to concentrate on Canadian (CDN) dividend growth companies in this blog. This is due to several reasons, including a smaller pool of DGI companies to track, a lack of coverage for the DGI strategy by the North American investment media, and a tendency for those who do cover DGI to narrowly focus on only a handful of sectors (Energy and Financials).
While ‘The List’ is not a portfolio in itself, it serves as an excellent initial reference for individuals seeking to diversify their investments and attain higher returns in the Canadian stock market. Through our blog, we provide weekly updates on ‘The List’ and offer valuable perspectives and real-life examples of the dividend growth investing strategy in practice. This helps readers gain a deeper understanding of how to implement and benefit from this investment approach.
DGI Thoughts
“The four most expensive words in the English language are ‘This time it’s different.’”
– Sir John Templeton
The Q2 Earnings season is over for companies we follow on ‘The List’. Check out the earnings calendar here and see how each company performed against analyst expectations and the same quarter last year.
Over 50% of the companies we follow did not meet their Q2 comparable earnings from 2022! This should be a signal to investors that even the highest-quality companies are seeing the effects of higher interest rates and inflation. The economy is definitely starting to slow down.
On the flip side, some companies are doing quite well. They tend to be non-cyclical in nature and have pricing power built-in to their business models to offset the effects of inflation on the cost side. Think food retail and utilities.
The third quarter should be interesting. We will find out if the central banks will continue their fight against inflation and slow the economy even further or are they done, and earnings will start to recover. Either way, pay attention to the earnings numbers and take a few minutes to read the quarterly earnings releases below, especially the ‘Outlook’ sections. From this you will get a better sense if management is hinting of an earnings contraction in the quarter ahead or ‘will it be different this time’.
If you have not yet joined as a paid subscriber of the blog to receive DGI Alerts on the activity and content related to our model portfolio, it’s not too late. Click Here.
Recent News
Why the stellar performance of the magnificent seven makes a case for index investing (Globe & Mail)
“The so-called magnificent seven stocks were responsible for practically all of the gains in the S&P 500 index through the first half of the year. Widen the lens out to the entire world, and roughly 70 per cent of the net wealth created by stock markets globally was driven by this handful of tech behemoths.”
“This year makes an unusually strong case for a broad index approach, which may seem counterintuitive. Why would you want to be forced to own legions of losing stocks when the market rally is so heavily concentrated in a small core of elite names?”
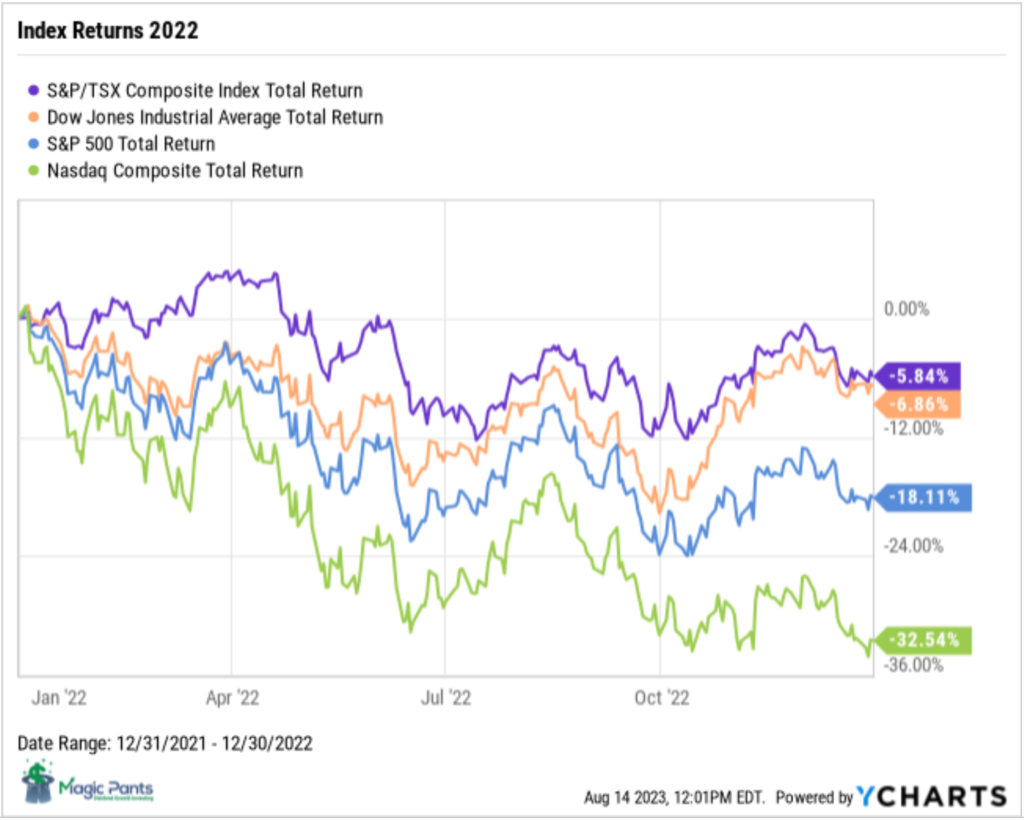
Articles like this perpetuate the myth that index investing is the place to be right now. How soon we forget the market indexes in 2022!
Stop your active portfolio manager bashing. Skill does still matter (Globe & Mail)
“Funds that invest in concentrated portfolios and/or deviate significantly from benchmarks tend to outperform, according to recent academic studies.”
There is a lot of good information in this article. There is a lot of good information in this article. Dividend growth investing is a ‘value-oriented’ investing strategy as well. We only purchase our quality dividend growers when they are sensibly (value) priced.
Here are a few of my favorite quotes:
“One can earn risk-adjusted returns of up to 9 per cent a year with rudimentary analysis of the most commonly reported accounting information. Such abnormal profits are a result of fundamental analysis and taking advantage of market inefficiencies.”
“The value-investing process involves three steps. Initially, value investors screen stocks and form portfolios based on a number of metrics such as P/E, P/B, market cap, etc. and focus on stocks in the lowest ranked portfolio. This allows them to identify stocks that have desirable characteristics (i.e., low price vs. fundamentals) and, at the same time, reduce the number of stocks they will consider in depth. The stocks selected from the initial step are now valued to determine their intrinsic value using both asset based and cash-flow-based valuation approaches. Finally, they make a decision to invest only in stocks that are truly undervalued, namely stocks that meet the required margin of safety.”
“Slow economic growth around the world, particularly in China, as well as a slowdown in productivity, lower population growth, aging baby boomers, higher taxes, higher inflation/interest rates and lower government spending will lead to an increase in stock-market volatility. An expensive market will also contribute to rising volatility, both realized and expected.
In this environment, active managers, such as value investors, will shine.”
To receive breaking news about companies on ‘The List’ follow us on Twitter @MagicPants_DGI.
The List (2023)
Last updated by BM on August 11, 2023
The Magic Pants List contains 27 Canadian dividend growth stocks. ‘The List’ contains Canadian companies that have raised their dividend yearly for at least the last ten years and have a market cap of over a billion dollars. Below is each stock’s symbol, name, current yield, current price, price return year-to-date, current dividend, dividend growth year-to-date and current dividend growth streak. Companies on ‘The List’ are added or subtracted once a year, on January 1. After that, ‘The List’ is set for the next twelve months. Prices and dividends are updated weekly.
| SYMBOL | COMPANY | YLD | PRICE | YTD % | DIV | YTD % | STREAK |
|---|---|---|---|---|---|---|---|
| AQN-N | Algonquin Power & Utilities | 6.8% | $7.48 | 11.1% | $0.51 | -29.0% | 12 |
| ATD-T | Alimentation Couche-Tard Inc. | 0.8% | $69.73 | 15.9% | $0.56 | 19.1% | 13 |
| BCE-T | Bell Canada | 6.7% | $56.78 | -5.7% | $3.82 | 5.0% | 14 |
| BIP-N | Brookfield Infrastructure Partners | 4.4% | $33.31 | 5.2% | $1.44 | 6.3% | 15 |
| CCL-B-T | CCL Industries | 1.7% | $61.99 | 6.8% | $1.06 | 10.4% | 21 |
| CNR-T | Canadian National Railway | 2.0% | $157.23 | -3.5% | $3.16 | 7.8% | 27 |
| CTC-A-T | Canadian Tire | 4.4% | $156.82 | 7.0% | $6.90 | 17.9% | 12 |
| CU-T | Canadian Utilities Limited | 5.6% | $32.13 | -13.0% | $1.79 | 1.0% | 51 |
| DOL-T | Dollarama Inc. | 0.3% | $85.60 | 7.2% | $0.27 | 23.8% | 12 |
| EMA-T | Emera | 5.4% | $51.57 | -2.0% | $2.76 | 3.0% | 16 |
| ENB-T | Enbridge Inc. | 7.2% | $49.38 | -7.4% | $3.55 | 3.2% | 27 |
| ENGH-T | Enghouse Systems Limited | 3.0% | $28.21 | -21.0% | $0.85 | 18.2% | 16 |
| FNV-N | Franco Nevada | 1.0% | $142.84 | 3.4% | $1.36 | 6.3% | 15 |
| FTS-T | Fortis | 4.1% | $54.53 | -1.5% | $2.26 | 4.1% | 49 |
| IFC-T | Intact Financial | 2.2% | $200.23 | 2.3% | $4.40 | 10.0% | 18 |
| L-T | Loblaws | 1.5% | $118.01 | -1.9% | $1.74 | 10.3% | 11 |
| MGA-N | Magna | 3.2% | $57.25 | -0.5% | $1.84 | 2.2% | 13 |
| MRU-T | Metro | 1.7% | $71.09 | -5.8% | $1.21 | 10.0% | 28 |
| RY-T | Royal Bank of Canada | 4.2% | $127.57 | -0.4% | $5.34 | 7.7% | 12 |
| SJ-T | Stella-Jones Inc. | 1.4% | $68.10 | 37.4% | $0.92 | 15.0% | 18 |
| STN-T | Stantec Inc. | 0.9% | $89.69 | 37.3% | $0.77 | 8.5% | 11 |
| TD-T | TD Bank | 4.5% | $86.26 | -1.6% | $3.84 | 7.9% | 12 |
| TFII-N | TFI International | 1.1% | $132.49 | 32.3% | $1.40 | 29.6% | 12 |
| TIH-T | Toromont Industries | 1.4% | $115.87 | 18.6% | $1.68 | 10.5% | 33 |
| TRP-T | TC Energy Corp. | 7.5% | $49.33 | -7.4% | $3.69 | 3.4% | 22 |
| T-T | Telus Corp. | 6.0% | $23.78 | -9.7% | $1.43 | 7.3% | 19 |
| WCN-N | Waste Connections | 0.7% | $140.68 | 6.8% | $1.02 | 7.4% | 13 |
| Averages | 3.3% | 4.1% | 8.4% | 19 |
Six Canadian stocks on ‘The List’ declare earnings and dividends in US dollars and are inter-listed on a US exchange in US dollars. The simplest way to display dividend and price metrics for these stocks is to show their US exchange symbols along with their US dividends and price. The stocks I am referring to have a -N at the end of their symbols. You can still buy their Canadian counterparts (-T), but your dividends will be converted into CDN dollars and will fluctuate based on the exchange rate.
Note: When the dividend and share price currency match, the calculation is straightforward. But it’s not so simple when the dividend is declared in one currency, and the share price is quoted in another. Dividing the former by the latter would produce a meaningless result because it’s a case of apples and oranges. To calculate the yield properly, you must express the dividend and share price in the same currency.
Performance of ‘The List’
Feel free to click on this link, ‘The List’ for a sortable version from our website.
Last week, ‘The List’ was up with a YTD price return of +4.1% (capital). Dividend growth remained the same and is now at +8.4% YTD, highlighting growth in income over the past year.
The best performers last week on ‘The List’ were Alimentation Couche-Tard Inc. (ATD-T), up +5.67%; Telus Corp. (T-T), up +3.53%; and Canadian Utilities Limited (CU-T), up +2.91%.
Canadian Tire (CTC-A-T) was the worst performer last week, down -12.27%.
Dividend Increases
“The growth of dividend paying ability is of significance in the determination of a stock’s quality, or general safety…”
– Arnold Bernhard (the founder of Value Line)
“As a dividend increase is a positive sign of a company’s financial strength, the safest purchase, after research, is a stock with a recent dividend increase.”
– Tom Connolly (the founder of dividendgrowth.ca)
Last week, no dividend increases from companies on ‘The List’.
Earnings Releases
Benjamin Graham once remarked that earnings are the principal factor driving stock prices.
Each quarter we will provide readers with weekly earnings updates of stocks on ‘The List’ during the calendar earnings season.
The updated earnings calendar can be found here.
Earnings growth and dividend growth tend to go hand in hand, so this information can tell us a lot about the future dividend growth of our quality companies. Monitoring our dividend growers periodically is part of the process, and reading the quarterly earnings releases is a good place to start.
No earnings reports from companies on ‘The List’ this week
Last week, eight companies on ‘The List’ reported earnings.
Franco Nevada (FNV-N) released its second-quarter fiscal 2023 results on Tuesday, August 8, 2023, after markets closed.
“Our portfolio continues to generate strong cash flows and high margins. The second quarter’s results benefited from our core assets returning to normal production and deliveries caught up from the disruptions in Q1. Revenue from our Diversified assets was impacted by lower oil, gas and iron ore prices compared to the relative highs of the prior year period. We expect Total GEOs for the year to be at the low end of our guidance range provided in March this year. We are looking forward to increased contributions from Cobre Panama, where the CP100 Expansion is on-track for year-end, and to contributions from royalties on several new mines. Franco-Nevada is debt-free and is growing its cash balances.”
– Paul Brink, Chief Executive Officer
Highlights:
- In Q2 2023, we earned $329.9 million in revenue, down 6.4% from Q2 2022, as the impact of lower commodity prices for our Diversified assets more than offset the increase in revenue from our Precious Metal assets. With Cobre Panama and Antapaccay operating at full production levels following the temporary disruptions in early 2023, both assets generated strong deliveries in Q2 2023. Partly offsetting the impact of lower oil and gas prices, during the quarter, we received catch-up royalty payments of approximately $7.0 million related to new wells primarily at our Permian interests, which are not expected to reoccur.
- Precious Metal revenue accounted for 78.6% of our revenue (64.8% gold, 10.7% silver, 3.1% PGM). Revenue was sourced 88.9% from the Americas (32.1% South America, 26.2% Central America & Mexico, 17.5% U.S. and 13.1% Canada).
Outlook:
Q2 Earnings Conference Call
Question: “Paul as you mentioned, you’re now targeting the lower end of the guidance range. If you kind of answered my question, but I just want to confirm. If I just look at your precious metals guidance, you’re actually tracking pretty well. So the fact that you’re targeting for total GEOs, the lower end. Is that really just due to lower sort of diversified prices, energy prices, iron ore prices? Or is that too simplistic of a way to look at it?
Answer: “You’re essentially correct. It’s — when we did our original guidance, the iron ore price we used was higher than what it’s averaged thus far in 2023 and what we’re using going forward, same with the energy prices. And so the other side, the gold price is higher than what we had in our original guidance. So you get a double impact on converting the non-gold revenue to GEOs, and that’s essentially the reason for guiding to the lower end.”
– Paul Brink, Chief Executive Officer
Source: (FNV-N) Q2-2023 Earnings Release
Metro (MRU-T) released its third-quarter fiscal 2023 results on Wednesday, August 9, 2023, before markets opened.
“We delivered solid results in the third quarter fueled by strong same-store sales and good operating leverage. With persistent food inflation, our teams did an excellent job to offer good value to our customers, resulting in market share gains and tonnage growth, driven by our discount food stores. Our loyalty program MOİ was successfully launched this quarter and we are pleased with the strong customer response so far. This enhanced program provides even more value to customers by offering multiple ways to earn and redeem points on food and pharmacy purchases in Québec. We are clearly disappointed with the current labour dispute in 27 of our Metro stores in the Greater Toronto Area given that we had reached a very good agreement that was unanimously recommended by union representatives. We look forward to a resolution and the re-opening of our stores as soon as possible, while ensuring the long-term competitiveness of our company.”
– Eric La Fleche, President and Chief Executive Officer
Highlights:
- Sales of $6,427.5 million, up 9.6%
- Food same-store sales up 9.4%
- Pharmacy same-store sales up 5.9%
- Net earnings of $346.7 million, up 26.1%, and adjusted net earnings of $314.8 million, up 10.9%
- Fully diluted net earnings per share of $1.49, up 30.7%, and adjusted fully diluted net earnings per share of $1.35, up 14.4%
Outlook:
We remain focused on offering quality products at competitive prices as higher than normal inflation and market challenges persist. While we are not able to predict how the current macro-economic environment will evolve, we are seeing some moderation in food inflation, although it is still elevated compared to pre-pandemic levels. With this backdrop, we remain resilient and committed to providing the best value for our customers while delivering on our strategic priorities. In this respect, we look forward to the launch of our state-of-the-art, automated distribution center north of Montreal in the coming weeks.
Source: (MRU-T) Q3-2023 Earnings Release
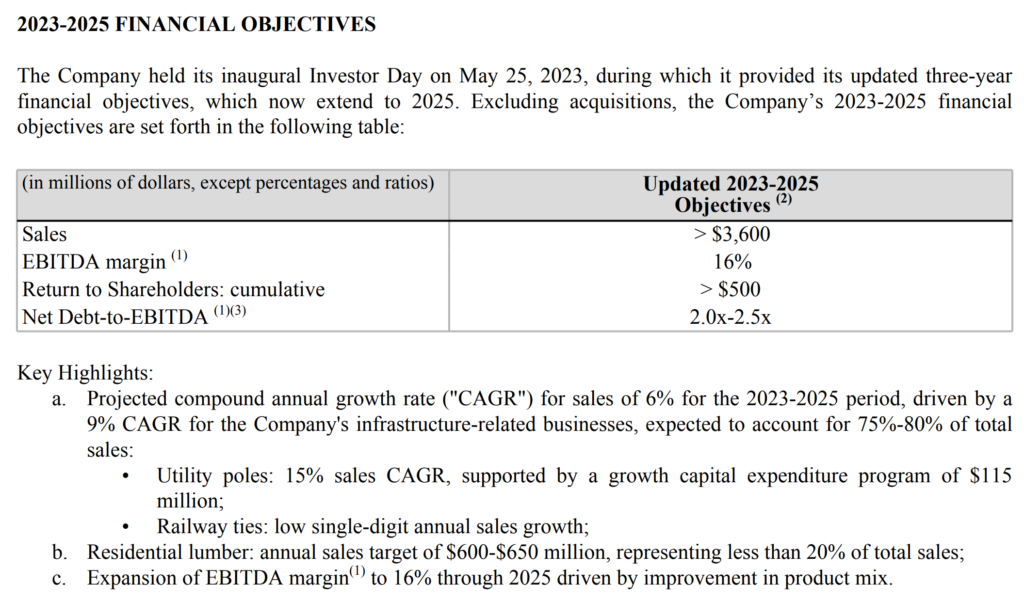
Stella-Jones Inc. (SJ-T) released its second-quarter fiscal 2023 results on Wednesday, August 9, 2023, before markets opened.
“Stella-Jones is executing on its three-year growth plan with the achievement of another strong performance in the second quarter, reflecting the upward momentum generated by accelerating demand for our infrastructure-related products. Our second quarter results continued to benefit from higher pricing dynamics for utility poles, railway ties and industrial products, while residential lumber delivered sales in line with expectations.”
– Eric Vachon, President and Chief Executive Officer
Highlights:
- Sales of $972 million, up 7%
- 10% organic sales growth in infrastructure-related businesses
- EBITDA of $175 million, or a margin of 18%, up from 17% in Q2 2022
- Net income of $100 million, or $1.72 per share, up 14% from EPS in Q2 2022
- Completed acquisitions and projects to seize growing utility pole demand
Outlook:
“In the second half of the year, we expect replenished railway tie inventory levels and ongoing capital projects for utility poles to facilitate anticipated volume gains, while our recent acquisitions of Balfour Pole Co. and Baldwin Pole and Pilings’ assets will further broaden the Company’s presence across North America. Our performance so far this year aligns with our plan to continue to grow our infrastructure-related businesses, increase profitability, as evidenced by the strong EBITDA margin generated in the second quarter, and to return capital and drive value for our shareholders. Managing capital projects, acquisitions and strong organic growth requires the resourcefulness and agility of our team of experts, and I am proud to recognize their invaluable contribution to our business.”
– Eric Vachon, President and Chief Executive Officer
Source: (SJ-T) Q2-2023 Earnings Release
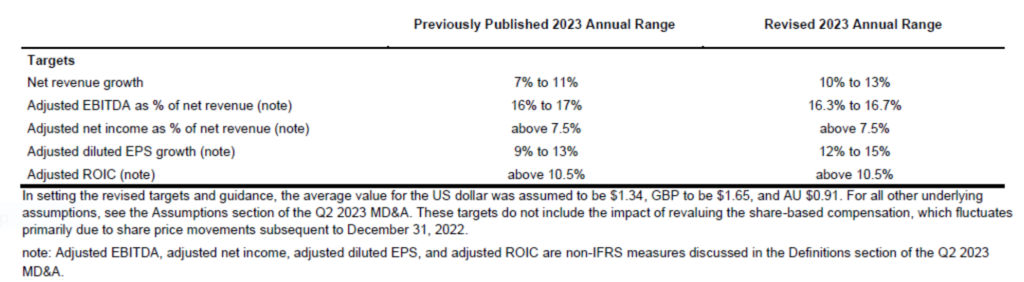
Stantec (STN-T) released its second-quarter fiscal 2023 results on Wednesday, August 9, 2023, after markets closed.
“We continue to deliver significant growth in revenue and earnings driven by strong performance across all our regional and business operating units. As a result of our strong year-to-date results and our expectation of continued favorable market fundamentals for the remainder of the year, we are increasing our net revenue and adjusted earnings per share guidance for 2023.”
– Gord Johnston, President and Chief Executive Officer
Highlights:
Q2 2023 compared to Q2 2022
- Net revenue increased 14.5% or $162.0 million to $1.3 billion, primarily driven by 11.2% organic growth. Double-digit organic growth was achieved in all regions and in Water, Environmental Services, and Energy & Resources businesses.
- Project margin increased $91.3 million or 15.1% to $694.0 million. As a percentage of net revenue, project margin increased by 30 basis points to 54.3%.
- Adjusted EBITDA increased $29.3 million or 15.7% to $216.0 million. Adjusted EBITDA margin increased by 20 basis points over Q2 2022 to 16.9%, despite a significant expense related to the revaluation of the Company’s LTIP, primarily due to strong share price appreciation in the quarter. Excluding the revaluation, adjusted EBITDA margin was 17.5%.
- Net income increased 45.0%, or $27.3 million, to $88.0 million, and diluted EPS increased 43.6%, or $0.24, to $0.79, mainly due to strong net revenue growth, solid project margins, and lower administrative and marketing expenses as a percentage of net revenue.
- Adjusted net income and adjusted diluted EPS achieved record highs in the quarter. Adjusted net income grew 18.1%, or $16.8 million, to $109.4 million, achieving 8.6% of net revenue (9.0% without the effect of the LTIP revaluation), and adjusted diluted EPS increased 19.3% to $0.99 ($1.04 without the effect of the LTIP revaluation).
- Contract backlog increased to $6.6 billion at June 30, 2023, a record high reflecting 10.0% organic growth from December 31, 2022—with double-digit organic backlog growth in Stantec’s US and Canada operations as well as in Environmental Services and Water. Contract backlog represents approximately 13 months of work—an increase of one month from December 31, 2022.
- Operating cash flows increased $35.4 million, with cash inflows of $31.0 million, reflecting strong revenue growth and operational performance. This compares to $4.4 million outflows in the comparative period, which resulted primarily from the Cardno financial system integration.
- DSO1 was 81 days, consistent with December 31, 2022 and March 31, 2023.
- On June 30, 2023, Stantec acquired Environmental Systems Design, Inc. (ESD), a 300-person firm headquartered in Chicago that provides building engineering services, specializing in mission critical and data center services.
- Net debt to adjusted EBITDA (on a trailing twelve-month basis) at June 30, 2023 was 1.8x, remaining within Stantec’s internal target range of 1.0x to 2.0x, and reflecting the impact of funding the ESD acquisition on the last day of the reporting period.
- On June 27, 2023, Stantec issued $250 million senior unsecured notes due June 27, 2030 that bear interest at a fixed rate of 5.393% per annum. These notes were assigned an investment-grade credit rating of BBB by DBRS Limited. Additionally, the Company entered into and fully drew upon an unsecured bilateral term credit facility of $100 million that matures on June 17, 2024. The proceeds of both the notes and new term facility were used to repay a portion of existing indebtedness on the revolving credit facility.
Outlook:
Stantec is revising and increasing certain targets contained within the Company’s 2023 guidance (provided on page M-10 in the 2022 Annual Report) based on the strength of the Company’s financial performance to date and the outlook for the balance of this year.
Stantec is raising its guidance for net revenue and adjusted diluted EPS growth and narrowing the target range for adjusted EBITDA as a percentage of net revenue.
Source: (STN-T) Q2-2023 Earnings Release
CCL Industries (CCL-B-T) released its second-quarter fiscal 2023 results on Wednesday, August 9, 2023, after markets closed.
“Solid second quarter results were held by slowing demand in parts of the economy as higher interest rates took hold impacting consumer spending patterns. Avery and Checkpoint both continued to post organic growth, but more than offset by a modest decline in the CCL Segment and the pass through of energy, freight and raw materials deflation at Innovia.”
– Geoffrey T. Martin, President and Chief Executive Officer
Highlights:
- Net earnings decreased 4.6% to $155.9 million for the 2023 second quarter compared to $163.4 million for the 2022 second quarter. Basic and adjusted basic earnings per Class B share for the 2023 second quarter were $0.88 and $0.90, respectively, compared to basic and adjusted basic earnings per Class B share of $0.91 and $0.94, respectively, in the prior year second quarter. Foreign currency translation had a positive $0.05 per share impact on earnings.
- Sales for the second quarter of 2023 increased 1.8% to $1,644.5 million, compared to $1,615.2 million for the second quarter of 2022, with an organic decline of 4.5% offset by acquisition related growth of 1.0% and a 5.3% positive impact from foreign currency translation.
- Operating income for the second quarter of 2023 was $242.0 million compared to $247.8 million for the comparable quarter of 2022. Operating income for the 2022 second quarter included a $3.5 million non-cash acquisition accounting adjustment related to the acquired inventory from the Adelbras acquisition that was expensed in the Company’s cost of sales in the period. Foreign currency translation had a 5.8% positive impact on operating income for the comparable quarters.
- The Company recorded an expense for restructuring and other items of $2.9 million, primarily attributable to reorganization charges at CCL Design and transaction costs associated with acquisitions completed in the current year compared to $3.2 million for reorganization costs in the 2022 second quarter.
- Tax expense for the second quarter of 2023 was $47.7 million compared to $51.7 million in the prior year period. The effective tax rate for the 2023 second quarter was 24.0%, lower than the 24.4% for the 2022 second quarter due to a higher portion of the Company’s taxable income earned in lower tax jurisdictions.
CCL
- Sales increased 3.1% to $995.5 million on 3.0% organic decline, offset by 0.3% acquisition contribution and 5.8% positive impact from foreign currency translation
- Regional organic sales growth: low single digit in Europe and Latin America; North America and Asia Pacific declined low single digit and double digit, respectively
- Operating income $144.0 million, down 7.0%, 14.5% operating margin down 150 bps
- Label joint ventures added $0.03 earnings per Class B share
Avery
- Sales increased 13.3% to $268.0 million on 2.6% organic growth, 5.6% acquisition contribution and 5.1% positive impact from foreign currency translation
- Operating income $50.3 million, up 7.2%, 18.8% operating margin, down 100 bps
Checkpoint
- Sales increased 6.8% to $210.5 million on organic growth of 3.3% and 3.5% positive impact from foreign currency translation
- Operating income $28.1 million, up 24.3%, 13.3% operating margin, up 180 bps
Innovia
- Sales decreased 21.2% to $170.5 million with 26.6% organic decline partially offset by 5.4% postive impact from foreign currency translation
- Operating income $19.6 million, down 16.2%, 11.5% operating margin, up 70 bps
Outlook:
- Core CCL business units’ face slower volume at many consumer packaged goods customers
- CCL Design: expect modest improvement by Q4 as comps ease, computer industry demand slowly recovers and new business wins kick in
- CCL Secure demand picture unchanged for second half
- Avery solid, back to school replenishment orders the only unknown
- Checkpoint: favorable as inflation recovery and RFID strength continue
- Innovia volume expected to slowly recover in second half, inflation benign
- FX tailwind to continue at current exchange rates
Source: (CCL-B-T) Q2-2023 Earnings Release
Algonquin Power & Utilities (AQN-T) released its second-quarter fiscal 2023 results on Thursday, August 10, 2023, before markets opened.
“While our second quarter 2023 results were negatively impacted by unfavourable weather, we remain focused on our growth outlook and long-term success.”
– Chris Huskilson, Interim Chief Executive Officer
Highlights:
- Revenue of $627.9 million, an increase of 1%;
- Adjusted EBITDA1 of $277.7 million, a decrease of 4%;
- Adjusted Net Earnings of $56.2 million, a decrease of 49%; and
- Adjusted Net Earnings per common share of $0.08, a decrease of 50%, in each case on a year-over-year basis.
Outlook:
Algonquin Brief: Chris Huskilson Appointed Interim CEO, Succeeding Arun Banskota; Board Commencing Search for a Permanent CEO
Following a strategic review, the company determined that focusing on the regulated business and going forward with a sale of the renewable business is the best path forward.
The company expects to sell the renewables business as a whole rather than in parts as management sees significant value in the development pipeline.
“We believe the value of our assets is not fully realized in our current structure. We therefore determined that focusing on our regulated business going forward and pursuing a sale of the renewables business is the best path forward for AQN.”
– Chris Huskilson, Interim Chief Executive Officer
Source: (AQN-N) Q2-2023 Earnings Release
Canadian Tire (CTC-A-T) released its second-quarter fiscal 2023 results on Thursday, August 10, 2023, before markets opened.
“As inflation persisted and rate hikes continued, consumer demand for discretionary goods softened, particularly in the latter half of the quarter, and Canadians shifted to more essentials within our multi-category assortment. Loyalty sales continue to outperform non-member spend, driving an increase in loyalty penetration. During this time of macroeconomic uncertainty, Triangle Rewards remains our most important driver in delivering value for our customers.”
– Greg Hicks, President and Chief Executive Officer
Highlights:
- Consolidated comparable sales were up 0.1%, following strong growth of 5.0% in Q2 2022
- Normalized diluted Earnings Per Share (“EPS”) was $3.08, compared to $3.11 in Q2 2022; Diluted EPS was $1.76, compared to $2.43 in Q2 2022
- Loyalty sales as a percentage of retail sales up 80 bps in the quarter
Outlook:
The current macroeconomic environment and consumer demand differ significantly from the Company’s expectations when it set out its strategy and 2022-2025 financial aspirations (average annual Comparable sales growth, Retail Return on Invested Capital and Diluted EPS) at its Investor Day in March 2022. Since early 2022, the cumulative effect of increasing inflationary pressure and higher interest rates on consumer spend and financing costs, along with higher inventory costs, has significantly impacted the Company’s ability to deliver against its previous expectations. Given the slower pacing of growth, and the noticeable slowdown in retail sales during the second quarter of 2023, the Company is withdrawing its previously disclosed financial aspirations at this time.
Despite the near-term consumer demand environment, the Company remains committed to pursuing the strategic objectives that demonstrate its long-term vision and build on its strong market position. The Company also continues to invest in the strategic initiatives outlined in the Better Connected strategy to grow earnings, and continues to make progress on the key initiatives highlighted above, to solidify CTC’s brand and competitive positioning in Canada over the long-term.
Source: (CTC-A-T) Q2-2023 Earnings Release
Emera Inc. (EMA-T) released its second-quarter fiscal 2023 results on Friday, August 11, 2023, before markets opened.
“Our team continues to execute well on our proven strategy and despite the continued headwinds of high interest rates and overall inflationary pressures, we are driving solid results for customers and shareholders. As economic growth continues in our service territories, we remain focused on meeting growing demand and achieving a balanced energy transition that delivers increasingly clean energy while maintaining grid reliability and continues to consider cost impacts for customers, all while providing predictable, reliable earnings and cash flow growth for our shareholders.”
– Scott Balfour, President and Chief Executive Officer
Highlights:
- Quarterly adjusted EPS increased $0.01 to $0.60 compared to $0.59 in Q2 2022. Quarterly reported net income per common share increased $0.35 to $0.10 in Q2 2023 compared to a net loss per common share of $(0.25) in Q2 2022 due to lower mark-to-market (“MTM”) losses.
- Year-to-date, adjusted EPS increased $0.07 or 5% to $1.58 compared to $1.51 in 2022. Year-to-date reported EPS increased by $1.05 to $2.17 from $1.12 in 2022 due to MTM gains in 2023 compared to MTM losses in 2022.
- Adjusted EPS contributions from our regulated utilities increased 8% for the quarter and 3% year-to-date primarily driven by rate supported capital investments and continued customer growth partially offset by higher interest expense and less favourable weather. On a consolidated basis these increases were partially offset by higher corporate interest expense and lower contributions from Emera Energy Services (“EES”) during the quarter.
- On track to deploy $2.8 billion in capital in 2023 with $1.4 billion invested in the first half of the year.
Outlook:
There have been no material changes in Emera’s business overview and outlook from the Company’s 2022 annual MD&A other than the updates as disclosed below. Emera’s year-to-date results have been impacted by macroeconomic conditions, specifically higher interest rates as well as other impacts of inflation. These macroeconomic conditions are likely to continue for the near term. For information on general economic risk, including interest rate and inflation risk, refer to the “Enterprise Risk and Risk Management – General Economic Risk” in Emera’s 2022 annual MD&A. For details on Emera’s reportable segments, refer to note 1 of the Q2 2023 unaudited condensed consolidated interim financial statements.
Source: (EMA-T) Q2-2023 Earnings Release
