Last updated by BM on August 07, 2023
Summary
- This is a weekly installment of our MP Market Review series, which provides updates on the financial markets and Canadian dividend growth companies we monitor on ‘The List’.
- Last week, ‘The List’ was down with a YTD price return of +3.9% (capital). Dividend growth remained the same and is now at +8.4% YTD, highlighting growth in income over the past year.
- Last week, no dividend increases from companies on ‘The List’.
- Last week, nine earnings reports from companies on ‘The List’.
- Eight companies on ‘The List’ are due to report earnings this week.
- If you’re interested in creating your own dividend growth income portfolio, consider subscribing to our premium service, which grants you access to the MP Wealth-Builder Model Portfolio (CDN) and exclusive subscriber-only content. Learn More
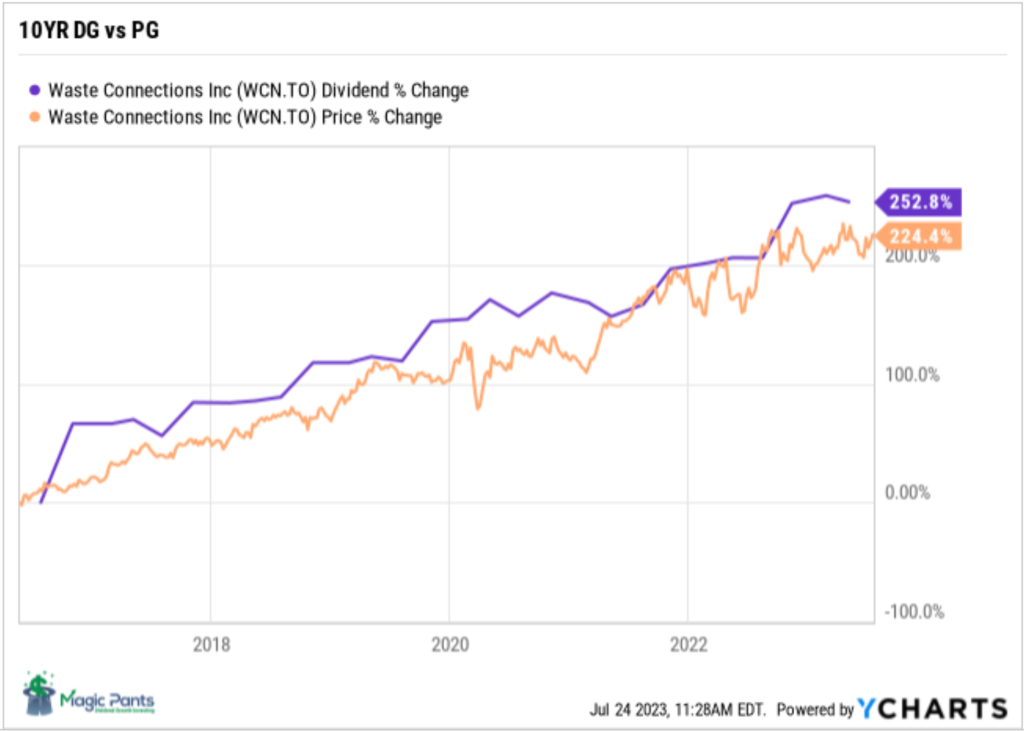
Identifying companies whose dividend growth aligns closely with price growth can considerably enhance the predictability of future returns. Dividend growth investors know that the dividend drives the price in a predictable way, not the other way around. Waste Connections (WCN-T) is another company on ‘The List’ that follows this dividend growth principle.
Introduction
“You have a pair of pants. In the left pocket, you have $100. You take $1 out of the left pocket and put it in the right pocket. You now have $101. There is no diminution of dollars in your left pocket. That is one magic pair of pants.”
This ‘magic pants’ analogy was from a Seeking Alpha article on dividend investing I read about a decade ago and was one of the catalysts for me to take a closer look at this type of investing and see if it truly was magical.
After conducting additional research, I have shifted towards utilizing a dividend growth investing (DGI) strategy as my primary investment approach. While I maintain portfolios consisting of high-quality dividend growers from both the United States and Canada, I have opted to concentrate on Canadian (CDN) dividend growth companies in this blog. This is due to several reasons, including a smaller pool of DGI companies to track, a lack of coverage for the DGI strategy by the North American investment media, and a tendency for those who do cover DGI to narrowly focus on only a handful of sectors (Energy and Financials).
While ‘The List’ is not a portfolio in itself, it serves as an excellent initial reference for individuals seeking to diversify their investments and attain higher returns in the Canadian stock market. Through our blog, we provide weekly updates on ‘The List’ and offer valuable perspectives and real-life examples of the dividend growth investing strategy in practice. This helps readers gain a deeper understanding of how to implement and benefit from this investment approach.
DGI Thoughts
“I do believe it is possible for a minority of investors to get significantly better results than average. Two conditions are necessary for that. One is that they must follow some sound principles of selection that are related to the value of securities and not to their market price. The other is that their method of operation must be basically different from that of the majority of security buyers. They have to cut themselves off from the general public and put themselves into a different category.”
– Benjamin Graham, The Intelligent Investor, 1949
The above quote is found on our blog’s ‘About’ page, as it is one of the reasons we embraced the dividend growth strategy years ago. By doing so, we were able to “cut ourselves off from the general public and put ourselves into a different category.” It is interesting to find a quote written almost seventy-five years ago still relevant today as per a recent study in the Financial Analysts Journal earlier this year.
This is why stock picking is so hard – and index investing so easy – for favourable returns (Globe & Mail)
The article referenced in the Globe & Mail, and featured in the most recent issue of the Financial Analysts Journal (Spring 2023) proposes that market index returns are predominantly characterized by positive skewness. The article further emphasizes the high level of risk associated with deviating from the benchmark index weights assigned to individual stocks unless one possesses distinctive proprietary insights.
Graham’s version of ‘proprietary insights’ would be those investors who follow some sound principles of selection that are related to the value of securities and not to their market price and where their method of operation is different from that of the majority of security buyers.
The study goes on to say… “The wealth created by stock markets is largely attributable to large positive outcomes to relatively few stocks. Investors without a comparative advantage in identifying these few stocks are better off in a broad-based index fund.”
In our dividend growth investing strategy, we can identify the few stocks the study speaks of. Quality companies with a dividend growth record of many years skew the probability of a successful outcome in our favour. Owning the few and not the many is how we have outperformed the indexes for many decades.
The study also questions whether you need to pay for an actively managed equity portfolio at all. We tend to agree. Unless your wealth manager can consistently outperform the index (after fees), what is the point.
If you have not yet joined as a paid subscriber of the blog to receive DGI Alerts on the activity and content related to our model portfolio, it’s not too late. Click Here.
Recent News
TC Energy has a plan for recovery. Here’s why investors should pay attention (Globe & Mail)
According to the author there are at least four reasons to consider buying the stock at its beaten-up lows:
- The dividend yield is near the high end of its historical range and appears safe according to its payout ratio. The company also reiterated in its most recent earnings report that it plans to raise the dividend between 3-5 percent through the end of 2026.
- The stock is sensibly priced.
- All pipelines are going through the same negative sentiment in the media.
- The announced spin-off of its oil and natural gas pipelines might actually be a good idea.
We agree and have been buying TC Energy on the way down for our model portfolio. In the short term, we will be happy to collect the above-average and growing dividend.
To receive breaking news about companies on ‘The List’ follow us on Twitter @MagicPants_DGI.
The List (2023)
Last updated by BM on August 04, 2023
The Magic Pants List contains 27 Canadian dividend growth stocks. ‘The List’ contains Canadian companies that have raised their dividend yearly for at least the last ten years and have a market cap of over a billion dollars. Below is each stock’s symbol, name, current yield, current price, price return year-to-date, current dividend, dividend growth year-to-date and current dividend growth streak. Companies on ‘The List’ are added or subtracted once a year, on January 1. After that, ‘The List’ is set for the next twelve months. Prices and dividends are updated weekly.
| SYMBOL | COMPANY | YLD | PRICE | YTD % | DIV | YTD % | STREAK |
|---|---|---|---|---|---|---|---|
| AQN-N | Algonquin Power & Utilities | 6.5% | $7.76 | 15.3% | $0.51 | -29.0% | 12 |
| ATD-T | Alimentation Couche-Tard Inc. | 0.8% | $65.99 | 9.7% | $0.56 | 19.1% | 13 |
| BCE-T | Bell Canada | 6.8% | $56.28 | -6.6% | $3.82 | 5.0% | 14 |
| BIP-N | Brookfield Infrastructure Partners | 4.4% | $32.75 | 5.2% | $1.44 | 6.3% | 15 |
| CCL-B-T | CCL Industries | 1.7% | $61.85 | 6.5% | $1.06 | 10.4% | 21 |
| CNR-T | Canadian National Railway | 2.0% | $156.45 | -3.9% | $3.16 | 7.8% | 27 |
| CTC-A-T | Canadian Tire | 3.9% | $178.75 | 21.9% | $6.90 | 17.9% | 12 |
| CU-T | Canadian Utilities Limited | 5.7% | $31.22 | -15.5% | $1.79 | 1.0% | 51 |
| DOL-T | Dollarama Inc. | 0.3% | $85.54 | 7.1% | $0.27 | 23.8% | 12 |
| EMA-T | Emera | 5.4% | $51.04 | -3.0% | $2.76 | 3.0% | 16 |
| ENB-T | Enbridge Inc. | 7.4% | $48.08 | -9.8% | $3.55 | 3.2% | 27 |
| ENGH-T | Enghouse Systems Limited | 3.0% | $28.15 | -21.2% | $0.85 | 18.2% | 16 |
| FNV-N | Franco Nevada | 1.0% | $139.96 | 1.3% | $1.36 | 6.3% | 15 |
| FTS-T | Fortis | 4.2% | $53.74 | -2.9% | $2.26 | 4.1% | 49 |
| IFC-T | Intact Financial | 2.2% | $196.70 | 0.5% | $4.40 | 10.0% | 18 |
| L-T | Loblaws | 1.5% | $115.90 | -3.7% | $1.74 | 10.3% | 11 |
| MGA-N | Magna | 3.0% | $60.90 | 5.9% | $1.84 | 2.2% | 13 |
| MRU-T | Metro | 1.7% | $69.90 | -7.4% | $1.21 | 10.0% | 28 |
| RY-T | Royal Bank of Canada | 4.2% | $128.25 | 0.2% | $5.34 | 7.7% | 12 |
| SJ-T | Stella-Jones Inc. | 1.4% | $67.05 | 35.2% | $0.92 | 15.0% | 18 |
| STN-T | Stantec Inc. | 0.8% | $90.55 | 38.6% | $0.77 | 8.5% | 11 |
| TD-T | TD Bank | 4.4% | $86.40 | -1.4% | $3.84 | 7.9% | 12 |
| TFII-N | TFI International | 1.1% | $131.23 | 31.1% | $1.40 | 29.6% | 12 |
| TIH-T | Toromont Industries | 1.5% | $113.00 | 15.6% | $1.68 | 10.5% | 33 |
| TRP-T | TC Energy Corp. | 7.7% | $48.19 | -9.6% | $3.69 | 3.4% | 22 |
| T-T | Telus Corp. | 6.2% | $22.97 | -12.7% | $1.43 | 7.3% | 19 |
| WCN-N | Waste Connections | 0.7% | $141.96 | 7.8% | $1.02 | 7.4% | 13 |
| Averages | 3.3% | 3.9% | 8.4% | 19 |
Six Canadian stocks on ‘The List’ declare earnings and dividends in US dollars and are inter-listed on a US exchange in US dollars. The simplest way to display dividend and price metrics for these stocks is to show their US exchange symbols along with their US dividends and price. The stocks I am referring to have a -N at the end of their symbols. You can still buy their Canadian counterparts (-T), but your dividends will be converted into CDN dollars and will fluctuate based on the exchange rate.
Note: When the dividend and share price currency match, the calculation is straightforward. But it’s not so simple when the dividend is declared in one currency, and the share price is quoted in another. Dividing the former by the latter would produce a meaningless result because it’s a case of apples and oranges. To calculate the yield properly, you must express the dividend and share price in the same currency.
Performance of ‘The List’
Feel free to click on this link, ‘The List’ for a sortable version from our website.
Last week, ‘The List’ was down with a YTD price return of +3.9% (capital). Dividend growth remained the same and is now at +8.4% YTD, highlighting growth in income over the past year.
The best performers last week on ‘The List’ were TC Energy Corp. (TRP-T), up +6.50%; TFI International (TFII-N), up +2.93%; and Stantec Inc. (STN-T), up +1.93%.
Brookfield Infrastructure Partners (BIP-N) was the worst performer last week, down -7.17%.
Dividend Increases
“The growth of dividend paying ability is of significance in the determination of a stock’s quality, or general safety…”
– Arnold Bernhard (the founder of Value Line)
“As a dividend increase is a positive sign of a company’s financial strength, the safest purchase, after research, is a stock with a recent dividend increase.”
– Tom Connolly (the founder of dividendgrowth.ca)
Last week, no dividend increases from companies on ‘The List’.
Earnings Releases
Benjamin Graham once remarked that earnings are the principal factor driving stock prices.
Each quarter we will provide readers with weekly earnings updates of stocks on ‘The List’ during the calendar earnings season.
The updated earnings calendar can be found here.
Earnings growth and dividend growth tend to go hand in hand, so this information can tell us a lot about the future dividend growth of our quality companies. Monitoring our dividend growers periodically is part of the process, and reading the quarterly earnings releases is a good place to start.
Eight earnings reports from companies on ‘The List’ this week
Franco Nevada (FNV-N) will release its second-quarter fiscal 2023 results on Tuesday, August 8, 2023, after markets close.
Metro (MRU-T) will release its third-quarter fiscal 2023 results on Wednesday, August 9, 2023, before markets open.
Stella-Jones Inc. (SJ-T) will release its second-quarter fiscal 2023 results on Wednesday, August 9, 2023, before markets open.
Stantec (STN-T) will release its second-quarter fiscal 2023 results on Wednesday, August 9, 2023, after markets close.
CCL Industries (CCL-B-T) will release its second-quarter fiscal 2023 results on Wednesday, August 9, 2023, after markets close.
Algonquin Power & Utilities (AQN-T) will release its second-quarter fiscal 2023 results on Thursday, August 10, 2023, before markets open.
Canadian Tire (CTC-A-T) will release its second-quarter fiscal 2023 results on Thursday, August 10, 2023, before markets open.
Emera Inc. (EMA-T) will release its second-quarter fiscal 2023 results on Friday, August 11, 2023, before markets open.
Last week, nine companies on ‘The List’ reported earnings.
TFI International (TFII-N) released its second-quarter fiscal 2023 results on Monday, July 31, 2023, after markets closed.
“Despite a difficult freight market and reduced volumes industrywide, our results reflect the quality of our operations and our team’s skill in responding to rapidly changing market conditions. We produced solid operating ratios across all our business segments while again generating more than $200 million in net cash from operating activities. During challenging times for our industry, TFI International’s relentless focus on our longstanding operating principles, our business line diversity and niche positioning, and our ongoing progress on multiple self-help initiatives are what differentiates our performance and future potential. TFI’s strong financial foundation and focus on profitability and cash flow is allowing us to remain strategic in our allocation of capital, remaining active in M&A including seven completed acquisitions year to date, while also returning capital to shareholders through both our dividend, with our Board approving a 30% increase over the past year, and our opportunistic share repurchases. I wish to thank the talented men and women of TFI for their hard work in our continual quest to create shareholder value.”
– Alain Bedard, President and Chief Executive Officer
Highlights:
- Second quarter operating income of $192.4 million compares to $391.0 million the same quarter last year, primarily reflecting reduced freight volumes, $60.6 million reduction in gains on sale of real estate assets held for sale, $5.8 million of IT systems and related transition expenses in U.S. LTL, $5.3 million unfavorable variance in the MTM of DSUs, $6.1 million unfavorable currency translation impact1 relative to the same period last year and $23.0 million from the divestiture of CFI.
- Net income of $128.2 million compares to $276.8 million in Q2 2022. Diluted earnings per share (diluted “EPS”) of $1.47 compares to $3.00 in Q2 2022, due in part to the elements discussed above.
- Adjusted net income , a non-IFRS measure, of $138.9 million compares to $241.1 million in Q2 2022, due in part to the elements discussed above.
- Adjusted diluted EPS , a non-IFRS measure, of $1.59 compares to $2.61 in Q2 2022, due in part to the elements discussed above.
- Net cash from operating activities of $200.4 million compares to $247.8 million in Q2 2022.
- Free cash flow , a non-IFRS measure, of $138.1 million compares to $309.6 million in Q2 2022, with the decrease primarily driven by lower freight volumes and $89.5 million in sales of real estate in the prior year period.
- The Company’s reportable segments performed as follows:
- Package and Courier operating income decreased 26% to $27.1 million;
- Less-Than-Truckload operating income decreased 57% to $80.7 million, driven primarily by weaker volume and a $54.6 million gain on real estate in the prior year quarter;
- Truckload operating income decreased 48% to $66.2 million, driven partially by the divested CFI operations that had contributed $22.8 million in the prior year quarter, as well as a gain on sale of real estate of $6.2 million in the prior year quarter; and
- Logistics operating income decreased 22% to $32.9 million.
- During the quarter, TFI International acquired SM Freight which will operate in the TL segment, Launch Logistics which will operate in the Logistics segment and Placements Jonadagi which will operate in the TL segment. Subsequent to quarter end TFI International completed the acquisition of Siemens Transportation Group which will operate in the LTL segment.
Outlook:
The North American economic growth forecast from leading economists remains subdued and uncertain due to a variety of factors including elevated interest rates, high inflation, labor shortages, global supply chain challenges, and slower growth in many international markets. Despite reduced freight volumes industrywide, TFI International’s diversity across industrial and consumer end markets and across many modes of transportation, along with the Company’s disciplined approach to operations, helped support results during the second quarter. However, macro conditions have slowed and the possibility of economic recession over the coming year remains.
TFI International remains vigilant in its monitoring for new potential risks that could cause further economic disruption, resulting in additional rounds of declining freight volumes and higher costs that could adversely affect TFI’s operating companies and the markets they serve. Lower diesel prices in the months ahead could cause a continued earnings headwind. Other uncertainties include but are not limited to geopolitical risk such as the ongoing war in Ukraine, weakening labor market conditions and reduced consumer sentiment that can affect end market demand, policy changes surrounding international trade, environmental mandates, interest rate policies and changes to the tax code in any jurisdictions in which TFI International operates.
While North American economic uncertainty is likely to continue weighing on freight demand dynamics, management believes the Company is well positioned to navigate these difficult operating conditions, benefiting from its financial foundation and strong cash flow that allows for a strategic approach to the business. The Company strives for a lean cost structure and has a longstanding focus on profitability, efficiency, network density, customer service, optimal pricing, driver retention, and capacity rationalization. TFI also continues to have material synergy opportunities related to the 2021 acquisition of TForce Freight and has opportunities to enhance performance within most of its other operations. Longer term, TFI’s diverse industrial exposure through its specialized TL and LTL segments should continue to benefit from a gradual shift toward domestic manufacturing, while its P&C and Logistics business segments should benefit over the long term from the expansion of e-commerce.
Regardless of the operating environment, management’s goal is to build shareholder value through consistent adherence to its operating principles, including customer focus, an asset-light approach, and continual efforts to enhance efficiencies. In addition, TFI International values free cash flow generation and strong liquidity with a conservative balance sheet that features a high portion of attractive fixed-rate spreads and limited near-term debt maturities. This strong financial footing allows the Company to prudently invest and pursue select, accretive acquisitions while returning excess capital to shareholders.
Source: (TFII-N) Q2-2023 Earnings Release
Fortis (FTS-T) released its second-quarter fiscal 2023 results on Wednesday, August 2, 2023, before markets opened.
“We are pleased to report our second quarter results which reflect the growth of our utilities as they continue to execute the 2023 capital plan. Our strong financial results demonstrate the success of our regulated growth strategy, and the sale of Aitken Creek, expected to close later this year, reflects our focus on that strategy.
From an operational perspective, our systems performed well during the quarter, even when faced with extreme weather events in Western Canada. Our 2023 Sustainability Report, released today, highlights progress on our climate, diversity and other ESG priorities. The foundation of our sustainability strategy is to deliver cleaner energy to our customers by making investments in a safe, reliable energy grid without compromising on affordability.”
– David Hutchens, President and Chief Executive Officer
Highlights:
- Second quarter net earnings of $294 million or $0.61 per common share, up from $284 million or $0.59 per common share in 2022
- Adjusted net earnings per common share of $0.62, up from $0.57 in the second quarter of 2022
- Capital expenditures of $2.0 billion in the first half of 2023; $4.3 billion annual capital plan on track
- 2023 Sustainability Update Report released highlighting the Corporation’s progress on key sustainability initiatives
- Tucson Electric Power’s rate application continues to progress with a decision anticipated in Q3
Outlook:
Fortis continues to enhance shareholder value through the execution of its capital plan, the balance and strength of its diversified portfolio of regulated utility businesses, and growth opportunities within and proximate to its service territories. While energy price volatility, global supply chain constraints, increasing interest rates and inflation represent potential concerns, the Corporation does not expect these factors to have a material impact on its operations or financial results in 2023.
Fortis is executing on the transition to a cleaner energy future and is on track to achieve its corporate-wide targets to reduce GHG emissions by 50% by 2030 and 75% by 2035. The Corporation’s additional 2050 net-zero direct GHG emissions target reinforces Fortis’ commitment to further decarbonize over the long-term, while preserving customer reliability and affordability.
The Corporation’s $22.3 billion five-year capital plan is expected to increase midyear rate base from $34.1 billion in 2022 to $46.1 billion by 2027, translating into a five-year compound annual growth rate of 6.2%.
Beyond the five-year capital plan, additional opportunities to expand and extend growth include: further expansion of the electric transmission grid in the U.S. to facilitate the interconnection of cleaner energy, including infrastructure investments associated with the Inflation Reduction Act of 2022 and the Midcontinent Independent System Operator, Inc. long-range transmission plan; climate adaptation and grid resiliency investments; renewable gas solutions and liquefied natural gas infrastructure in British Columbia; and the acceleration of cleaner energy infrastructure investments across our jurisdictions.
Fortis expects its long-term growth in rate base will drive earnings that support dividend growth guidance of 4-6% annually through 2027, and is premised on the assumptions and material factors listed under “Forward-Looking Information”.
Source: (FTS-T) Q2-2023 Quarterly Report
Waste Connections (WCN-N) released its second-quarter fiscal 2023 results on Wednesday, August 2, 2023, after markets closed.
“We are extremely pleased by the strength of operational execution during the quarter for a solid beat on revenue and adjusted EBITDA to deliver margins 30 basis points above our outlook. Solid waste core pricing growth of 9.8% positioned us to expand underlying solid waste collection, transfer and disposal margins by one hundred basis points in the period, largely overcoming the ongoing headwinds from year-over-year declines in recovered commodity values and continued inflationary pressures during the period.
Our performance in the first half of 2023, along with recent acquisitions and reduced headwinds from fuel and other commodity-related impacts, positions us to increase our full year outlook for adjusted EBITDA to approximately $2.525 billion, expanding our adjusted EBITDA margin to 31.5%, up 40 basis points from our initial outlook and up 70 basis points as compared to the prior year.
The strength of our results reflects our focus on quality of revenue through the shedding of low margin volumes and furthered by strategic acquisitions, including Arrowhead, a $100 million revenue integrated transportation and disposal network with rail access providing enhanced internalization opportunities to our operations across the Northeast. Already having completed acquisitions with over $160 million in annualized solid waste revenue year to date, we see plenty of runway and opportunity for continued activity throughout the balance of the year. Most importantly, we are encouraged by improving trends in safety and employee retention, as we double down on human capital in our decentralized operating model, including through the realignment of our organizational structure with the addition of a sixth region and refinements to our corporate operational structure, and we look forward to driving outsized margin expansion in the second half of 2023 and into 2024.””
– Ronald J. Miittelstaedt, President and Chief Executive Officer
Highlights:
- Top-to-bottom beat led by solid execution in Q2 sets up increases to full year 2023 outlook
- Revenue of $2.021 billion, above outlook and up 11.3% year over year
- Net income of $209.2 million, and adjusted EBITDA of $628.9 million, above outlook
- Adjusted EBITDA margin of 31.1% of revenue, 30bps above outlook
- Net income of $0.81 per share, and adjusted net income of $1.02 per share
- Year to date net cash provided by operating activities of $1.017 billion and adjusted free cash flow of $630.0 million, or 16.1% of revenue
- Year to date closed acquisitions with over $160 million of total annualized revenue, including Arrowhead Environmental Holdings, LLC (“Arrowhead”), the largest integrated waste-to-rail disposal network in the Northeast U.S.
- Updates full year 2023 outlook to net income of approximately $931 million, increasing adjusted EBITDA to approximately $2.525 billion or 31.5% on revenue of approximately $8.025 billion
Outlook:
Waste Connections also updated its outlook for 2023, which assumes no change in the current economic environment or underlying economic trends. The Company’s outlook excludes any impact from additional acquisitions that may close during the year, and expensing of transaction-related items. The outlook provided below is forward looking, and actual results may differ materially depending on risks and uncertainties detailed at the end of this release and in our periodic filings with the U.S. Securities and Exchange Commission and the securities commissions or similar regulatory authorities in Canada. Certain components of the outlook for 2023 are subject to quarterly fluctuations. See reconciliations in the attached tables.
- Revenue is estimated to be approximately $8.025 billion, down $25 million from our original outlook to reflect a reduction in fuel and material surcharges of $35 million as a result of lower fuel costs.
- Net income is estimated to be approximately $931.0 million, and adjusted EBITDA is estimated to be approximately $2.525 billion, or about 31.5% of revenue, as compared to our original outlook for adjusted EBITDA of $2.500 billion or 31.1% of revenue.
- Capital expenditures are estimated to be approximately $950 million, up $25 million from our original outlook.
- Net cash provided by operating activities is estimated to be approximately $2.141 billion, and adjusted free cash flow is estimated to be approximately $1.225 billion, or about 15.3% of revenue.
Source: (WCN-N) Q2-2023 Results
Intact Financial (IFC-T) released its second-quarter fiscal 2023 results on Wednesday, August 2, 2023, after markets closed.
“With multiple severe weather events this quarter, our employees were often first on site in affected communities, offering a reassuring presence and support to customers in a time of need. Despite the scale of the fire, flood, and freeze events, we maintained a strong balance sheet and delivered a 13% operating ROE, a testament to the resilience of our operations. We will continue to leverage our experience with natural disasters to collaborate with governments and help communities adapt to climate change.”
– Charles Brindamour, Chief Executive Officer
Highlights:
- Operating DPW growth of 6% in Q2-2023 driven by rate actions in supportive market conditions
- Net operating income per share decreased 30% to $2.30, largely due to an increase in catastrophe losses to $421 million, partially offset by higher investment income
- EPS of $1.30 was lower than last year, which had benefited from the sale of Codan Denmark and large gains on equity investments
- Combined ratio of 92.2% (96.3% undiscounted) included 8 points of catastrophe losses that were twice as high as expected, while underlying performance was strong in all geographies
- Personal auto results were strong at a 91.2% combined ratio , reflecting our profitability actions and moderating inflation
- Operating ROE of 12.8% (and ROE of 9.0%) despite elevated catastrophe losses and $2.5 billion of total capital margin
Outlook:
- Over the next twelve months, we expect the firm-to-hard insurance market conditions to continue in most lines of business, driven by inflation, natural disasters, and a hard reinsurance market.
- In Canada, we expect firm-to-hard market conditions in personal lines. Both personal property and auto premiums are expected to grow by high single-digits in response to inflation and evolving driving patterns.
- In commercial and specialty lines across all geographies, we expect hard market conditions to continue in most lines of business.
- In the UK&I , the personal property market is firming, with further rate increases expected.
Source: (IFC-T) Q2-2023 Quarterly Results
Brookfield Infrastructure Partners (BIP-N) released its second-quarter fiscal 2023 results on Thursday, August 3, 2023, before markets opened.
“Our business showcased its resilience during the second quarter, providing strong financial and operational results. We have also already accomplished most of our current year strategic initiatives, exceeding our annual deployment target and successfully executing our capital recycling program, with $1.9 billion in asset sales this year.”
– Sam Pollock, Chief Executive Officer
Highlights:
- Brookfield Infrastructure reported net income of $378 million for the three month period ended June 30, 2023 compared to net income of $176 million in the prior year. Current year results benefited from the contribution associated with recently completed acquisitions, organic growth across our base business and realized gains on each of the six asset sales that closed in the second quarter. These positive impacts were partially offset by higher borrowing costs associated with the financing of our growth initiatives.
- Funds from operations (FFO) for the second quarter was $552 million, increasing 8% relative to the comparable period. Results were supported by the contribution of approximately $2.1 billion of capital deployed in new acquisitions over the past year, partially offset by the impact of asset sales and borrowing costs associated with financing our new investments. Organic growth was near the high-end of our 6-9% target range, reflecting the benefit of elevated levels of inflation on tariff increases and the commissioning of approximately $1 billion in new capital projects over the last 12 months. Partially offsetting the strong underlying performance of our business was the normalization of market sensitive revenues, as the prior year benefited from elevated commodity prices.
Outlook:
We continue to find good opportunities to invest capital above our targeted return threshold. During the second quarter, we accelerated our global data center growth strategy through the acquisition of two marquee development platforms in Europe and North America, respectively. These investments fill gaps in our existing portfolio, which was regionally focused in South America, Australia and India. We now have an asset footprint in all our core markets and have become one of the largest developers in the world.
Brookfield Infrastructure continues to be successful in converting its advanced pipeline of capital recycling opportunities into completed sales. To date in this calendar year, we have secured $1.9 billion of asset sale proceeds, of which $1.4 billion has already closed. Generally, transactions are taking longer to complete and potential buyers have less access to capital. However, demand for highly contracted and essential infrastructure remains strong and we are focused on preparing for the next round of capital recycling initiatives in 2024.
Source: (BIP-N) Q2-2023 Quarterly Results
Bell Canada (BCE-T) released its second-quarter fiscal 2023 results on Thursday, August 3, 2023, before markets opened.
“Bell’s Q2 results demonstrate that our consistent strong execution and delivering the compelling services that our customers want and value is a winning approach.
Over the past several years, we have been laser focused on building the best networks, investing in growing our fibre footprint and delivering ever-faster mobile and Internet speeds. Bell pure fibre was ranked the fastest Internet in Canada in the Ookla Speedtest Awards report for Q1-Q2 2023, as well as the fastest Wi-Fi. We added 52,148 new net fibre customers in Q2, up 38.2% over last year, and our retail Internet net activations were up 10.2% to 24,934, our best Q2 result in 16 years. We surpassed a milestone of 10 million mobile phone subscribers, with service revenue up 4.4% on our highest Q2 postpaid net activations in 18 years. And we achieved these results against the backdrop of declining prices, demonstrating that our industry is delivering the highest quality services at decreasing prices, despite persistent inflation. Despite the continuing advertising recession across North America, our leading content and digital-first media strategy continues to pay off with Bell Media digital revenue up 20% over last year, and now comprising 33% of total Bell Media revenue.”
– Mirko Bibic, President and Chief Executive Officer
Highlights:
- 241,516 total wireless mobile phone and mobile connected device, retail Internet and IPTV net activations, up 76.5%
- 5% consolidated revenue growth delivered 2.1% higher adjusted EBITDA
- Net earnings of $397 million down 39.3% with net earnings attributable to common shareholders of $329 million, or $0.37 per common share, down 44.8%; adjusted net earnings of $722 million yielded a 9.2% decrease in adjusted EPS to $0.79
- Cash flows from operating activities down 8.9% to $2,365 million; free cash flow decreased to $1,016 million on timing of working capital and capital expenditures
- Wireless operating momentum continues: surpassed 10 million mobile phone subscribers; wireless service revenue grew 4.4% on highest Q2 postpaid net activations in 18 years, up 33.8% to 111,282 and 79,537 mobile connected device net activations, up 79,881
- Best Q2 retail Internet net activations since 2007, up 10.2% to 24,934; 52,148 fibre net activations, up 38.2%, delivered strong 7% residential Internet revenue growth; on pace to complete 85% of planned broadband buildout program by end of 2023
- Bell Media digital revenue up 20% as total media revenue and adjusted EBITDA declined 1.9% and 5.3% respectively, due to ongoing advertising recession
- Reconfirming all 2023 financial guidance targets
Outlook:
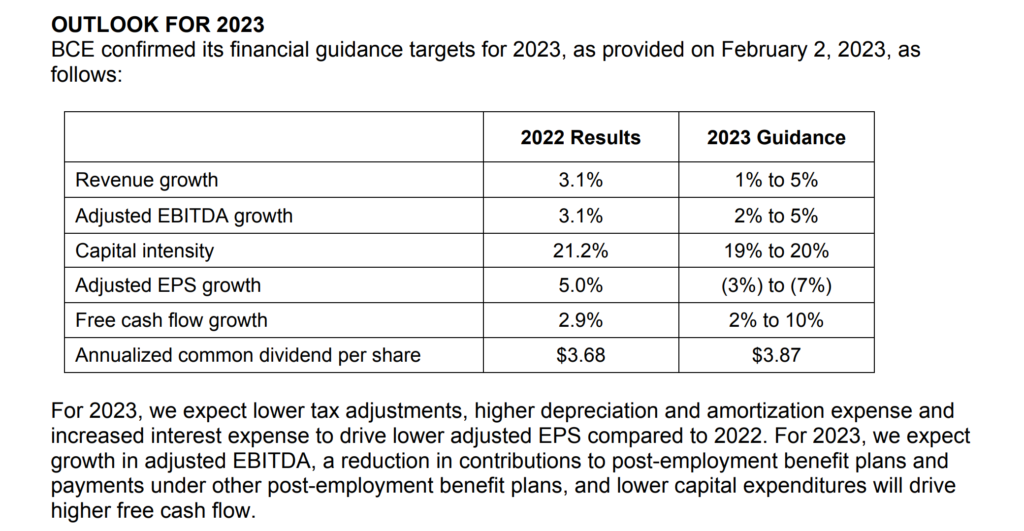
Source: (BCE-T) Q2-2023 Quarterly Results
Telus Corp. (T-T) released its second-quarter fiscal 2023 results on Friday, August 4, 2023, before markets opened.
“For the second quarter, our TELUS team once again demonstrated execution strength in our TTech business segment, characterized by the potent combination of leading customer growth, complemented by strong operational and financial results. Our robust performance in our core telecom business is underpinned by our globally leading broadband networks and customer-centric culture, which enabled our strongest second quarter on record, with total customer net additions of 293,000, up 19 per cent, year-over-year, driven by strong demand for our leading portfolio across Mobility and Fixed services.
At TELUS International, increasing macroeconomic pressure has temporarily impacted service demand from some of our larger tech clients as they aggressively address their own cost structures, slowing the expected rate of revenue and profit growth for 2023. In response, our TI team has actioned significant incremental cost efficiency efforts, including staff reductions, to address lower service volumes, and is driving additional automation and generative AI-enabled solutions to further optimize its cost structure and go-to-market sales opportunities. Despite these near-term challenges, we remain highly confident in TI’s strategy and investment thesis. This is amplified by meaningful opportunities in respect of digital transformation – particularly with generative AI adoption – and the continuing critical importance of differentiated digital customer experience solutions in the market, which remains a vibrant tailwind for TI’s medium- and long-term growth and profitability.”
– Darren Entwistle, President and Chief Executive Officer
Highlights:
- Consolidated Operating revenues and other income increased by $545 million in the second quarter of 2023 and $1,227 million in the first six months of 2023.
- Operating income decreased by $180 million in the second quarter of 2023 and $308 million in the first six months of 2023.
- Income before income taxes decreased by $406 million in the second quarter of 2023 and $675 million in the first six months of 2023 as a result of higher Financing costs and lower Operating income. The increase in Financing costs largely resulted from greater interest on long-term debt, excluding lease liabilities as well as the impact of virtual power purchase agreements unrealized change in forward element
- Income tax expense decreased by $104 million in the second quarter of 2023 and $193 million in the first six months of 2023.
- Net income attributable to Common Shares decreased by $268 million in the second quarter of 2023 and $436 million in the first six months of 2023, reflecting the after-tax impacts of higher Financing costs and lower Operating income.
- Basic EPS decreased by $0.20 or 58.8% in the second quarter of 2023 and $0.33 or 53.2% in the first six months of 2023, reflecting the after-tax impacts of higher Financing costs and lower Operating income, as well as the effect of a higher number of Common Shares outstanding.
- During the 12-month period ended on June 30, 2023, our total telecom subscriber connections increased by 1,206,000 or 7.0%. This reflected an increase of 3.9% in mobile phone subscribers, 22.1% in connected device subscribers, 9.3% in internet subscribers, 4.7% in TV subscribers and 9.7% in security subscribers, partly offset by a decline of 2.4% in residential voice subscribers.
- Free cash flow increased by $74 million in the second quarter of 2023 and $194 million in the first six months of 2023, primarily reflecting lower capital expenditures, partly offset by an increase in cash interest paid.
Outlook:
The assumptions for our 2023 outlook, as described in Section 9 in our 2022 annual MD&A, remain the same, except for the following:
- Our revised estimates for 2023 economic growth in Canada, B.C., Alberta, Ontario and Quebec are 0.9%, 0.5%, 1.9%, 0.5% and 0.4%, respectively (compared to 0.6%, 0.4%, 1.5%, 0.3% and 0.5%, respectively, as reported in our 2022 annual MD&A).
- Our revised estimates for 2023 annual inflation rates in Canada, B.C., Alberta and Ontario are 3.6%, 3.6%, 3.4% and 3.5%, respectively (compared to 3.7%, 3.7%, 3.8% and 3.6%, respectively, as reported in our 2022 annual MD&A).
- Our revised estimates for 2023 annual unemployment rates in Canada, B.C., Alberta, Ontario and Quebec are 5.6%, 5.2%, 6.0%, 5.8% and 4.6%, respectively (compared to 6.1%, 5.6%, 5.9%, 6.6% and 5.5%, respectively, as reported in our 2022 annual MD&A).
- Our revised estimates for 2023 annual rates of housing starts on an unadjusted basis in Canada, B.C., Alberta, Ontario and Quebec are 225,000 units, 42,000 units, 34,000 units, 80,000 units and 49,000 units, respectively (compared to 212,000 units, 34,000 units, 31,000 units, 71,000 units and 50,000 units, respectively, as reported in our 2022 annual MD&A).
Source: (T-T) Q2-2023 Quarterly Results
Enbridge Inc. (ENB-T) released its second-quarter fiscal 2023 results on Friday, August 4, 2023, before markets opened.
“Continuing our strong start to the year, Enbridge’s four businesses delivered another solid quarter of financial performance. Our first-choice customer service offering and operating reliability continue to result in high utilization across our systems. We continue to execute on our strategic priorities and are on track to achieve our full-year EBITDA and DCF per share guidance.”
– Greg Ebel, President and Chief Executive Officer
Highlights:
- Second quarter GAAP earnings of $1.8 billion or $0.91 per common share, compared with GAAP earnings of $0.5 billion or $0.22 per common share in 2022
- Adjusted earnings of $1.4 billion or $0.68 per common share, compared with $1.4 billion or $0.67 per common share in 2022
- Adjusted earnings before interest, income taxes and depreciation and amortization (EBITDA) of $4.0 billion, an increase of 8%, compared with $3.7 billion in 2022
- Cash provided by operating activities of $3.4 billion, compared with $2.5 billion in 2022
- Distributable cash flow (DCF) of $2.8 billion, an increase of 1%, compared with $2.7 billion in 2022
- Reaffirmed 2023 full year financial guidance for EBITDA and DCF and medium-term outlook
- Planning construction of the first phase of the Rio Bravo Pipeline which will transport 2.6 bcf per day of natural gas feedstock to supply Rio Grande LNG
- Extended and upsized the Flanagan South Pipeline (FSP) binding open season for US Gulf Coast delivery service
- Issued $0.4 billion aggregate amount of sustainability-linked bonds (SLB) in Canada, further strengthening Enbridge’s commitment to its emissions reduction goals
- Issued 22nd Sustainability Report, demonstrating the Company’s ongoing progress towards goals set in November 2020
- On track to achieve Debt-to-EBITDA in the lower half of the target range by year end, providing financial flexibility and demonstrating commitment to our equity-self funding model
Outlook:
The Company reaffirms its 2023 financial guidance for EBITDA and DCF. Results for the first six months of 2023 are in line with the Company’s expectations and the Company anticipates that its businesses will continue to experience strong capacity utilization and operating performance through the balance of the year with normal course seasonality.
Strong operational performance in the first half of the year is expected to be offset by higher financing costs, due to increased interest rates, and a lower toll on the Mainline.
Source: (ENB-T) Q2-2023 Earnings Presentation
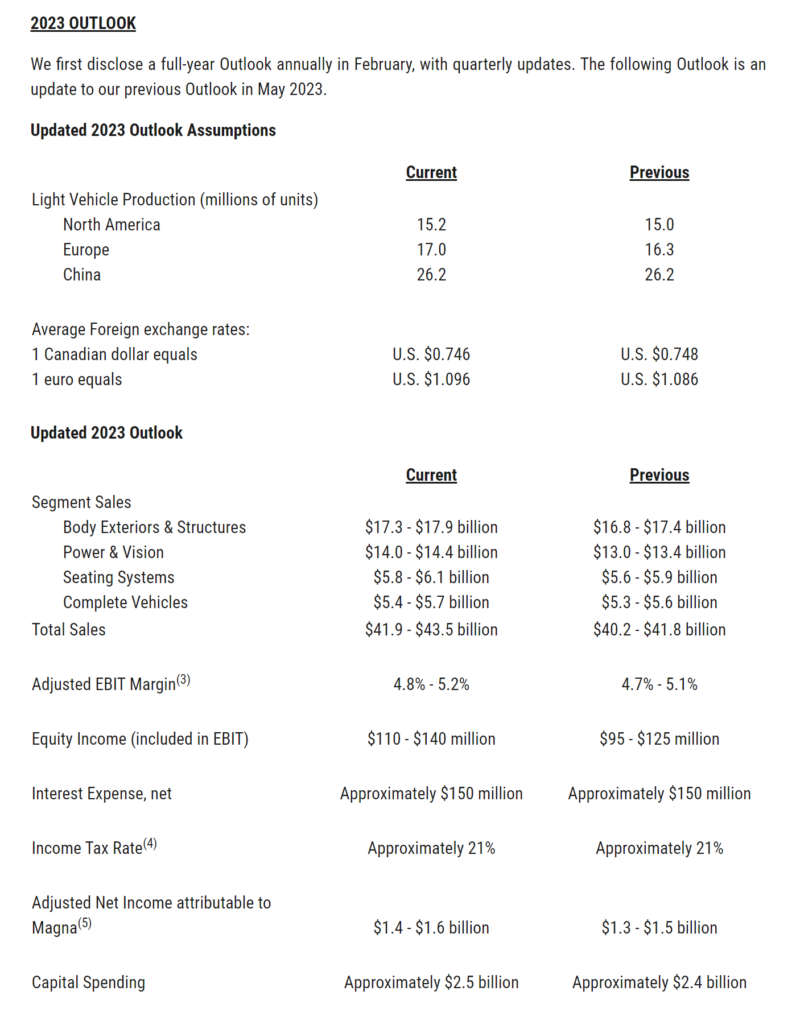
Magna (MGA-N) released its second-quarter fiscal 2023 results on Friday, August 4, 2023, before markets opened.
“I am pleased with our second quarter operating performance, which reflects continued strong execution on higher organic sales and cost reduction actions being taken across the company. We remain highly focused on executing our strategy and remain confident in our ability to meet our short- and long-term growth and margin outlooks.
With the closing of the Veoneer Active Safety acquisition, we have hit the ground running on integration plans and delivering synergies from the combined business.”
– Swamy Kotagiri, Chief Executive Officer
Highlights:
- Sales of $11.0 billion for the second quarter of 2023, an increase of 17% from the second quarter of 2022, which compares to a 15% increase in global light vehicle production, including 14%, 13% and 21% higher production in North America, Europe and China, respectively. In addition to higher global production, our sales benefitted from the launch of new programs and higher sales in our Complete Vehicles segment, while the net weakening of foreign currencies against the U.S. dollar negatively impacted sales.
- Adjusted EBIT increased to $603 million in the second quarter of 2023 compared to $358 million in the second quarter of 2022. Our focus on operational excellence and cost initiatives helped drive strong earnings on higher sales. In addition, the EBIT increase reflects losses in our Russian facilities during the second quarter of 2022, and commercial items in the second quarter of 2023 and 2022, which had a net favourable impact on a year over year basis. These were partially offset by higher production input costs net of customer recoveries, higher engineering, launch and other costs, including for new vehicle assembly business, and acquisitions, net of divestitures subsequent to the second quarter of 2022.
- Income from operations before income taxes was $483 million for the second quarter of 2023 compared to a loss of $88 million in the second quarter of 2022, which includes Other expense, net(2) of $86 million and $426 million in the second quarters of 2023 and 2022, respectively. Excluding Other expense, net from both periods, income from operations before income taxes increased $231 million in the second quarter of 2023 compared to the second quarter of 2022.
- Net income attributable to Magna International Inc. was $339 million for the second quarter of 2023 compared to a loss of $156 million in the second quarter of 2022, which includes Other expense, net(2), after tax of $91 million and $399 million in the second quarters of 2023 and 2022, respectively. Excluding Other expense, net, after tax from both periods, net income attributable to Magna International Inc. increased $187 million in the second quarter of 2023 compared to the second quarter of 2022.
- Diluted earnings per share increased to $1.18 in the second quarter of 2023, compared to a loss of $0.54 in the second quarter of 2022, and Adjusted diluted earnings per share increased 81% to $1.50 in the second quarter of 2023 compared to $0.83 in the second quarter of 2022.
- Generated cash from operations before changes in operating assets and liabilities of $879 million and used $332 million in operating assets and liabilities. Investment activities for the second quarter of 2023 included $1.48 billion to acquire Veoneer Active Safety, $502 million in fixed asset additions, a $96 million increase in investments, other assets and intangible assets, and $3 million in public and private equity investments.
Outlook: