Last updated by BM on July 03, 2023
Summary
- This is a weekly installment of our MP Market Review series, which provides updates on the financial markets and Canadian dividend growth companies we monitor on ‘The List’.
- Last week, ‘The List’ was up significantly with a YTD price return of +6.3% (capital). Dividend growth remained the same and is now at +8.4% YTD, highlighting growth in income over the past year.
- Last week, no dividend increases from companies on ‘The List’.
- Last week, one earnings report from companies on ‘The List’.
- No companies on ‘The List’ are due to report earnings this week.
- If you’re interested in creating your own dividend growth income portfolio, consider subscribing to our premium service, which grants you access to the MP Wealth-Builder Model Portfolio (CDN) and exclusive subscriber-only content. Learn More
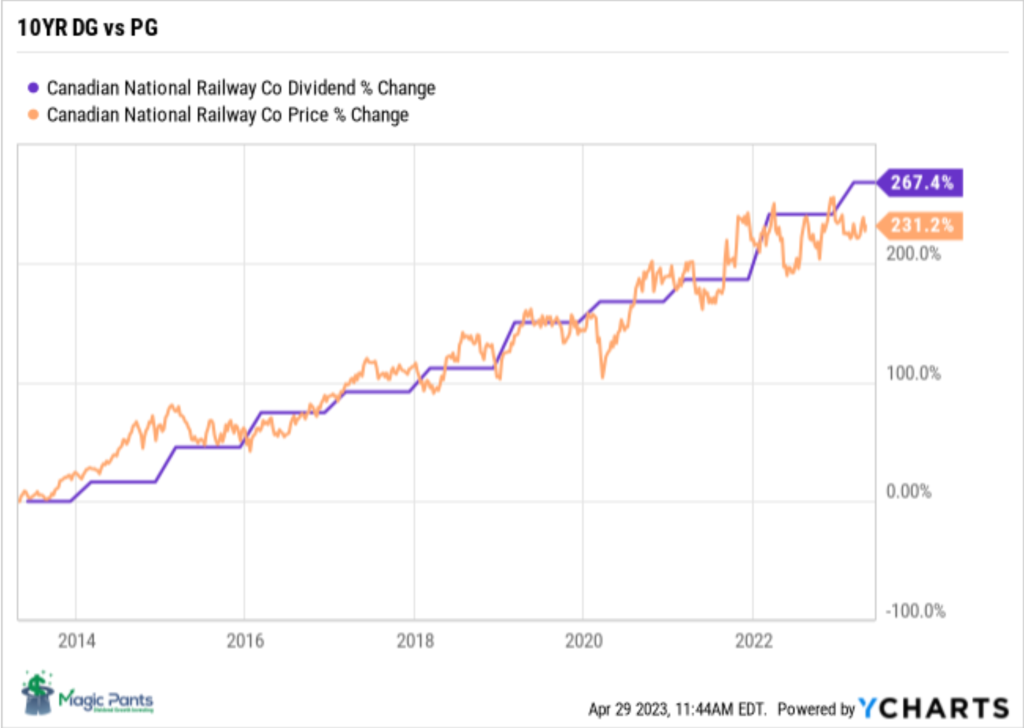
One of the most powerful concepts we have learned is how dividends work and how they ultimately drive portfolio performance. In the chart above, notice how Canadian National Railways dividend has driven it’s price higher in lock step with dividend growth over the last decade.
Introduction
“You have a pair of pants. In the left pocket, you have $100. You take $1 out of the left pocket and put it in the right pocket. You now have $101. There is no diminution of dollars in your left pocket. That is one magic pair of pants.”
This ‘magic pants’ analogy was from a Seeking Alpha article on dividend investing I read about a decade ago and was one of the catalysts for me to take a closer look at this type of investing and see if it truly was magical.
After conducting additional research, I have shifted towards utilizing a dividend growth investing (DGI) strategy as my primary investment approach. While I maintain portfolios consisting of high-quality dividend growers from both the United States and Canada, I have opted to concentrate on Canadian (CDN) dividend growth companies in this blog. This is due to several reasons, including a smaller pool of DGI companies to track, a lack of coverage for the DGI strategy by the North American investment media, and a tendency for those who do cover DGI to narrowly focus on only a handful of sectors (Energy and Financials).
While ‘The List’ is not a portfolio in itself, it serves as an excellent initial reference for individuals seeking to diversify their investments and attain higher returns in the Canadian stock market. Through our blog, we provide weekly updates on ‘The List’ and offer valuable perspectives and real-life examples of the dividend growth investing strategy in practice. This helps readers gain a deeper understanding of how to implement and benefit from this investment approach.
DGI Thoughts
“Nowhere does history indulge in repetitions so often or so uniformly as in Wall Street. When you read contemporary accounts of booms or panics, the one thing that strikes you most forcibly is how little either stock speculation or stock speculators today differ from yesterday. The game does not change and neither does human nature.”
– Edwin Lefevre, Writer and Journalist, 1923
Recently, I had the opportunity to engage in a conversation with a young investor regarding dividend growth investing and his investment approach. Sadly, the game has not changed for this young man. Despite all the history and recent events which seem to support our strategy, he is waiting on the sidelines in cash and some precious metal investments to reap the rewards when the market finally crashes. He feels this is his opportunity to build his wealth. Will his emotions get the better of him when the market finally crashes, or will he think the market will go even lower? What will he invest in? Will he try and time the market again if he is successful? What is the probability he will be able to repeat his process in the future? History has not been kind to this young investor’s approach but if there’s ever a time to take a chance and explore new possibilities, it’s when you’re young and have a limited amount of capital to invest.
As dividend growth investors, we find ourselves with fewer uncertainties to address. We understand how to navigate all market conditions. Dividend growth investing’s foundation is firmly planted in the past and the history of how economics and wealth generation were formed. The problem with building a foundation on something new is that rarely has it been tested. Jumping to something new often results in rebuilding your structure often.
In our content, we frequently reference the past, not because we are fixated on it or believe that today’s world is worse off, but because it offers valuable lessons. One of the most powerful concepts we have learned is how dividends work and how they ultimately drive portfolio performance.
On this blog, we want to repeat the successful journey of those great investors who came before us and not those who were once successful ‘coin flippers’ like the ones in our Top Posts story about being lucky or being good. Human nature can sometimes get the best of us, but having a time-tested process helps a lot when our emotions start to take over.
If you have not yet joined as a subscriber of the blog to receive DGI Alerts on the activity and content related to our model portfolio, it’s not too late. Click Here.
Recent News
O Canada, it’s a good place to invest, eh? (Globe & Mail)
https://www.theglobeandmail.com/investing/education/article-o-canada-its-a-good-place-to-invest-eh/
Some good points by the author on investing in Canada. My favorite point is the one on the dividend tax credit. The magic of dividend growth investing continues to impress.
“One reason I love dividends is that they are taxed at much lower rates than regular income. For example, an investor in Ontario with annual income of $100,000 would face a marginal tax rate of just 12.24 per cent on eligible dividends. That compares with a marginal rate of 33.89 per cent on interest or employment income. Thanks to the dividend tax credit (DTC), in some provinces, it’s even possible to have a negative tax rate on dividends if your income is below a certain level (in Ontario and British Columbia, for example, the threshold is $53,359). The DTC is a non-refundable credit, meaning the government won’t send you a cheque for the negative amount, but you can use it to reduce your other taxes owing. Another plus for Canadian investors is the 50-per-cent inclusion rate on capital gains, which means you’ll pay half as much tax when you sell a stock for a profit as you would making the same amount of income in salary or interest.”
An investor’s roadmap for avoiding those dreaded dividend cuts (Globe & Mail)
While investing in high-quality dividend growth stocks can reduce the likelihood of a dividend cut, it’s essential to acknowledge that such events have occurred periodically. To mitigate this risk, it is crucial to stay informed about the companies you invest in and monitor any changes that might deviate from your initial investment thesis. The author raises a valid point regarding yields. Yields serve as signals, and an excessively high yield (above historical norms) should be seen as a warning sign.
To receive breaking news about companies on ‘The List’ follow us on Twitter @MagicPants_DGI.
The List (2023)
Last updated by BM on June 30, 2023
The Magic Pants List contains 27 Canadian dividend growth stocks. ‘The List’ contains Canadian companies that have raised their dividend yearly for at least the last ten years and have a market cap of over a billion dollars. Below is each stock’s symbol, name, current yield, current price, price return year-to-date, current dividend, dividend growth year-to-date and current dividend growth streak. Companies on ‘The List’ are added or subtracted once a year, on January 1. After that, ‘The List’ is set for the next twelve months. Prices and dividends are updated weekly.
| SYMBOL | COMPANY | YLD | PRICE | YTD % | DIV | YTD % | STREAK |
|---|---|---|---|---|---|---|---|
| AQN-N | Algonquin Power & Utilities | 6.1% | $8.26 | 22.7% | $0.51 | -29.0% | 12 |
| ATD-T | Alimentation Couche-Tard Inc. | 0.8% | $67.93 | 13.0% | $0.56 | 19.1% | 13 |
| BCE-T | Bell Canada | 6.3% | $60.40 | 0.3% | $3.82 | 5.0% | 14 |
| BIP-N | Brookfield Infrastructure Partners | 4.4% | $36.50 | 5.2% | $1.44 | 6.3% | 15 |
| CCL-B-T | CCL Industries | 1.6% | $65.12 | 12.2% | $1.06 | 10.4% | 21 |
| CNR-T | Canadian National Railway | 2.0% | $160.42 | -1.5% | $3.16 | 7.8% | 27 |
| CTC-A-T | Canadian Tire | 3.8% | $181.12 | 23.6% | $6.90 | 17.9% | 12 |
| CU-T | Canadian Utilities Limited | 5.2% | $34.31 | -7.1% | $1.79 | 1.0% | 51 |
| DOL-T | Dollarama Inc. | 0.3% | $89.72 | 12.3% | $0.27 | 23.8% | 12 |
| EMA-T | Emera | 5.1% | $54.56 | 3.7% | $2.76 | 3.0% | 16 |
| ENB-T | Enbridge Inc. | 7.2% | $49.24 | -7.7% | $3.55 | 3.2% | 27 |
| ENGH-T | Enghouse Systems Limited | 2.6% | $32.19 | -9.9% | $0.85 | 18.2% | 16 |
| FNV-N | Franco Nevada | 1.0% | $142.60 | 3.2% | $1.36 | 6.3% | 15 |
| FTS-T | Fortis | 4.0% | $57.09 | 3.2% | $2.26 | 4.1% | 49 |
| IFC-T | Intact Financial | 2.2% | $204.54 | 4.5% | $4.40 | 10.0% | 18 |
| L-T | Loblaws | 1.4% | $121.28 | 0.8% | $1.74 | 10.3% | 11 |
| MGA-N | Magna | 3.3% | $56.44 | -1.9% | $1.84 | 2.2% | 13 |
| MRU-T | Metro | 1.6% | $74.82 | -0.9% | $1.21 | 10.0% | 28 |
| RY-T | Royal Bank of Canada | 4.2% | $126.52 | -1.2% | $5.34 | 7.7% | 12 |
| SJ-T | Stella-Jones Inc. | 1.3% | $68.22 | 37.6% | $0.92 | 15.0% | 18 |
| STN-T | Stantec Inc. | 0.9% | $86.49 | 32.4% | $0.77 | 8.5% | 11 |
| TD-T | TD Bank | 4.7% | $82.11 | -6.3% | $3.84 | 7.9% | 12 |
| TFII-N | TFI International | 1.2% | $113.96 | 13.8% | $1.40 | 29.6% | 12 |
| TIH-T | Toromont Industries | 1.5% | $108.83 | 11.4% | $1.68 | 10.5% | 33 |
| TRP-T | TC Energy Corp. | 6.9% | $53.54 | 0.5% | $3.69 | 3.4% | 22 |
| T-T | Telus | 5.5% | $25.78 | -2.1% | $1.43 | 7.3% | 19 |
| WCN-N | Waste Connections | 0.7% | $142.93 | 8.5% | $1.02 | 7.4% | 13 |
| Averages | 3.2% | 6.3% | 8.4% | 19 |
Six Canadian stocks on ‘The List’ declare earnings and dividends in US dollars and are inter-listed on a US exchange in US dollars. The simplest way to display dividend and price metrics for these stocks is to show their US exchange symbols along with their US dividends and price. The stocks I am referring to have a -N at the end of their symbols. You can still buy their Canadian counterparts (-T), but your dividends will be converted into CDN dollars and will fluctuate based on the exchange rate.
Note: When the dividend and share price currency match, the calculation is straightforward. But it’s not so simple when the dividend is declared in one currency, and the share price is quoted in another. Dividing the former by the latter would produce a meaningless result because it’s a case of apples and oranges. To calculate the yield properly, you must express the dividend and share price in the same currency.
Performance of ‘The List’
Feel free to click on this link, ‘The List’ for a sortable version from our website.
Last week, ‘The List’ was up significantly with a YTD price return of +6.3% (capital). Dividend growth remained the same and is now at +8.4% YTD, highlighting growth in income over the past year.
The best performers last week on ‘The List’ were Magna (MGA-N), up +8.48%; TFI International (TFII-T), up +7.87%; and Alimentation Couche-Tard Inc. (ATD-T), up +7.01%.
Canadian Utilities Limited (CU-T) was the worst performer last week, down -0.12%.
Dividend Increases
“The growth of dividend paying ability is of significance in the determination of a stock’s quality, or general safety…”
– Arnold Bernhard (the founder of Value Line)
“As a dividend increase is a positive sign of a company’s financial strength, the safest purchase, after research, is a stock with a recent dividend increase.”
– Tom Connolly (the founder of dividendgrowth.ca)
Last week, no dividend increases from companies on ‘The List’.
Earnings Releases
Benjamin Graham once remarked that earnings are the principal factor driving stock prices.
Each quarter we will provide readers with weekly earnings updates of stocks on ‘The List’ during the calendar earnings season.
The updated earnings calendar can be found here.
Earnings growth and dividend growth tend to go hand in hand, so this information can tell us a lot about the future dividend growth of our quality companies. Monitoring our dividend growers periodically is part of the process, and reading the quarterly earnings releases is a good place to start.
No earnings reports from companies on ‘The List’ this week
Last week, one earnings report from companies on ‘The List’.
Alimentation Couche-Tard Inc. (ATD-T) released its fourth-quarter fiscal 2023 results on Tuesday, June 27, 2023, after markets closed.
“We are pleased to announce an exceptional fiscal year as well as strong fourth quarter results. Even more so, we are proud to share that we have hit our five-year Double Again strategic goal. This is a particularly amazing achievement as during three of those five years we faced historic global challenges including a pandemic, inflation, labor and supply shortages, and war bordering our European markets. While many organizations chart ambitious strategic plans, they can lose momentum along the way. We were able to march forward – growing, innovating, and producing remarkable financial results – because of our award-winning engaged team members and customer-centric culture.”
– Brian Hannasch, President and Chief Executive Officer
Highlights:
Fourth Quarter of fiscal 2023
- Net earnings were $670.7 million, or $0.68 per diluted share for the fourth quarter of fiscal 2023 compared with $477.7 million, or $0.46 per diluted share for the fourth quarter of fiscal 2022. Adjusted net earnings were approximately $698.0 million compared with $573.0 million for the fourth quarter of fiscal 2022. Adjusted diluted net earnings per share were $0.71, representing an increase of 29.1% from $0.55 for the corresponding quarter of last year.
- Total merchandise and service revenues of $4.2 billion, an increase of 11.0%. Same-store merchandise revenues increased by 3.3% in the United States, by 3.0% in Europe and other regions, and by 5.9% in Canada.
- Merchandise and service gross margin increased by 1.0% in the United States to 34.1%, by 2.6% in Europe and other regions to 40.9%, and by 1.7% in Canada to 34.1%, all impacted favorably by a change in product mix.
- Same-store road transportation fuel volumes increased by 0.8% in the United States, by 6.0% in Canada, and decreased by 2.4% in Europe and other regions.
- Road transportation fuel gross margin of 45.34¢ per gallon in the United States, a decrease of 0.78¢ per gallon, and of CA 12.13¢ per liter in Canada, a decrease of CA 1.28¢ per liter. In Europe and other regions, the road transportation fuel margin was US 10.60¢ per liter, an increase of US 3.09¢ per liter, due to the geopolitical context and difficult supply conditions during the comparable quarter. Fuel margins remained healthy throughout the network due to favorable market conditions and the continued work on the optimization of the supply chain.
- Growth of expenses for the fourth quarter of fiscal 2023 was 8.8%, while normalized growth of expenses, when factoring in the estimated impact of the 13th week in the fourth quarter of fiscal 2023, remained lower than the average inflation observed throughout our network of 5.8%.
- On April 21, 2023, we amended our operating credit facility to increase the maximum amount available from $2.5 billion to $3.5 billion. The maximum amount available includes a first tranche of $1.0 billion and a second tranche of $2.5 billion, maturing in April 2026 and April 2028, respectively.
- During the quarter, the Corporation concluded the acquisition of 65 express tunnel car wash sites and 55 company-owned and operated convenience and retail fuel sites in the United States. The Corporation also entered into a binding agreement to acquire 112 company-owned and operated convenience retail and fuel sites in the United States.
- During the quarter, the Corporation agreed to a firm and irrevocable offer to acquire 2,193 sites located in Germany, Belgium, Netherlands, and Luxembourg.
Outlook:
BMO Capital analyst Tamy Chen notes that a highlight from the Couche-Tard earnings call was management’s “more optimistic tone” on M&A following years of subdued acquisition activity due to high purchase multiples across the industry.
“We continue to see runway for growth from both organic initiatives (ongoing roll-out of the fuel rebrand program and improving the fresh food offering) and global M&A opportunities.”
Chen says valuation as still reasonable with the stock trading at 11x forward 12-month EBITDA forecast vs. the historical 10-12x range.
Source: (ATD-T) Q4-2023 Earnings Release
