Last updated by BM on July 17, 2023
Summary
- This is a weekly installment of our MP Market Review series, which provides updates on the financial markets and Canadian dividend growth companies we monitor on ‘The List’.
- Last week, ‘The List’ was up with a YTD price return of +5.6% (capital). Dividend growth remained the same and is now at +8.4% YTD, highlighting growth in income over the past year.
- Last week, no dividend increases from companies on ‘The List’.
- Last week, no earnings reports from companies on ‘The List’.
- No companies on ‘The List’ are due to report earnings this week.
- If you’re interested in creating your own dividend growth income portfolio, consider subscribing to our premium service, which grants you access to the MP Wealth-Builder Model Portfolio (CDN) and exclusive subscriber-only content. Learn More
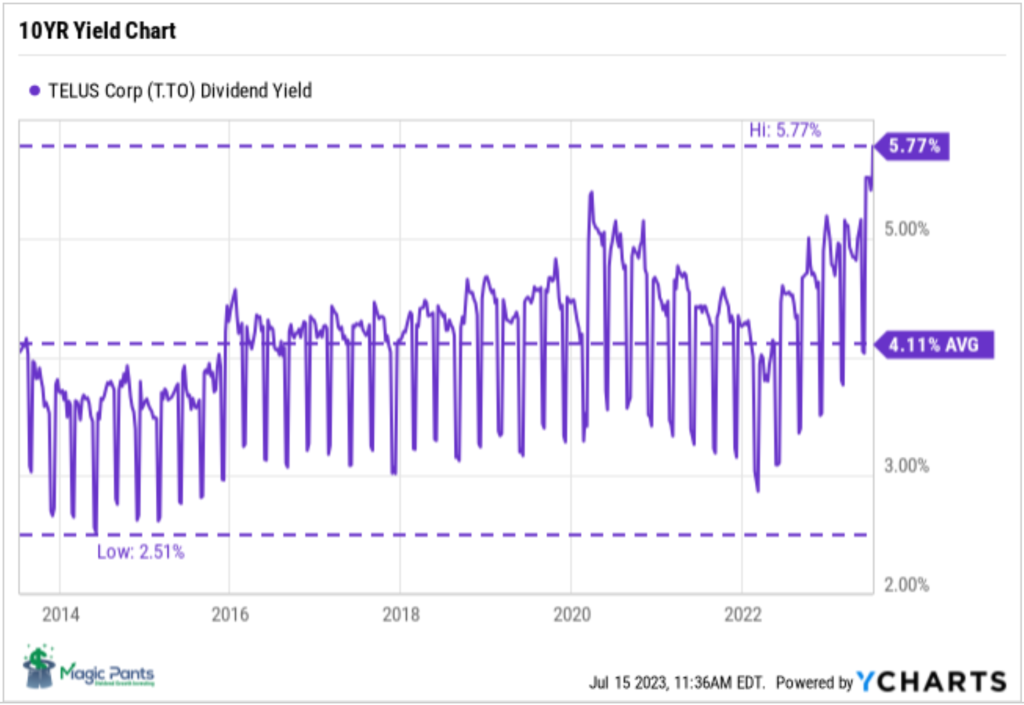
We use ten-year yield charts to track dividend yield patterns for our quality dividend growers. Telus’ yield has now surpassed its ten-year average by a significant margin, pointing to undervaluation.
Investment Quality Trends (IQT) has been successful for almost sixty years using ‘Dividend Yield Theory’ as the cornerstone of their investing methodology in the United States. Buy at undervalue, hold through the rising trend, sell at overvalue, rinse, and repeat. They also use similar qualitative characteristics to what we use to screen for only the highest quality companies. Of all the investing newsletters it tracks, Hulbert Financial Digest lists IQT on its Honour Roll, outperforming the S&P 500 index in all time periods.
Introduction
“You have a pair of pants. In the left pocket, you have $100. You take $1 out of the left pocket and put it in the right pocket. You now have $101. There is no diminution of dollars in your left pocket. That is one magic pair of pants.”
This ‘magic pants’ analogy was from a Seeking Alpha article on dividend investing I read about a decade ago and was one of the catalysts for me to take a closer look at this type of investing and see if it truly was magical.
After conducting additional research, I have shifted towards utilizing a dividend growth investing (DGI) strategy as my primary investment approach. While I maintain portfolios consisting of high-quality dividend growers from both the United States and Canada, I have opted to concentrate on Canadian (CDN) dividend growth companies in this blog. This is due to several reasons, including a smaller pool of DGI companies to track, a lack of coverage for the DGI strategy by the North American investment media, and a tendency for those who do cover DGI to narrowly focus on only a handful of sectors (Energy and Financials).
While ‘The List’ is not a portfolio in itself, it serves as an excellent initial reference for individuals seeking to diversify their investments and attain higher returns in the Canadian stock market. Through our blog, we provide weekly updates on ‘The List’ and offer valuable perspectives and real-life examples of the dividend growth investing strategy in practice. This helps readers gain a deeper understanding of how to implement and benefit from this investment approach.
DGI Thoughts
“A stock is not a purchase until it’s yield reaches the buy range established by the stock’s own unique dividend yield history.”
– Anthony Spare, Relative Dividend Yield
‘Dividend Yield Theory’ is simple and intuitive. It basically says that for quality dividend growth stocks, meaning those with stable business models that don’t significantly change over time, dividend yields tend to revert to the mean. Here is a table of the top eleven stocks on ‘The List’ that currently appear undervalued according to the dividend yield theory of valuation.
To borrow a term from Investment Quality Trends, these would be what we would use to form our ‘Timely Ten’ (Eleven) dividend growth stocks.
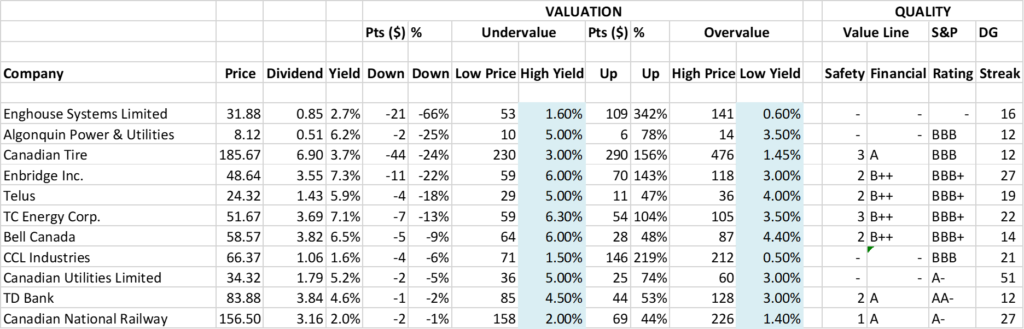
Now filter out the lower quality companies that may have one or two quality indicator limitations.
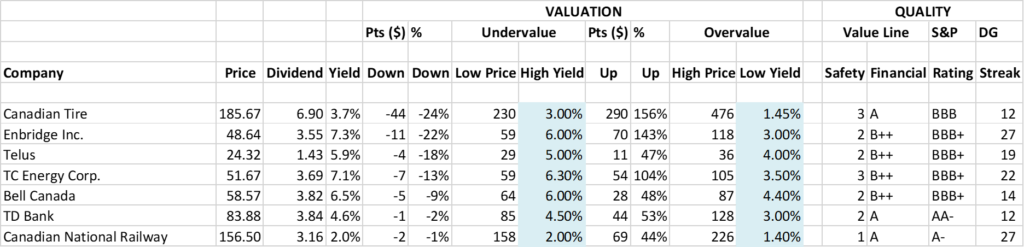
To provide an additional level of safety, the table can be reduced further to just five ‘Core’ category companies.

A dividend growth investor would then need to determine if the margin of safety built into the company’s yield, using this valuation methodology, is sufficient to initiate a position in today’s market.
If you have not yet joined as a paid subscriber of the blog to receive DGI Alerts on the activity and content related to our model portfolio, it’s not too late. Click Here.
Recent News
Lower interest rates will bring a ‘wildebeest migration’ of investors into beaten down dividend stocks (Globe & Mail)
“We are living in bountiful times for investors who prioritize income. For the safety-first crowd, there are guaranteed investment certificates (GICs) and federal government treasury bills (T-bills) with yields in the 5-per-cent zone. Climb a rung on the risk ladder and you can find slightly higher yields from preferred shares and corporate bonds. Step up another couple of rungs and you have out of favour blue-chip dividend growth stocks.”
The author cautions investors about yields that get too high and points out the example of Algonquin Power and what happened to its dividend earlier this year. Paying attention to yield and investing in higher quality names is the key to success. In addition, the author sees a big jump in quality dividend growth stocks once interest rates stabilize and head lower. We agree!
Telus International shares slump after company slashes growth guidance (Globe & Mail)
Telus International slashed its growth guidance on Friday and the shares plummeted. Parent company, Telus, also saw its share price affected by the news. Purchasing a quality company like Telus at a ~6% yield was hard to resist for this dividend growth investor, so we bought more for our MP Wealth-Builder Model Portfolio (CDN) later in the day. From our experience, an above average yield such as Telus’ currently tends to act as a floor on the stock price as investors jump in to receive the growing income. The stock price eventually recovers and the yield reverts to its mean. We will be monitoring this quality dividend grower closely.
To receive breaking news about companies on ‘The List’ follow us on Twitter @MagicPants_DGI.
The List (2023)
Last updated by BM on July 14, 2023
The Magic Pants List contains 27 Canadian dividend growth stocks. ‘The List’ contains Canadian companies that have raised their dividend yearly for at least the last ten years and have a market cap of over a billion dollars. Below is each stock’s symbol, name, current yield, current price, price return year-to-date, current dividend, dividend growth year-to-date and current dividend growth streak. Companies on ‘The List’ are added or subtracted once a year, on January 1. After that, ‘The List’ is set for the next twelve months. Prices and dividends are updated weekly.
| SYMBOL | COMPANY | YLD | PRICE | YTD % | DIV | YTD % | STREAK |
|---|---|---|---|---|---|---|---|
| AQN-N | Algonquin Power & Utilities | 6.2% | $8.12 | 20.7% | $0.51 | -29.0% | 12 |
| ATD-T | Alimentation Couche-Tard Inc. | 0.8% | $66.88 | 11.2% | $0.56 | 19.1% | 13 |
| BCE-T | Bell Canada | 6.5% | $58.57 | -2.8% | $3.82 | 5.0% | 14 |
| BIP-N | Brookfield Infrastructure Partners | 4.4% | $36.19 | 5.2% | $1.44 | 6.3% | 15 |
| CCL-B-T | CCL Industries | 1.6% | $66.37 | 14.3% | $1.06 | 10.4% | 21 |
| CNR-T | Canadian National Railway | 2.0% | $156.50 | -3.9% | $3.16 | 7.8% | 27 |
| CTC-A-T | Canadian Tire | 3.7% | $185.67 | 26.7% | $6.90 | 17.9% | 12 |
| CU-T | Canadian Utilities Limited | 5.2% | $34.32 | -7.1% | $1.79 | 1.0% | 51 |
| DOL-T | Dollarama Inc. | 0.3% | $88.43 | 10.7% | $0.27 | 23.8% | 12 |
| EMA-T | Emera | 5.1% | $54.34 | 3.3% | $2.76 | 3.0% | 16 |
| ENB-T | Enbridge Inc. | 7.3% | $48.64 | -8.8% | $3.55 | 3.2% | 27 |
| ENGH-T | Enghouse Systems Limited | 2.7% | $31.88 | -10.7% | $0.85 | 18.2% | 16 |
| FNV-N | Franco Nevada | 0.9% | $145.93 | 5.6% | $1.36 | 6.3% | 15 |
| FTS-T | Fortis | 3.9% | $57.34 | 3.6% | $2.26 | 4.1% | 49 |
| IFC-T | Intact Financial | 2.2% | $196.16 | 0.2% | $4.40 | 10.0% | 18 |
| L-T | Loblaws | 1.5% | $119.70 | -0.5% | $1.74 | 10.3% | 11 |
| MGA-N | Magna | 3.1% | $59.11 | 2.8% | $1.84 | 2.2% | 13 |
| MRU-T | Metro | 1.6% | $74.14 | -1.8% | $1.21 | 10.0% | 28 |
| RY-T | Royal Bank of Canada | 4.2% | $128.12 | 0.1% | $5.34 | 7.7% | 12 |
| SJ-T | Stella-Jones Inc. | 1.4% | $66.15 | 33.4% | $0.92 | 15.0% | 18 |
| STN-T | Stantec Inc. | 0.9% | $89.69 | 37.3% | $0.77 | 8.5% | 11 |
| TD-T | TD Bank | 4.6% | $83.88 | -4.3% | $3.84 | 7.9% | 12 |
| TFII-N | TFI International | 1.3% | $109.40 | 9.3% | $1.40 | 29.6% | 12 |
| TIH-T | Toromont Industries | 1.6% | $108.35 | 10.9% | $1.68 | 10.5% | 33 |
| TRP-T | TC Energy Corp. | 7.1% | $51.67 | -3.1% | $3.69 | 3.4% | 22 |
| T-T | Telus | 5.9% | $24.32 | -7.6% | $1.43 | 7.3% | 19 |
| WCN-N | Waste Connections | 0.7% | $141.42 | 7.4% | $1.02 | 7.4% | 13 |
| Averages | 3.2% | 5.6% | 8.4% | 19 |
Six Canadian stocks on ‘The List’ declare earnings and dividends in US dollars and are inter-listed on a US exchange in US dollars. The simplest way to display dividend and price metrics for these stocks is to show their US exchange symbols along with their US dividends and price. The stocks I am referring to have a -N at the end of their symbols. You can still buy their Canadian counterparts (-T), but your dividends will be converted into CDN dollars and will fluctuate based on the exchange rate.
Note: When the dividend and share price currency match, the calculation is straightforward. But it’s not so simple when the dividend is declared in one currency, and the share price is quoted in another. Dividing the former by the latter would produce a meaningless result because it’s a case of apples and oranges. To calculate the yield properly, you must express the dividend and share price in the same currency.
Performance of ‘The List’
Feel free to click on this link, ‘The List’ for a sortable version from our website.
Last week, ‘The List’ was up with a YTD price return of +5.6% (capital). Dividend growth remained the same and is now at +8.4% YTD, highlighting growth in income over the past year.
The best performers last week on ‘The List’ were Franco Nevada (FNV-N), up +5.19%; TD Bank (TD-T), up +3.71%; and Stantec Inc. (STN-T), up +3.26%.
Telus (T-T) was the worst performer last week, down -5.59%.
Dividend Increases
“The growth of dividend paying ability is of significance in the determination of a stock’s quality, or general safety…”
– Arnold Bernhard (the founder of Value Line)
“As a dividend increase is a positive sign of a company’s financial strength, the safest purchase, after research, is a stock with a recent dividend increase.”
– Tom Connolly (the founder of dividendgrowth.ca)
Last week, no dividend increases from companies on ‘The List’.
Earnings Releases
Benjamin Graham once remarked that earnings are the principal factor driving stock prices.
Each quarter we will provide readers with weekly earnings updates of stocks on ‘The List’ during the calendar earnings season.
The updated earnings calendar can be found here.
Earnings growth and dividend growth tend to go hand in hand, so this information can tell us a lot about the future dividend growth of our quality companies. Monitoring our dividend growers periodically is part of the process, and reading the quarterly earnings releases is a good place to start.
No earnings reports from companies on ‘The List’ this week
Last week, no earnings reports from companies on ‘The List’.
