Last updated by BM on January 09, 2023
Summary
- This article is part of our weekly series (MP Market Review) highlighting the performance and activity from the previous week related to the financial markets and Canadian dividend growth companies we follow on ‘The List’.
- ‘The List’ ends 2022 with a negative -6.0% price return (capital) and positive +10.6% dividend growth (income). See summary below. We started a new list last week for 2023. We decided to keep ‘The List’ the same for 2023 as all companies increased their dividend again last year.
- Last week, ‘The List’ began the year with a positive +2.1% YTD price return (capital). The dividend growth of ‘The List’ is off to a fast start at +4.6% YTD, demonstrating the rise in income over the last year.
- Last week, there were no dividend increases from companies on ‘The List’.
- Last week, there were no earnings reports from companies on ‘The List’.
- No companies on ‘The List’ are due to report earnings this week.
- Are you looking to build an income portfolio of your own? When you become a premium subscriber, you get exclusive access to the MP Wealth-Builder Model Portfolio (CDN) and subscriber-only content. Start building real wealth today! Learn More
“Learn to eventually and mentally manage price declines as your dividend grows.”
Happy New Year! It is that time of year when we reflect on our dividend growth strategy and how it fared in the worst stock market decline since 2008.
We can only imagine the amount of wealth destruction that took place for a lot of people last year. Fortunately, we discovered dividend growth investing after the last major market decline in 2008 and vowed we would not let that happen again. This 2022 summary of ‘The List’ will help demonstrate that even the most passive dividend growth investing strategy can safeguard your capital and provide you with a growing income stream.
At market close on the first trading day of the new year, we publish ‘The List’ of Canadian dividend growth stocks we will follow that year. The companies selected are from various industries, usually no more than four from one industry. We stay away from REITs and pure-play energy companies due to their cyclical nature. Next, we look for ten years of consecutive dividend growth and over one billion market cap. We hold the stocks for the entire year with weekly updates on their performance and insights throughout the year into how the company aligns, or not, as a candidate for your dividend growth portfolio.
Here is a copy of ‘The List’ and its year-to-date (YTD) performance on the last trading day of December 2022.
In 2022, ‘The List’ had an average price return of -6.0% and an average dividend growth rate of +10.6%. These metrics assume investment in an equal amount of shares in all the companies on ‘The List’ at the close of the first trading day of 2022.
To put these metrics in perspective, let’s look at how a few of the most popular market indexes did last year.
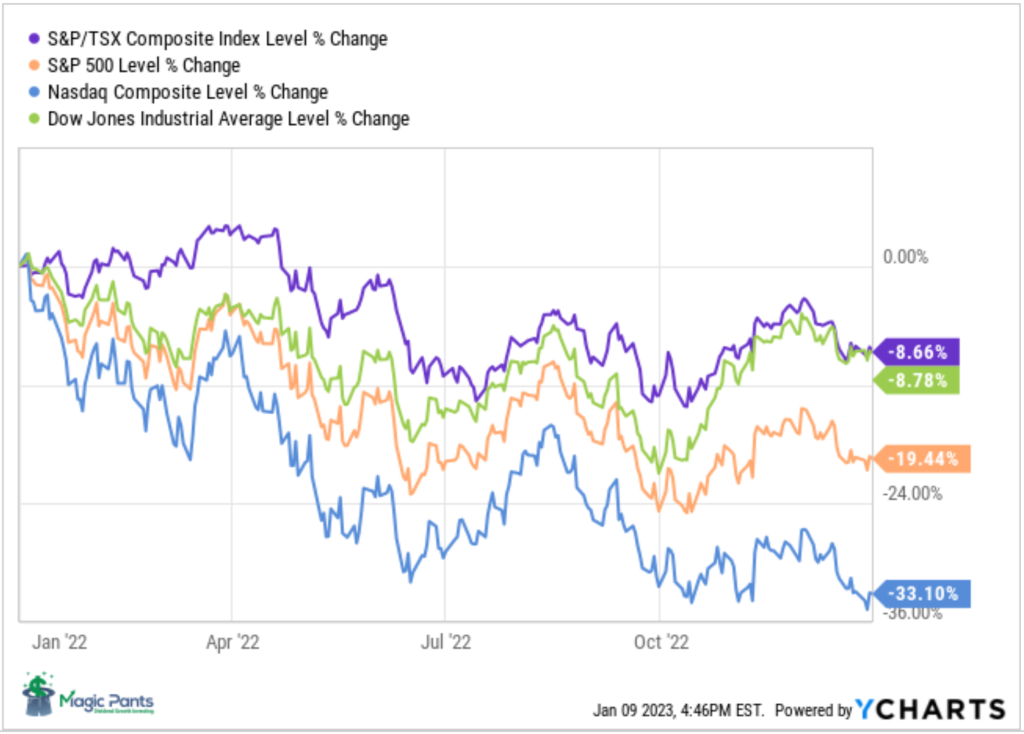
As you can see, there were negative price returns across the board from all the major North American indexes. ‘The List’ of Canadian dividend growth stocks we follow did a better job protecting our capital than all four main indexes. Not all indexes contain dividend growth stocks, so we could not compare the income generated. We can, however, safely assume that ‘The List,’ with its generous starting yield last year of 2.7% and dividend growth of +10.6%, was a clear winner on income production as well.
So how did a pseudo dividend growth portfolio like the ‘The List’ protect you from a year like 2022? By its nature, dividend growth investing forces investors into higher-quality names. After all, for a company’s management to commit to a dividend payout policy, the company needs to generate cash to pay the dividends. As it turns out, high-quality companies are more likely to be profitable and generate cash to pay dividends consistently.
Although it is early, our Magic Pants Wealth-Builder Model Portfolio (CDN) did even better, ending 2022 in positive territory for both price and income returns after its inception in May 2022. This portfolio lets paid subscribers ‘look over our shoulder’ as we build a powerful dividend growth portfolio from scratch. Learn More
As dividend growth investors, we have come to realize that we can’t control economic cycles (markets), but we can control our income. Knowing that, we don’t focus as much on the value of our portfolios in the short-term, only on how much our income is growing. In time, a rising dividend income stream will eventually lead to rising stock prices.
Is 2023 the year you finally learn to mentally manage price declines as your dividend grows?
Note: The companies on ‘The List’ are only a starting point when you decide to build your portfolio. Buying all your stocks in one day, regardless of valuation, is not the approach we discuss in the blog. To learn more about our process and how we build powerful dividend growth portfolios that have easily outperformed all Canadian Dividend ETFs and Mutual Funds for over a decade, click here.
Performance of ‘The List’
At the end of the post is a snapshot of ‘The List’ from last Friday’s close. Feel free to click on the ‘The List’ menu item above for a sortable version.
Last week, ‘The List’ began the year with a positive +2.1% YTD price return (capital). The dividend growth of ‘The List’ is off to a fast start at +4.6% YTD, demonstrating the rise in income over the last year.
The best performers last week on ‘The List’ were Algonquin Power & Utilities (AQN-N), up +10.28%; Magna (MGA-N), up +9.65%; and Canadian Tire (CTC-A-T), up +6.84%.
TD Bank (TD-T) was the worst performer last week, down -1.48%.
Recent News
Why is Algonquin Power rallying? Any news on the dividend is good news (Globe & Mail)
Hands down the worst performer on ‘The List’ last year, Algonquin Power (AQN-N) now yields close to 10%. Investors will know more next week about how the company plans to deal with its dividend. Pay close attention to this one as dividend reductions or cuts are normally not met with enthusiasm by investors.
(AQN-N) got itself in trouble last year when rising rates affected its borrowing costs.
Dividend Increases
Last week, there were no dividend increases from companies on ‘The List’.
Earnings Releases
No companies on ‘The List’ are due to report earnings this week.
Last week, there were no earnings reports from companies on ‘The List’.
Below is a snapshot of ‘The List’ from last Friday’s close. For a sortable version of ‘The List’, please click on The List menu item.
‘The List’ is not intended to be a portfolio others replicate. Rather, its purpose is to provide investment ideas and a real-time illustration of dividend growth investing in action. It is not a ‘Buy List’ nor reflects the composition or returns of our Magic Pants Wealth-Builder (CDN) Portfolios. It is only a starting point for our analysis and discussion of dividend growth investing concepts.
The List (2023)
Last updated by BM on January 06, 2023
*Note: The following graph is wide, you can scroll to the right on your device to see more of the data.
| SYMBOL | COMPANY | YLD | PRICE | YTD % | DIV | YTD % | STREAK |
|---|---|---|---|---|---|---|---|
| AQN-N | Algonquin Power & Utilities | 10.1% | $7.19 | 6.8% | $0.72 | 2.9% | 12 |
| ATD-T | Alimentation Couche-Tard Inc. | 0.9% | $61.87 | 2.9% | $0.56 | 19.1% | 13 |
| BCE-T | Bell Canada | 6.0% | $61.62 | 2.3% | $3.68 | 1.1% | 14 |
| BIP-N | Brookfield Infrastructure Partners | 4.4% | $32.95 | 5.2% | $1.44 | 0.0% | 15 |
| CCL-B-T | CCL Industries | 1.6% | $59.22 | 2.0% | $0.96 | 0.0% | 21 |
| CNR-T | Canadian National Railway | 1.8% | $164.44 | 1.0% | $2.93 | 0.0% | 27 |
| CTC-A-T | Canadian Tire | 4.6% | $151.18 | 3.1% | $6.90 | 17.9% | 12 |
| CU-T | Canadian Utilities Limited | 4.8% | $36.98 | 0.1% | $1.78 | 0.0% | 51 |
| DOL-T | Dollarama Inc. | 0.3% | $82.92 | 3.8% | $0.22 | 2.3% | 12 |
| EMA-T | Emera | 5.3% | $52.32 | -0.6% | $2.76 | 3.0% | 16 |
| ENB-T | Enbridge Inc. | 6.5% | $54.46 | 2.1% | $3.55 | 3.2% | 27 |
| ENGH-T | Enghouse Systems Limited | 2.0% | $37.01 | 3.6% | $0.74 | 3.5% | 16 |
| FNV-N | Franco Nevada | 0.9% | $139.80 | 1.2% | $1.28 | 0.0% | 15 |
| FTS-T | Fortis | 4.1% | $55.16 | -0.3% | $2.26 | 4.1% | 49 |
| IFC-T | Intact Financial | 2.0% | $199.81 | 2.1% | $4.00 | 0.0% | 18 |
| L-T | Loblaws | 1.3% | $120.21 | -0.1% | $1.62 | 5.2% | 11 |
| MGA-N | Magna | 2.9% | $61.60 | 7.1% | $1.80 | 0.0% | 13 |
| MRU-T | Metro | 1.5% | $74.81 | -0.9% | $1.10 | 0.0% | 28 |
| RY-T | Royal Bank of Canada | 4.0% | $130.43 | 1.9% | $5.28 | 6.5% | 12 |
| SJ-T | Stella-Jones Inc. | 1.6% | $50.17 | 1.2% | $0.80 | 0.0% | 18 |
| STN-T | Stantec Inc. | 1.1% | $66.36 | 1.6% | $0.72 | 2.1% | 11 |
| TD-T | TD Bank | 4.4% | $86.37 | -1.5% | $3.84 | 7.9% | 12 |
| TFII-N | TFI International | 1.3% | $103.73 | 3.6% | $1.40 | 29.6% | 12 |
| TIH-T | Toromont Industries | 1.5% | $102.14 | 4.5% | $1.56 | 2.6% | 33 |
| TRP-T | TC Energy Corp. | 6.6% | $54.24 | 1.8% | $3.60 | 0.8% | 22 |
| T-T | Telus | 5.2% | $27.02 | 2.7% | $1.40 | 5.4% | 19 |
| WCN-N | Waste Connections | 0.8% | $132.81 | 0.8% | $1.02 | 7.9% | 13 |
| Averages | 3.2% | 2.1% | 4.6% | 19 |
