“You have a pair of pants. In the left pocket, you have $100. You take $1 out of the left pocket and put it in the right pocket. You now have $101. There is no diminution of dollars in your left pocket. That is one magic pair of pants.”

Category: MP Market Reviews

MP Market Review – October 3, 2025

Last updated by BM on October 7, 2025

Summary


Welcome to this week’s MP Market Review – your go-to source for insights and updates on the Canadian dividend growth companies we track on The List! While we’ve expanded our watchlists to include U.S. companies The List-USA, our Canadian lineup remains the cornerstone of our coaching approach.

Don’t miss out on exclusive newsletters and premium content that will help you sharpen your investing strategy. Explore it all at magicpants.substack.com.

Your journey to dividend growth mastery starts here – let’s dive in!

  • Last week, dividend growth of The List stayed the same with an average return of +6.9% YTD (income).
  • Last week, the price of The List was up from the previous week with an average return of +11.9% YTD (capital).
  • Last week, there were no dividend announcements from companies on The List.
  • Last week, there were no earnings reports from companies on The List.
  • This week, no companies from The List will report on earnings.

DGI Clipboard


“Success in investing has two parts: finding edge and fully taking advantage of it through proper position sizing.

– Michael J. Mauboussin

How to Turn a Good DGI Watchlist Into A Great DGI Portfolio

Intro


YTD Performance: The List +11.9% | Model Portfolio (CDN) +20.0%

Each January, we assemble a curated watchlist of Canadian and American dividend growth companies that we monitor throughout the year. These lists help coach our process, guide new investments, and serve as the foundation for our model portfolios.

We rarely invest outside these lists, but how we weight our investments once they enter the portfolio is what creates the edge.

The List: A Quality Benchmark 

Think of The List as an equal-weighted exchange-traded fund (ETF) made up of Canada’s best dividend growth companies. The performance you see, like this year’s +11.9% gain, assumes equal investment in every stock on January 1.

That is impressive on its own, but our Wealth-Builder Model Portfolio (CDN) has delivered nearly double the return.

The Secret: Position Sizing with Purpose

Before any company from the watchlist earns a place in our model portfolio, it must pass two final hurdles:

  1. Quality – look for only the best of the best when we invest. Stocks must possess as many of our quality indicators as possible.
  2. Valuation – look to buy a quality company that is sensibly priced based on historical fundamentals and valuation metrics.

Once in the portfolio, we apply a position sizing framework. Core holdings, our highest-quality companies, receive larger allocations. Non-core holdings take smaller weights.

This disciplined approach tilts the odds in our favor and amplifies the performance of our best ideas.

As an example: Had we weighted each company equally, our return of our model portfolio this year would have almost mirrored The List at +12.1%. By sizing positions in line with our current portfolio position sizes, the Wealth-Builder Model Portfolio (CDN) would stand at +20.0% YTD.
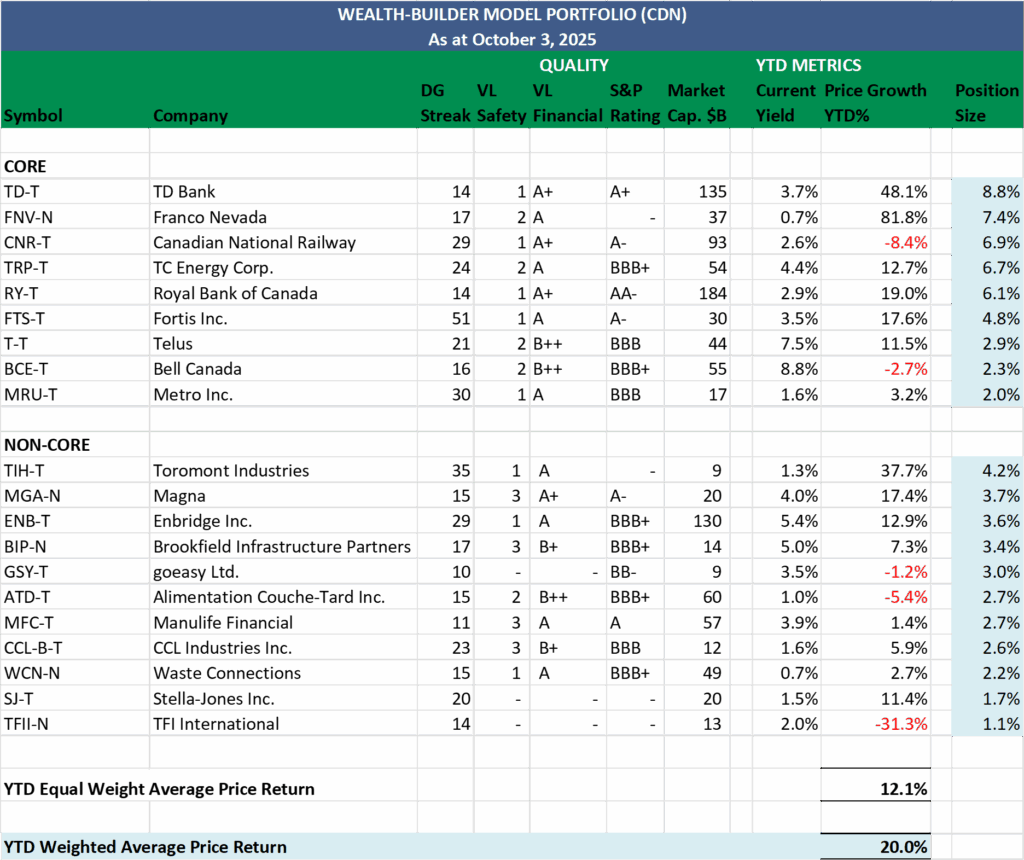
Source: Magic Pants Wealth-Builder Model Portfolio (CDN) as of October 3, 2025

Why It Matters

Position sizing is the quiet advantage few investors talk about. It magnifies the contribution of your best businesses while minimizing the drag from the rest. Over time, this simple principle compounds into a meaningful performance gap.

Takeaway


Our watchlists are a valuable resource for anyone looking to build or refine a dividend growth investing (DGI) portfolio. They provide a strong foundation of quality, but the real edge comes from disciplined position sizing and valuation-based buying.

Understanding the process is one thing; executing it is another. For investors who want to follow along, receive real-time updates, and access our full model portfolio strategy, become a paid subscriber and see how our edge compounds over time.

Become a paid partner, and I’ll show you exactly how I do it. With real money. In real stocks. In addition, gain full access to this post and exclusive, subscriber-only content. We do the work; you stay in control. Subscribe today and take your dividend growth investing to the next level!

DGI Scorecard

 
The List (2025)


The Magic Pants 2025 list includes 29 Canadian dividend growth stocks. Here are the criteria to be considered a candidate on ‘The List’:

  1. Dividend growth streak: 10 years or more.
  2. Market cap: Minimum one billion dollars.
  3. Diversification: Limit of five companies per sector, preferably two per industry.
  4. Cyclicality: Exclude REITs and pure-play energy companies due to high cyclicality.

Based on these criteria, companies are added or removed from ‘The List’ annually on January 1. Prices and dividends are updated weekly.

‘The List’ is not a portfolio but a coaching tool that helps us think about ideas and risk manage our model portfolio. We own some but not all the companies on ‘The List’. In other words, we might want to buy these companies when valuation looks attractive.

Our newsletter provides readers with a comprehensive insight into the implementation and advantages of our Canadian dividend growth investing strategy. This evidence-based, unbiased approach empowers DIY investors to outperform both actively managed dividend funds and passively managed indexes and dividend ETFs over longer-term horizons.

Performance of ‘The List’


Last week, dividend growth stayed the same, with an average return of +6.9% YTD (income).

The price of ‘The List’ was up from the previous week, with an average YTD return of +11.9% (capital).

Even though prices may fluctuate, the dependable growth in our income does not. Stay the course. You will be happy you did.

Last week’s best performers on ‘The List’ were Stella-Jones Inc. (SJ-T), up +6.18%.; Magna (MGA-N), up +5.11%; and Stantec Inc. (STN-T) up +4.22%.

goeasy Ltd. (GSY-T) was the worst performer last week, down -5.11%.

SYMBOL COMPANY YLD PRICE YTD % DIV YTD % STREAK
ATD-T Alimentation Couche-Tard Inc. 1.0% $74.79 -5.39% $0.78 8.3% 15
BCE-T Bell Canada 8.8% $32.60 -2.74% $2.87 -28.1% 16
BIP-N Brookfield Infrastructure Partners 5.0% $34.17 7.25% $1.72 6.2% 17
CCL-B-T CCL Industries Inc. 1.6% $77.94 5.87% $1.28 10.3% 23
CNR-T Canadian National Railway 2.6% $134.49 -8.37% $3.55 5.0% 29
CTC-A-T Canadian Tire 4.2% $169.60 10.34% $7.10 1.4% 14
CU-T Canadian Utilities Limited 4.7% $38.87 11.76% $1.83 1.0% 53
DOL-T Dollarama Inc. 0.2% $183.58 30.94% $0.41 18.1% 14
EMA-T Emera 4.4% $66.80 24.79% $2.92 1.2% 18
ENB-T Enbridge Inc. 5.4% $69.88 12.95% $3.77 3.0% 29
ENGH-T Enghouse Systems Limited 5.5% $21.13 -21.91% $1.16 16.0% 18
FNV-N Franco Nevada 0.7% $220.18 81.77% $1.52 5.6% 17
FTS-T Fortis Inc. 3.5% $70.14 17.65% $2.46 3.1% 51
GSY-T goeasy Ltd. 3.5% $165.12 -1.22% $5.84 24.8% 10
IFC-T Intact Financial 2.0% $269.11 2.33% $5.32 9.9% 20
L-T Loblaw Companies Limited 1.0% $54.89 15.41% $0.55 15.2% 13
MFC-T Manulife Financial 3.9% $44.57 1.43% $1.76 10.0% 11
MGA-N Magna 4.0% $49.00 17.39% $1.94 2.1% 15
MRU-T Metro Inc. 1.6% $93.07 3.22% $1.48 10.4% 30
RY-T Royal Bank of Canada 2.9% $205.06 19.03% $6.04 7.9% 14
SJ-T Stella-Jones Inc. 1.5% $81.28 11.36% $1.24 10.7% 20
STN-T Stantec Inc. 0.6% $154.20 36.33% $0.89 7.3% 13
T-T Telus 7.5% $21.89 11.51% $1.64 7.0% 21
TD-T TD Bank 3.7% $113.26 48.05% $4.20 2.9% 14
TFII-N TFI International 2.0% $91.16 -31.26% $1.80 12.5% 14
TIH-T Toromont Industries 1.3% $155.72 37.68% $2.08 8.3% 35
TRI-Q Thomson Reuters 1.6% $152.98 -5.79% $2.38 10.2% 31
TRP-T TC Energy Corp. 4.4% $76.89 12.71% $3.40 3.3% 24
WCN-N Waste Connections 0.7% $174.42 2.65% $1.26 7.7% 15
Averages 3.1% 11.9% 6.9% 21

Note: Stocks ending in “-N or -Q” declare earnings and dividends in US dollars. To achieve currency consistency between dividends and share price for these stocks, we have shown dividends in US dollars and share price in US dollars (these stocks are listed on a US exchange). The dividends for their Canadian counterparts (-T) would be converted into CDN dollars and would fluctuate with the exchange rate.

PAID subscribers enjoy full access to our enhanced weekly newsletter, premium content, and easy-to-follow trade alerts so they can build DGI portfolios alongside ours. This service provides the resources to develop your DGI business plan confidently. We do the work; you stay in control!

It truly is the subscription that pays dividends!

The greatest investment you can make is in yourself. Are you ready to take that step? 

For more articles and the full newsletter, check us out on magicpants.substack.com.

MP Market Review – September 26, 2025

Last updated by BM on September 30, 2025

Summary


Welcome to this week’s MP Market Review – your go-to source for insights and updates on the Canadian dividend growth companies we track on The List! While we’ve expanded our watchlists to include U.S. companies The List-USA, our Canadian lineup remains the cornerstone of our coaching approach.

Don’t miss out on exclusive newsletters and premium content that will help you sharpen your investing strategy. Explore it all at magicpants.substack.com.

Your journey to dividend growth mastery starts here – let’s dive in!

  • Last week, dividend growth of The List stayed the same with an average return of +6.9% YTD (income).
  • Last week, the price of The List was down from the previous week with an average return of +10.1% YTD (capital).
  • Last week, there was one dividend announcement from a company on The List.
  • Last week, there were no earnings reports from companies on The List.
  • This week, no companies from The List will report on earnings.

DGI Clipboard


“Setting up and maintaining a simple investing strategy is mechanically easy but psychologically hard. My hope is that by cutting through the inevitable noise that goes along with it, you’ll be a little more disciplined and a lot more successful, which is compounding at its best.”

Tom Bradley, co-founder of Steadyhand Investment Management

Old-Fashioned Lessons That Still Work
Intro


I’ve lost count of how many times I’ve been called old-fashioned for the principles I live by. Whether in business, parenting, or investing, I’ve found it pays to take the best lessons from those who came before us and use them as a foundation for building a productive and successful life.

The pullback in goeasy Ltd. shares this week was a reminder of why a data-driven, historically tested process is so important and why sticking to it matters. Paid subscribers who received my DGI Alert on goeasy saw that I topped up my position after the stock dropped 15%. I don’t know for certain whether the accusations of accounting irregularities have merit, but I feel confident we won’t be talking about them one or two years from now.

Buying quality companies at sensible prices may sound simple, but it’s never easy when the stock price is falling. The discipline to lean in during moments of fear is one of the most valuable lessons I learned early on, and it remains a cornerstone of how dividend growth investing outperforms over time.

Take Toronto-Dominion Bank as an example. A couple of years ago, I wrote an article titled Toronto-Dominion Bank: Time To Supercharge Your Dividend Growth Investing (DGI) Returns when TD was trading near $77. Last Friday it closed above $110. On top of that, our dividend return (growth yield) has already reached 5.4% in just two years, and the compounding is only getting started. Good luck finding that kind of return in on a bond or GIC today.

The investment thesis behind our TD Bank purchase was straightforward: look past the noise surrounding the U.S. banking sector, including credit delinquency fears and uncertainty around the First Horizon acquisition, and focus on TD as a high-quality business trading at a sensible price. More negative headlines followed, but as always, the cream rose to the top.

The Core Lesson

Market narratives are often just noise. Your greatest challenge as an investor is to stay steady when others are unsettled. To keep doing what’s right for you even as the crowd moves the other way. To trust your plan most when you’re tempted to abandon it.

Takeaway


With markets sitting near all-time highs, it’s comforting to know our approach isn’t built on headlines or short-term trends. It’s grounded in timeless principles, tested through history, and shaped by the wisdom of the investing giants who came before us. That foundation, not the noise, guides us forward.

Become a paid partner, and I’ll show you exactly how I do it. With real money. In real stocks. In addition, gain full access to this post and exclusive, subscriber-only content. We do the work; you stay in control. Subscribe today and take your dividend growth investing to the next level!

DGI Scorecard

 
The List (2025)


The Magic Pants 2025 list includes 29 Canadian dividend growth stocks. Here are the criteria to be considered a candidate on ‘The List’:

  1. Dividend growth streak: 10 years or more.
  2. Market cap: Minimum one billion dollars.
  3. Diversification: Limit of five companies per sector, preferably two per industry.
  4. Cyclicality: Exclude REITs and pure-play energy companies due to high cyclicality.

Based on these criteria, companies are added or removed from ‘The List’ annually on January 1. Prices and dividends are updated weekly.

‘The List’ is not a portfolio but a coaching tool that helps us think about ideas and risk manage our model portfolio. We own some but not all the companies on ‘The List’. In other words, we might want to buy these companies when valuation looks attractive.

Our newsletter provides readers with a comprehensive insight into the implementation and advantages of our Canadian dividend growth investing strategy. This evidence-based, unbiased approach empowers DIY investors to outperform both actively managed dividend funds and passively managed indexes and dividend ETFs over longer-term horizons.

Performance of ‘The List’


Last week, dividend growth stayed the same, with an average return of +6.9% YTD (income).

The price of ‘The List’ was down from the previous week, with an average YTD return of +10.1% (capital).

Even though prices may fluctuate, the dependable growth in our income does not. Stay the course. You will be happy you did.

Last week’s best performers on ‘The List’ were Brookfield Infrastructure Partners (BIP-N), up +7.15%.; Emera (EMA-T), up +3.20%; and Canadian Utilities Limited (CU-T) up +2.95%.

goeasy Ltd. (GSY-T) was the worst performer last week, down -14.91%.

SYMBOL COMPANY YLD PRICE YTD % DIV YTD % STREAK
ATD-T Alimentation Couche-Tard Inc. 1.1% $72.64 -8.11% $0.78 8.3% 15
BCE-T Bell Canada 8.9% $32.21 -3.91% $2.87 -28.1% 16
BIP-N Brookfield Infrastructure Partners 5.2% $33.12 3.95% $1.72 6.2% 17
CCL-B-T CCL Industries Inc. 1.6% $79.68 8.23% $1.28 10.3% 23
CNR-T Canadian National Railway 2.7% $129.38 -11.85% $3.55 5.0% 29
CTC-A-T Canadian Tire 4.3% $165.10 7.41% $7.10 1.4% 14
CU-T Canadian Utilities Limited 4.8% $38.42 10.47% $1.83 1.0% 53
DOL-T Dollarama Inc. 0.2% $184.60 31.67% $0.41 18.1% 14
EMA-T Emera 4.4% $65.72 22.77% $2.92 1.2% 18
ENB-T Enbridge Inc. 5.5% $69.09 11.67% $3.77 3.0% 29
ENGH-T Enghouse Systems Limited 5.6% $20.74 -23.36% $1.16 16.0% 18
FNV-N Franco Nevada 0.7% $217.53 79.58% $1.52 5.6% 17
FTS-T Fortis Inc. 3.6% $69.19 16.05% $2.46 3.1% 51
GSY-T goeasy Ltd. 3.4% $174.01 4.10% $5.84 24.8% 10
IFC-T Intact Financial 2.0% $263.60 0.24% $5.32 9.9% 20
L-T Loblaw Companies Limited 1.0% $53.46 12.41% $0.55 15.2% 13
MFC-T Manulife Financial 4.1% $42.89 -2.39% $1.76 10.0% 11
MGA-N Magna 4.2% $46.62 11.69% $1.94 2.1% 15
MRU-T Metro Inc. 1.6% $92.20 2.25% $1.48 10.4% 30
RY-T Royal Bank of Canada 3.0% $203.63 18.20% $6.04 7.9% 14
SJ-T Stella-Jones Inc. 1.6% $76.55 4.88% $1.24 10.7% 20
STN-T Stantec Inc. 0.6% $147.95 30.80% $0.89 7.3% 13
T-T Telus 7.5% $21.83 11.21% $1.64 7.0% 21
TD-T TD Bank 3.8% $110.35 44.25% $4.20 2.9% 14
TFII-N TFI International 2.0% $88.80 -33.04% $1.80 12.5% 14
TIH-T Toromont Industries 1.3% $154.52 36.62% $2.08 8.3% 35
TRI-Q Thomson Reuters 1.5% $157.02 -3.30% $2.38 10.2% 31
TRP-T TC Energy Corp. 4.6% $74.43 9.10% $3.40 3.3% 24
WCN-N Waste Connections 0.7% $172.41 1.47% $1.26 7.7% 15
Averages 3.2% 10.1% 6.9% 21

Note: Stocks ending in “-N or -Q” declare earnings and dividends in US dollars. To achieve currency consistency between dividends and share price for these stocks, we have shown dividends in US dollars and share price in US dollars (these stocks are listed on a US exchange). The dividends for their Canadian counterparts (-T) would be converted into CDN dollars and would fluctuate with the exchange rate.

PAID subscribers enjoy full access to our enhanced weekly newsletter, premium content, and easy-to-follow trade alerts so they can build DGI portfolios alongside ours. This service provides the resources to develop your DGI business plan confidently. We do the work; you stay in control!

It truly is the subscription that pays dividends!

The greatest investment you can make is in yourself. Are you ready to take that step? 

For more articles and the full newsletter, check us out on magicpants.substack.com.
MP Market Review – September 19, 2025

Last updated by BM on September 23, 2025

Summary


Welcome to this week’s MP Market Review – your go-to source for insights and updates on the Canadian dividend growth companies we track on The List! While we’ve expanded our watchlists to include U.S. companies The List-USA, our Canadian lineup remains the cornerstone of our coaching approach.

Don’t miss out on exclusive newsletters and premium content that will help you sharpen your investing strategy. Explore it all at magicpants.substack.com.

Your journey to dividend growth mastery starts here – let’s dive in!

  • Last week, dividend growth of The List stayed the same with an average return of +6.9% YTD (income).
  • Last week, the price of The List was down from the previous week with an average return of +10.8% YTD (capital).
  • Last week, there were no dividend announcements from companies on The List.
  • Last week, there were no earnings reports from companies on The List.
  • This week, no companies from The List will report on earnings.

DGI Clipboard


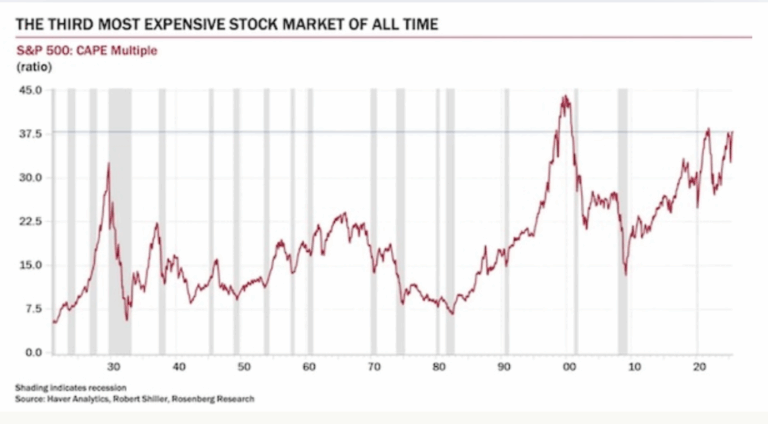
“However, stock market valuations have reached some truly rarified air. The Shiller cyclically adjusted price-to-earnings ratio is hovering around 37.5. And, as David Rosenberg points out, Over 35 is, “the only cutoff point where every single time [the forward return] is negative.”

Jesse Felder, The Felder Report

Why Overpaying for Dividend Growth Stocks Can Stall Your Wealth


Intro


The quote above speaks to the S&P 500, but the lesson applies no matter where you invest: valuation matters. In our dividend growth investing process, we spend a lot of time emphasizing undervaluation and the importance of buying at a sensible price. For today’s article, though, I want to flip the script and look at the other side of the coin, what can happen when you buy stocks that are overvalued.

Dividend growth investing works because it combines two of the most powerful forces in wealth building: rising income and compounding. The best companies increase their payouts year after year, and over time the snowball effect creates serious results.

But there is a catch. Even the highest-quality dividend grower can deliver disappointing returns if you buy it at the wrong price. Paying too much for a great business is one of the most common mistakes investors make.

Why Quality Alone Is Not Enough

It is tempting to believe that a wide-moat business with a long dividend streak is always worth owning. The problem is that returns depend not only on business quality but also on the valuation you lock in when you buy. If the stock is trading far above its fair value, future returns get squeezed.

A strong dividend record cannot save you from a poor entry point.

The Three Levers of Returns

Three factors drive every dividend growth investment:

  1. Dividend yield at purchase
  2. Future dividend growth
  3. Valuation multiple

If the starting yield is low because the stock is overpriced, the compounding engine is weakened from the start. Worse, when the valuation multiple eventually drifts back to its historical average, you can face years of stagnant or negative price performance.

Imagine a stock that usually yields 3 percent but now yields only 2 percent because the price has run ahead. For that stock to return to its normal yield, the price would need to fall by one-third. That is enough to wipe out several years of dividend growth. 

The Hidden Cost of Overpaying

Buying an overvalued dividend stock does more than hurt your immediate returns. It also carries a heavy opportunity cost. Capital tied up in a stretched valuation is capital that could have been compounding at higher yields elsewhere.

Dividend Yield Theory helps investors avoid this trap. By comparing the current yield to long-term averages, you can quickly spot when a dividend grower has become too expensive.

Investor Psychology at Work

Many investors still pull the trigger on expensive stocks because of behavioral traps:

  • Fear of missing out after a big run
  • Anchoring to recent performance
  • Confirmation bias from hearing only bullish commentary

These biases can push you into thinking that valuation no longer matters. History shows otherwise.

Lessons From the Past

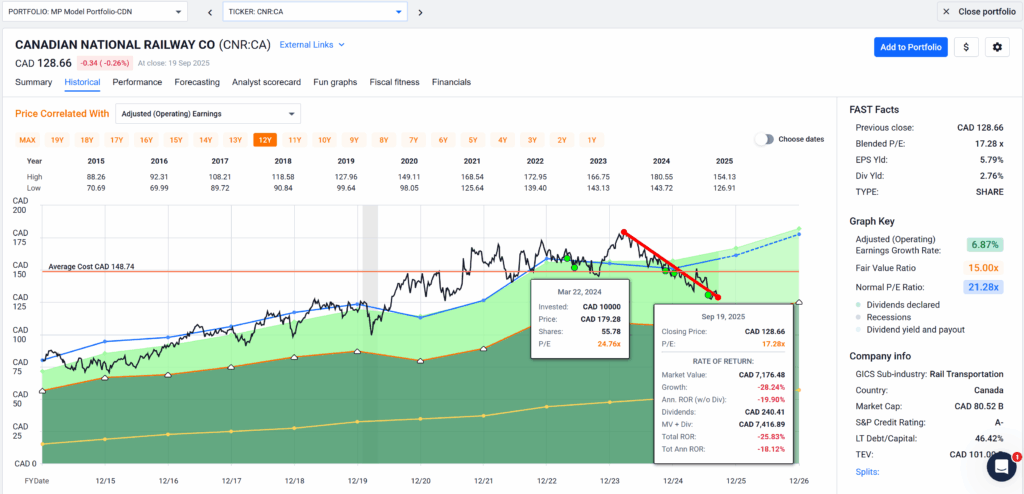
Even legendary Canadian dividend growers have gone through long stretches of poor returns when purchased at extreme valuations. Canadian National Railway (CNR-T) is a good example from the last few years.

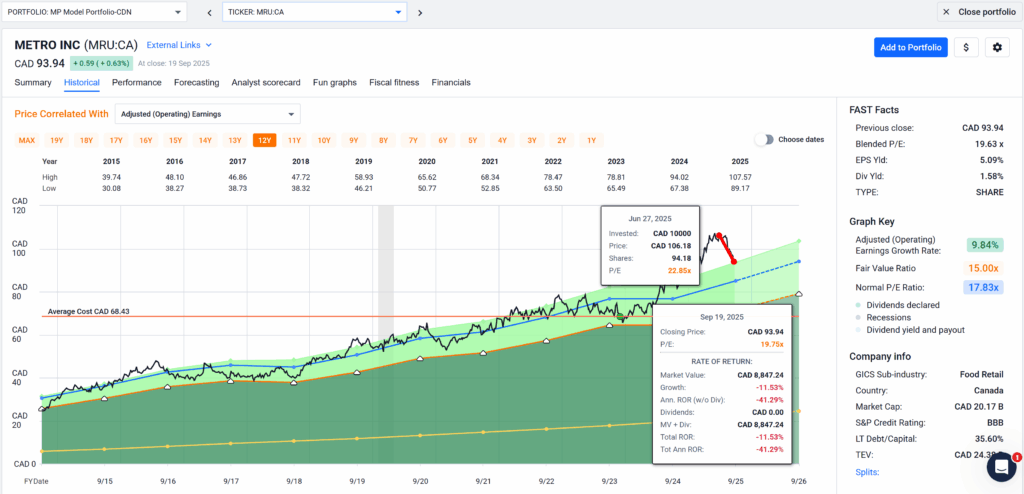
The following colours/lines on the FASTgraphs chart shown below represent: 

Black line: Price

Yellow line: Dividend

Orange line: Graham average of usually 15 P/E (price/earnings) for most stocks

Blue line: Normal P/E

Dashed or dotted lines: Estimates only

Green area: Earnings

Green dots: Purchases

CNR-T’s valuation reached its second-highest level in the past decade as of March 2024. For investors who bought at those highs, the road to meaningful returns may take time.

During the subsequent downturn, we have been selectively adding shares (green dots). While the stock has yet to find its bottom, our lower entry points increase the probability of achieving above-average returns once the recovery takes hold.

Fast forward to 2025, and we see a similar story with another quality dividend grower: Metro Inc. (MRU-T). After climbing to a historically high P/E multiple, the stock has begun to retrace. Where it ultimately settles is impossible to predict, but the lesson remains the same as with CNR-T. Valuation matters. By waiting patiently and only buying when the price makes sense, we tilt the odds in our favor. That was exactly our approach in 2023, when Metro’s P/E ratio came close to its lowest point of the decade (green dot), giving us a clear opportunity.

At present, we hold a modest 2% position in MRU-T, leaving us with plenty of dry powder to deploy when valuations once again align with historical fundamentals. This disciplined process of buying quality companies only at sensible prices remains at the heart of our dividend growth investing strategy.

Investors who buy at historical highs can endure long periods of weak performance while waiting for valuations to reset, even though dividends kept rising.

A Smarter Way Forward

Here are four practical ways to avoid the overvaluation trap:

  1. Check the yield against history. If today’s yield is far below the 10- or 20-year average, be cautious.
  2. Be patient. Great companies usually come back into range.
  3. Keep a watchlist. Track your favorite names so you are ready when value returns.

Spread your buys. Invest gradually instead of all at once to reduce timing risk.

Takeaway


Dividend growth investing rewards patience and discipline. Quality matters, but price matters too. Overpaying locks in a weak starting yield, sets you up for valuation compression, and blocks capital from compounding elsewhere.

The winning formula is simple: combine quality with value. Buy dividend growers when they are attractively priced and let time and compounding do the rest.

Become a paid partner, and I’ll show you exactly how I do it. With real money. In real stocks. In addition, gain full access to this post and exclusive, subscriber-only content. We do the work; you stay in control. Subscribe today and take your dividend growth investing to the next level!

DGI Scorecard

 
The List (2025)


The Magic Pants 2025 list includes 29 Canadian dividend growth stocks. Here are the criteria to be considered a candidate on ‘The List’:

  1. Dividend growth streak: 10 years or more.
  2. Market cap: Minimum one billion dollars.
  3. Diversification: Limit of five companies per sector, preferably two per industry.
  4. Cyclicality: Exclude REITs and pure-play energy companies due to high cyclicality.

Based on these criteria, companies are added or removed from ‘The List’ annually on January 1. Prices and dividends are updated weekly.

‘The List’ is not a portfolio but a coaching tool that helps us think about ideas and risk manage our model portfolio. We own some but not all the companies on ‘The List’. In other words, we might want to buy these companies when valuation looks attractive.

Our newsletter provides readers with a comprehensive insight into the implementation and advantages of our Canadian dividend growth investing strategy. This evidence-based, unbiased approach empowers DIY investors to outperform both actively managed dividend funds and passively managed indexes and dividend ETFs over longer-term horizons.

Performance of ‘The List’


Last week, dividend growth stayed the same, with an average return of +6.9% YTD (income).

The price of ‘The List’ was down from the previous week, with an average YTD return of +10.8% (capital).

Even though prices may fluctuate, the dependable growth in our income does not. Stay the course. You will be happy you did.

Last week’s best performers on ‘The List’ were Franco Nevada (FNV-N), up +6.75%.; Toromont Industries (TIH-T), up +3.78%; and TD Bank (TD-T) up +1.95%.

Thomson Reuters (TRI-Q) was the worst performer last week, down -6.06%.

SYMBOL COMPANY YLD PRICE YTD % DIV YTD % STREAK
ATD-T Alimentation Couche-Tard Inc. 1.1% $73.62 -6.87% $0.78 8.3% 15
BCE-T Bell Canada 9.0% $32.00 -4.53% $2.87 -28.1% 16
BIP-N Brookfield Infrastructure Partners 5.6% $30.91 -2.98% $1.72 6.2% 17
CCL-B-T CCL Industries Inc. 1.6% $79.82 8.42% $1.28 10.3% 23
CNR-T Canadian National Railway 2.8% $128.66 -12.35% $3.55 5.0% 29
CTC-A-T Canadian Tire 4.3% $164.70 7.15% $7.10 1.4% 14
CU-T Canadian Utilities Limited 4.9% $37.32 7.30% $1.83 1.0% 53
DOL-T Dollarama Inc. 0.2% $189.66 35.28% $0.41 18.1% 14
EMA-T Emera 4.6% $63.68 18.96% $2.90 0.7% 18
ENB-T Enbridge Inc. 5.5% $68.36 10.49% $3.77 3.0% 29
ENGH-T Enghouse Systems Limited 5.4% $21.36 -21.06% $1.16 16.0% 18
FNV-N Franco Nevada 0.7% $213.93 76.61% $1.52 5.6% 17
FTS-T Fortis Inc. 3.6% $67.94 13.96% $2.46 3.1% 51
GSY-T goeasy Ltd. 2.9% $204.51 22.34% $5.84 24.8% 10
IFC-T Intact Financial 2.0% $271.58 3.27% $5.32 9.9% 20
L-T Loblaw Companies Limited 1.0% $55.47 16.63% $0.55 15.2% 13
MFC-T Manulife Financial 4.0% $43.57 -0.84% $1.76 10.0% 11
MGA-N Magna 4.1% $46.94 12.46% $1.94 2.1% 15
MRU-T Metro Inc. 1.6% $93.94 4.18% $1.48 10.4% 30
RY-T Royal Bank of Canada 3.0% $203.14 17.92% $6.04 7.9% 14
SJ-T Stella-Jones Inc. 1.6% $77.92 6.75% $1.24 10.7% 20
STN-T Stantec Inc. 0.6% $151.24 33.71% $0.89 7.3% 13
T-T Telus 7.5% $21.93 11.72% $1.64 7.0% 21
TD-T TD Bank 3.9% $108.39 41.69% $4.20 2.9% 14
TFII-N TFI International 1.9% $93.45 -29.53% $1.80 12.5% 14
TIH-T Toromont Industries 1.4% $152.64 34.96% $2.08 8.3% 35
TRI-Q Thomson Reuters 1.5% $162.51 0.08% $2.38 10.2% 31
TRP-T TC Energy Corp. 4.7% $72.46 6.22% $3.40 3.3% 24
WCN-N Waste Connections 0.7% $173.97 2.39% $1.26 7.7% 15
Averages 3.2% 10.8% 6.9% 21

Note: Stocks ending in “-N or -Q” declare earnings and dividends in US dollars. To achieve currency consistency between dividends and share price for these stocks, we have shown dividends in US dollars and share price in US dollars (these stocks are listed on a US exchange). The dividends for their Canadian counterparts (-T) would be converted into CDN dollars and would fluctuate with the exchange rate.

PAID subscribers enjoy full access to our enhanced weekly newsletter, premium content, and easy-to-follow trade alerts so they can build DGI portfolios alongside ours. This service provides the resources to develop your DGI business plan confidently. We do the work; you stay in control!

It truly is the subscription that pays dividends!

The greatest investment you can make is in yourself. Are you ready to take that step? 

For more articles and the full newsletter, check us out on magicpants.substack.com.
MP Market Review – September 12, 2025

Last updated by BM on September 16, 2025

Summary


Welcome to this week’s MP Market Review – your go-to source for insights and updates on the Canadian dividend growth companies we track on The List! While we’ve expanded our watchlists to include U.S. companies The List-USA, our Canadian lineup remains the cornerstone of our coaching approach.

Don’t miss out on exclusive newsletters and premium content that will help you sharpen your investing strategy. Explore it all at magicpants.substack.com.

Your journey to dividend growth mastery starts here – let’s dive in!

  • Last week, dividend growth of The List stayed the same with an average return of +6.9% YTD (income).
  • Last week, the price of The List was down from the previous week with an average return of +11.2% YTD (capital).
  • Last week, there were no dividend announcements from companies on The List.
  • Last week, there were no earnings reports from companies on The List.
  • This week, no companies from The List will report on earnings.

DGI Clipboard


“Current yield, using its own historic yield as a guide, is, in my view, a fine valuation measure.”

— Tom Connolly

Timely Ten Stocks That Deserve a Second Look This Fall
Intro


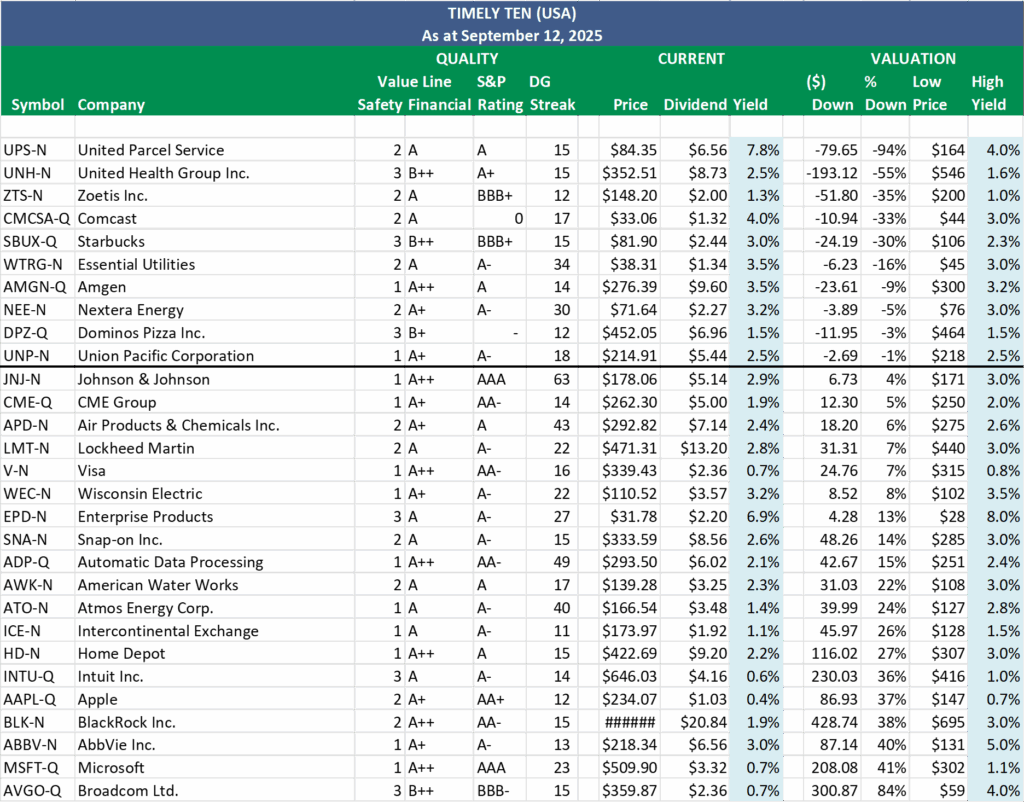
Our Timely Ten list remains the fastest way to assess valuation, which explains why it continues to be the most-read article each month.

On the Canadian side, there was little movement at the top this month. The only change was goeasy Ltd. (GSY) and Enbridge Inc. (ENB) swapping places in the tenth spot. While goeasy remains a quality name, it does not look deeply undervalued at present since its ten-year average yield still sits just below our high-yield estimate.

One stock worth watching is Waste Connections (WCN). It climbed two spots from last month, even as its share price has drifted lower since March. The company’s latest earnings were solid, suggesting this may be more a case of valuation cooling after a frothy run. Magna (MG) also deserves attention: its valuation metrics are appealing, and if tariff headwinds ease, it could be a timely opportunity to begin building a position.

Turning to the U.S. list, I want to correct an oversight. In last month’s update I mistakenly included Accenture (ACN) and Elevance Health (ELV), both strong holdings in my portfolios, but left out American Water Works (AWK) and Home Depot (HD), which are part of our watchlist. That error has now been corrected. From time to time, we do invest in companies that are not currently on our watchlists, which is what caused the confusion here.

As for current opportunities, Zoetis (ZTS), Amgen (AMGN) , and NextEra Energy (NEE) continue to get cheaper, making them good candidates for deeper research. UnitedHealth (UNH) still looks significantly undervalued despite a modest rebound in its share price. We already hold a full position there, so patience is the best course.

These names should keep us busy on the research front until Q3 earnings season ramps up at the end of October.

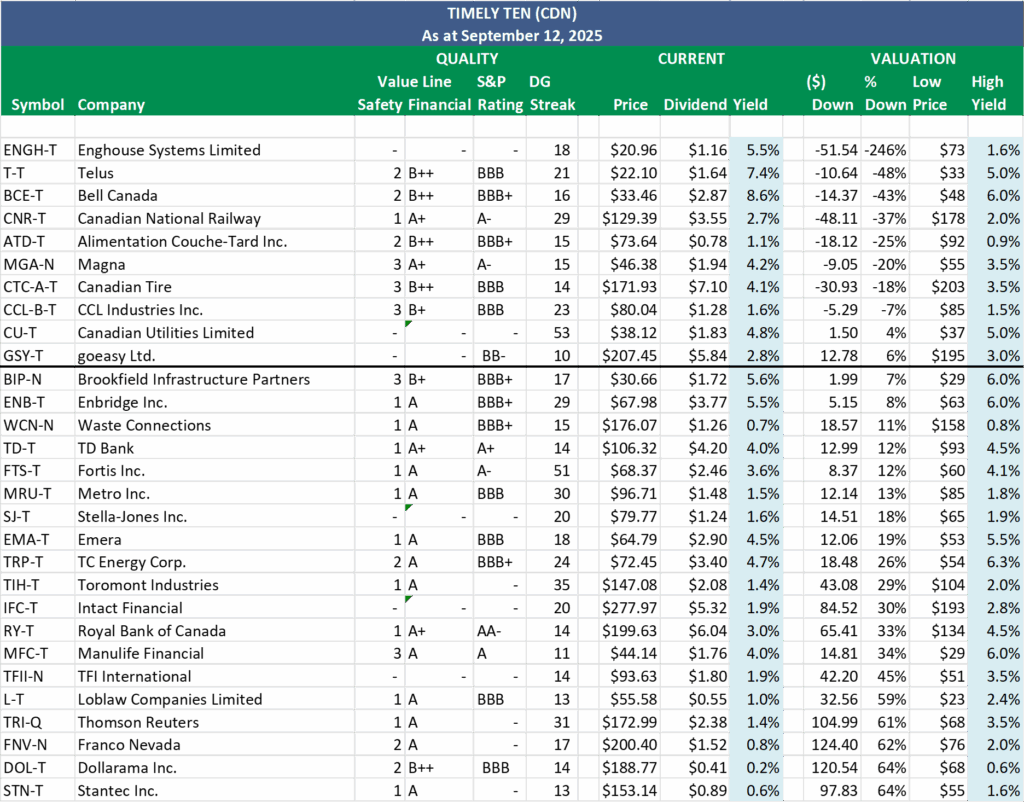
Here’s a recap on how we select our Timely Ten:

Step three in our process involves monitoring our quality dividend growers regularly, which can become quite challenging depending on the number of companies we track. Fortunately, we rely on ‘The List’ instead of the vast array of stocks in the index, which streamlines our task. Nevertheless, we continually seek methods to enhance our efficiency. Through dividend yield theory, we’ve discovered an approach that has proven remarkably effective in aiding us with our efforts over the years.

Dividend yield theory is a simple and intuitive approach to valuing dividend growth stocks. It suggests that the dividend yield of quality dividend growth stocks tends to revert to the mean over time, assuming that the underlying business model remains stable. In practical terms, if a stock pays a dividend yield above its ten-year average annual yield, its price will likely increase to return the yield to its historical average. Knowing that price and yield go in opposite directions, this theory helps us find stocks poised for a favourable price correction.

We have pre-screened our candidates using the criteria we initially laid out in building our watchlists. This helps us considerably narrow the universe of investable stocks.

  1. Dividend growth streak: 10 years or more.
  2. Market cap: Minimum one billion dollars.
  3. Diversification: Limit of five companies per sector, preferably two per industry.
  4. Cyclicality: Exclude REITs and pure-play energy companies due to high cyclicality.

Next, we rank our Canadian and American watchlists based on how far each stock’s price is below its fair value (Low Price), as determined by dividend yield theory. To find fair value, divide the current dividend (Dividend) by the stock’s historical high yield (High Yield).

Since price and yield move in opposite directions, a lower price results in a higher yield, and vice versa. The ten companies above the thick black line have a current price (Price) below fair value (Low Price). Put simply, these stocks have a current dividend yield higher than their historically high yield. According to dividend yield theory, these companies are sensibly priced and have the highest probability of a price increase in the short term. These are our Timely Ten.

Takeaway


History shows the Timely Ten is fertile ground for finding attractive entry points into high-quality dividend growers. Whether or not you act on the names, the list serves its purpose: to surface opportunities when quality meets value.

When making investment decisions, always prioritize a company’s ‘quality’ over a ‘sensible price’. For more details on our quality indicators, download our Free Guide to Finding Quality Dividend Growth Stocks here.

Become a paid partner, and I’ll show you exactly how I do it. With real money. In real stocks. In addition, gain full access to this post and exclusive, subscriber-only content. We do the work; you stay in control. Subscribe today and take your dividend growth investing to the next level!

DGI Scorecard

 
The List (2025)


The Magic Pants 2025 list includes 29 Canadian dividend growth stocks. Here are the criteria to be considered a candidate on ‘The List’:

  1. Dividend growth streak: 10 years or more.
  2. Market cap: Minimum one billion dollars.
  3. Diversification: Limit of five companies per sector, preferably two per industry.
  4. Cyclicality: Exclude REITs and pure-play energy companies due to high cyclicality.

Based on these criteria, companies are added or removed from ‘The List’ annually on January 1. Prices and dividends are updated weekly.

‘The List’ is not a portfolio but a coaching tool that helps us think about ideas and risk manage our model portfolio. We own some but not all the companies on ‘The List’. In other words, we might want to buy these companies when valuation looks attractive.

Our newsletter provides readers with a comprehensive insight into the implementation and advantages of our Canadian dividend growth investing strategy. This evidence-based, unbiased approach empowers DIY investors to outperform both actively managed dividend funds and passively managed indexes and dividend ETFs over longer-term horizons.

Performance of ‘The List’


Last week, dividend growth stayed the same, with an average return of +6.9% YTD (income).

The price of ‘The List’ was down from the previous week, with an average YTD return of +11.2% (capital).

Even though prices may fluctuate, the dependable growth in our income does not. Stay the course. You will be happy you did.

Last week’s best performers on ‘The List’ were Manulife Financial (MFC-T), up +3.91%.; Franco Nevada (FNV-N), up +3.41%; and TD Bank (TD-T) up +3.06%.

Alimentation Couche-Tard Inc. (ATD-T) was the worst performer last week, down -3.41%.

SYMBOL COMPANY YLD PRICE YTD % DIV YTD % STREAK
ATD-T Alimentation Couche-Tard Inc. 1.1% $73.64 -6.84% $0.78 8.3% 15
BCE-T Bell Canada 8.6% $33.46 -0.18% $2.87 -28.1% 16
BIP-N Brookfield Infrastructure Partners 5.6% $30.66 -3.77% $1.72 6.2% 17
CCL-B-T CCL Industries Inc. 1.6% $80.04 8.72% $1.28 10.3% 23
CNR-T Canadian National Railway 2.7% $129.39 -11.85% $3.55 5.0% 29
CTC-A-T Canadian Tire 4.1% $171.93 11.85% $7.10 1.4% 14
CU-T Canadian Utilities Limited 4.8% $38.12 9.60% $1.83 1.0% 53
DOL-T Dollarama Inc. 0.2% $188.77 34.64% $0.41 18.1% 14
EMA-T Emera 4.5% $64.79 21.03% $2.90 0.7% 18
ENB-T Enbridge Inc. 5.5% $67.98 9.88% $3.77 3.0% 29
ENGH-T Enghouse Systems Limited 5.5% $20.96 -22.54% $1.16 16.0% 18
FNV-N Franco Nevada 0.8% $200.40 65.44% $1.52 5.6% 17
FTS-T Fortis Inc. 3.6% $68.37 14.68% $2.46 3.1% 51
GSY-T goeasy Ltd. 2.8% $207.45 24.10% $5.84 24.8% 10
IFC-T Intact Financial 1.9% $277.97 5.70% $5.32 9.9% 20
L-T Loblaw Companies Limited 1.0% $55.58 16.86% $0.55 15.2% 13
MFC-T Manulife Financial 4.0% $44.14 0.46% $1.76 10.0% 11
MGA-N Magna 4.2% $46.38 11.12% $1.94 2.1% 15
MRU-T Metro Inc. 1.5% $96.71 7.25% $1.48 10.4% 30
RY-T Royal Bank of Canada 3.0% $199.63 15.88% $6.04 7.9% 14
SJ-T Stella-Jones Inc. 1.6% $79.77 9.29% $1.24 10.7% 20
STN-T Stantec Inc. 0.6% $153.14 35.39% $0.89 7.3% 13
T-T Telus 7.4% $22.10 12.58% $1.64 7.0% 21
TD-T TD Bank 4.0% $106.32 38.98% $4.20 2.9% 14
TFII-N TFI International 1.9% $93.63 -29.39% $1.80 12.5% 14
TIH-T Toromont Industries 1.4% $147.08 30.04% $2.08 8.3% 35
TRI-Q Thomson Reuters 1.4% $172.99 6.53% $2.38 10.2% 31
TRP-T TC Energy Corp. 4.7% $72.45 6.20% $3.40 3.3% 24
WCN-N Waste Connections 0.7% $176.07 3.63% $1.26 7.7% 15
Averages 3.1% 11.2% 6.9% 21

Note: Stocks ending in “-N or -Q” declare earnings and dividends in US dollars. To achieve currency consistency between dividends and share price for these stocks, we have shown dividends in US dollars and share price in US dollars (these stocks are listed on a US exchange). The dividends for their Canadian counterparts (-T) would be converted into CDN dollars and would fluctuate with the exchange rate.

PAID subscribers enjoy full access to our enhanced weekly newsletter, premium content, and easy-to-follow trade alerts so they can build DGI portfolios alongside ours. This service provides the resources to develop your DGI business plan confidently. We do the work; you stay in control!

It truly is the subscription that pays dividends!

The greatest investment you can make is in yourself. Are you ready to take that step? 

For more articles and the full newsletter, check us out on magicpants.substack.com.
MP Market Review – September 5, 2025

Last updated by BM on September 9, 2025

Summary


Welcome to this week’s MP Market Review – your go-to source for insights and updates on the Canadian dividend growth companies we track on The List! While we’ve expanded our watchlists to include U.S. companies The List-USA, our Canadian lineup remains the cornerstone of our coaching approach.

Don’t miss out on exclusive newsletters and premium content that will help you sharpen your investing strategy. Explore it all at magicpants.substack.com.

Your journey to dividend growth mastery starts here – let’s dive in!

  • Last week, dividend growth of The List stayed the same with an average return of +6.9% YTD (income).
  • Last week, the price of The List was up from the previous week with an average return of +11.3% YTD (capital).
  • Last week, there were no dividend announcements from companies on The List.
  • Last week, there were two earnings reports from companies on The List.
  • This week, no companies from The List will report on earnings.

DGI Clipboard


“If you look for companies that can raise their dividends year after year without milking operations, you will automatically be lead to high quality stocks.”

– Edmund Faltermayer, Fortune magazine, October 1990

Canada’s Next Dividend Growth Stars? A Sneak Peek at 2026 Candidates
Intro


The List has kicked off 2025 on a strong note, rising more than 11% year-to-date in our equal-weighted example that we track weekly in the newsletter. We use the Canadian version of The List to demonstrate our dividend growth investing (DGI) process in action.

It is important to emphasize that The List is not a portfolio. It is a coaching tool. While many of the companies on The List do eventually find their way into our model DGI portfolios, its primary purpose is to guide decision-making, not to serve as a ready-made portfolio. The same principle applies to our U.S. version, The List (USA).

Long-time subscribers will recall the process we go through each January when curating our watchlists for the year ahead. In addition to applying our four key criteria for identifying quality dividend growers, we follow a disciplined approach: additions or removals occur only once per year, on January 1.

Around this time of year, we begin looking ahead to identify new candidates for potential inclusion.

Identifying Potential Candidates

We’ve identified four companies on the TSX that will soon meet our first two criteria for inclusion on The List:

  1. Dividend Growth Streak: At least 10 years.
  2. Market Cap: Minimum of one billion dollars.

Evaluating Candidates

When deciding who stays and who goes, we apply two additional criteria:

  1. Diversification: We limit it to five companies per sector, preferably two per industry.
  2. Cyclicality: We exclude REITs and pure-play energy companies due to their high cyclicality.

Analysis

Industrials: Both Badger Infrastructure Solutions and StorageVault Canada are Industrials. Since the current version of The List already includes five companies in this sector, these candidates face an uphill battle to replace one of the existing dividend growth powerhouses.

Financial Services: TMX Group Limited also has strong credentials, but the Financial Services sector of The List is already highly competitive.

Utilities: Hydro One Limited is a regulated utility and stands out because there is still room for one more utility company on The List. This gives Hydro One a leg up, but it must still compete against other candidates that were left out last year.

In case you were wondering, here were the finalists who did not make The List last year that will be in the mix again this year.

Looking Ahead

At a minimum, we know that Bell Canada will be removed from The List in 2026 following its recent dividend cut. This ensures at least one opening, and we will review all candidates in detail in late December when we publish the new watchlists for 2026.

Takeaway


One of our guiding principles is to keep our watchlists to fewer than 30 stocks. This focused approach allows us to monitor each company closely, avoid unnecessary noise from the broader market, and develop a deeper understanding of the businesses we may invest in.

By following this disciplined process, we continue to refine our watchlists as new companies meet our criteria and prepare ourselves for attractive opportunities in dividend growth investing.

If you like one of the companies above and would like me to consider it for the 2026 version, please send me a brief note explaining your reasons. Your feedback is appreciated.

Become a paid partner, and I’ll show you exactly how I do it. With real money. In real stocks. In addition, gain full access to this post and exclusive, subscriber-only content. We do the work; you stay in control. Subscribe today and take your dividend growth investing to the next level!

DGI Scorecard

 
The List (2025)


The Magic Pants 2025 list includes 29 Canadian dividend growth stocks. Here are the criteria to be considered a candidate on ‘The List’:

  1. Dividend growth streak: 10 years or more.
  2. Market cap: Minimum one billion dollars.
  3. Diversification: Limit of five companies per sector, preferably two per industry.
  4. Cyclicality: Exclude REITs and pure-play energy companies due to high cyclicality.

Based on these criteria, companies are added or removed from ‘The List’ annually on January 1. Prices and dividends are updated weekly.

‘The List’ is not a portfolio but a coaching tool that helps us think about ideas and risk manage our model portfolio. We own some but not all the companies on ‘The List’. In other words, we might want to buy these companies when valuation looks attractive.

Our newsletter provides readers with a comprehensive insight into the implementation and advantages of our Canadian dividend growth investing strategy. This evidence-based, unbiased approach empowers DIY investors to outperform both actively managed dividend funds and passively managed indexes and dividend ETFs over longer-term horizons.

Performance of ‘The List’


Last week, dividend growth stayed the same, with an average return of +6.9% YTD (income).

The price of ‘The List’ was up from the previous week, with an average YTD return of +11.3% (capital).

Even though prices may fluctuate, the dependable growth in our income does not. Stay the course. You will be happy you did.

Last week’s best performers on ‘The List’ were Alimentation Couche-Tard Inc. (ATD-T), up +9.52%.; Franco Nevada (FNV-N), up +2.89%; and Stella-Jones Inc. (SJ-T) up +2.51%.

Enghouse Systems Limited (ENGH-T) was the worst performer last week, down -8.40%.

SYMBOL COMPANY YLD PRICE YTD % DIV YTD % STREAK
ATD-T Alimentation Couche-Tard Inc. 1.0% $76.24 -3.55% $0.78 8.3% 15
BCE-T Bell Canada 8.4% $34.23 2.12% $2.87 -28.1% 16
BIP-N Brookfield Infrastructure Partners 5.6% $30.51 -4.24% $1.72 6.2% 17
CCL-B-T CCL Industries Inc. 1.6% $80.43 9.25% $1.28 10.3% 23
CNR-T Canadian National Railway 2.7% $133.76 -8.87% $3.55 5.0% 29
CTC-A-T Canadian Tire 4.2% $169.97 10.58% $7.10 1.4% 14
CU-T Canadian Utilities Limited 4.8% $38.07 9.46% $1.83 1.0% 53
DOL-T Dollarama Inc. 0.2% $188.43 34.40% $0.41 18.1% 14
EMA-T Emera 4.5% $64.81 21.07% $2.90 0.7% 18
ENB-T Enbridge Inc. 5.6% $66.87 8.08% $3.77 3.0% 29
ENGH-T Enghouse Systems Limited 5.5% $20.95 -22.58% $1.16 16.0% 18
FNV-N Franco Nevada 0.8% $193.79 59.99% $1.52 5.6% 17
FTS-T Fortis Inc. 3.6% $68.18 14.36% $2.46 3.1% 51
GSY-T goeasy Ltd. 2.7% $214.54 28.34% $5.84 24.8% 10
IFC-T Intact Financial 1.9% $278.33 5.84% $5.32 9.9% 20
L-T Loblaw Companies Limited 1.0% $56.62 19.05% $0.55 15.2% 13
MFC-T Manulife Financial 4.1% $42.48 -3.32% $1.76 10.0% 11
MGA-N Magna 4.2% $45.88 9.92% $1.94 2.1% 15
MRU-T Metro Inc. 1.5% $97.31 7.92% $1.48 10.4% 30
RY-T Royal Bank of Canada 3.0% $200.22 16.22% $6.04 7.9% 14
SJ-T Stella-Jones Inc. 1.5% $80.18 9.85% $1.24 10.7% 20
STN-T Stantec Inc. 0.6% $149.87 32.50% $0.89 7.3% 13
T-T Telus 7.1% $22.97 17.01% $1.64 7.0% 21
TD-T TD Bank 4.1% $103.16 34.85% $4.20 2.9% 14
TFII-N TFI International 1.9% $96.46 -27.26% $1.80 12.5% 14
TIH-T Toromont Industries 1.4% $144.87 28.09% $2.08 8.3% 35
TRI-Q Thomson Reuters 1.4% $174.64 7.55% $2.38 10.2% 31
TRP-T TC Energy Corp. 4.7% $71.83 5.29% $3.40 3.3% 24
WCN-N Waste Connections 0.7% $179.30 5.53% $1.26 7.7% 15
Averages 3.1% 11.3% 6.9% 21

Note: Stocks ending in “-N or -Q” declare earnings and dividends in US dollars. To achieve currency consistency between dividends and share price for these stocks, we have shown dividends in US dollars and share price in US dollars (these stocks are listed on a US exchange). The dividends for their Canadian counterparts (-T) would be converted into CDN dollars and would fluctuate with the exchange rate.

PAID subscribers enjoy full access to our enhanced weekly newsletter, premium content, and easy-to-follow trade alerts so they can build DGI portfolios alongside ours. This service provides the resources to develop your DGI business plan confidently. We do the work; you stay in control!

It truly is the subscription that pays dividends!

The greatest investment you can make is in yourself. Are you ready to take that step? 

For more articles and the full newsletter, check us out on magicpants.substack.com.

MP Market Review – August 29, 2025

Last updated by BM on September 2, 2025

Summary


Welcome to this week’s MP Market Review – your go-to source for insights and updates on the Canadian dividend growth companies we track on The List! While we’ve expanded our watchlists to include U.S. companies The List-USA, our Canadian lineup remains the cornerstone of our coaching approach.

Don’t miss out on exclusive newsletters and premium content that will help you sharpen your investing strategy. Explore it all at magicpants.substack.com.

Your journey to dividend growth mastery starts here – let’s dive in!

  • Below The List chart is our monthly U.S. watchlist, The List-USA.
  • Last week, dividend growth of The List stayed the same with an average return of +6.9% YTD (income).
  • Last week, the price of The List was down from the previous week with an average return of +11.1% YTD (capital).
  • Last week, there were no dividend announcements from companies on The List.
  • Last week, there were three earnings reports from companies on The List.
  • This week, two companies from The List will report on earnings.

DGI Clipboard


“Measuring performance without simultaneously measuring valuation is a job half done.”

– Chuck Carnevale

Double-Digit Returns Without Chasing Market Hype
Intro


When I launched our model portfolios for coaching purposes in Canada in May 2022 and in the United States in May 2023, I had two clear goals.

The first and most important goal was to generate a steadily rising stream of dividends from high-quality companies. The second goal was to build portfolios capable of delivering above-average total returns over the long term (five to ten years). By “average,” I mean the benchmark indexes: the TSX Composite in Canada and the S&P 500 in the United States.

Achieving our second goal (outperforming the indexes) has proven to be challenging in the short term.

This past week I shared the quarterly performance results for our Canadian and American model portfolios. Both are now delivering annualized returns above 10% since inception.

Our Canadian model portfolio experienced some early cash drag as we were conservative in putting our initial capital to work. As the portfolio has grown, shorter-term returns have strengthened, and we are now seeing much better results. While index returns have also been strong, our portfolio is quickly closing the gap.

Although I have not shared as much commentary on the USA model portfolio in this blog, it is worth noting the remarkable performance of the S&P 500 over the past 1, 3, 5, and 10 years. The returns have been outstanding, and it is understandable why many investors might conclude that simply owning the index is the best way to outperform a dividend growth investing strategy. Since we did not have a public-facing DGI American portfolio over that same period, we cannot know for certain how the comparison would have played out.

A few things to consider before abandoning DGI for an American index investing strategy:

  1. The Magnificent Seven (Apple, Microsoft, Nvidia, Amazon, Meta, Alphabet, and Tesla) have collectively added nearly $7 trillion in market value since early 2023. That surge represents almost the entire gain of the S&P 500 index over that period.
  2. Today, these seven stocks make up 34% of the S&P 500 index, and they are trading at some of the highest valuations in history.

If you had not owned at least a couple of those companies, your total return from the index over the past two and a half years would have been essentially zero.

Takeaway


As we continue building our model DGI portfolios, I am encouraged by the consistency of our results this past quarter. While we acknowledge the strength of index investing today, we remain confident that our approach will deliver superior results over the long term.

The key is to stay focused, avoiding the temptation of chasing indexes or stocks trading at stretched valuations, and instead remain disciplined in following the process. That discipline not only builds lasting wealth but also provides peace of mind, allowing you to sleep well at night without worrying about when the next correction will arrive.

Become a paid partner, and I’ll show you exactly how I do it. With real money. In real stocks. In addition, gain full access to this post and exclusive, subscriber-only content. We do the work; you stay in control. Subscribe today and take your dividend growth investing to the next level!

DGI Scorecard

 
The List (2025)


The Magic Pants 2025 list includes 29 Canadian dividend growth stocks. Here are the criteria to be considered a candidate on ‘The List’:

  1. Dividend growth streak: 10 years or more.
  2. Market cap: Minimum one billion dollars.
  3. Diversification: Limit of five companies per sector, preferably two per industry.
  4. Cyclicality: Exclude REITs and pure-play energy companies due to high cyclicality.

Based on these criteria, companies are added or removed from ‘The List’ annually on January 1. Prices and dividends are updated weekly.

‘The List’ is not a portfolio but a coaching tool that helps us think about ideas and risk manage our model portfolio. We own some but not all the companies on ‘The List’. In other words, we might want to buy these companies when valuation looks attractive.

Our newsletter provides readers with a comprehensive insight into the implementation and advantages of our Canadian dividend growth investing strategy. This evidence-based, unbiased approach empowers DIY investors to outperform both actively managed dividend funds and passively managed indexes and dividend ETFs over longer-term horizons.

Performance of ‘The List’


Last week, dividend growth stayed the same, with an average return of +6.9% YTD (income).

The price of ‘The List’ was down from the previous week, with an average YTD return of +11.1% (capital).

Even though prices may fluctuate, the dependable growth in our income does not. Stay the course. You will be happy you did.

Last week’s best performers on ‘The List’ were Royal Bank of Canada (RY-T), up +4.68%.; Brookfield Infrastructure Partners (BIP-N), up +2.54%; and goeasy Ltd. (GSY-T) up +1.87%.

Dollarama Inc. (DOL-T) was the worst performer last week, down -3.15%.

SYMBOL COMPANY YLD PRICE YTD % DIV YTD % STREAK
ATD-T Alimentation Couche-Tard Inc. 1.1% $69.61 -11.94% $0.78 8.3% 15
BCE-T Bell Canada 8.4% $34.27 2.24% $2.87 -28.1% 16
BIP-N Brookfield Infrastructure Partners 5.5% $31.45 -1.29% $1.72 6.2% 17
CCL-B-T CCL Industries Inc. 1.6% $82.27 11.75% $1.28 10.3% 23
CNR-T Canadian National Railway 2.7% $132.95 -9.42% $3.55 5.0% 29
CTC-A-T Canadian Tire 4.1% $171.25 11.41% $7.10 1.4% 14
CU-T Canadian Utilities Limited 4.8% $38.23 9.92% $1.83 1.0% 53
DOL-T Dollarama Inc. 0.2% $187.26 33.57% $0.41 18.1% 14
EMA-T Emera 4.4% $65.41 22.19% $2.90 0.7% 18
ENB-T Enbridge Inc. 5.7% $66.45 7.40% $3.77 3.0% 29
ENGH-T Enghouse Systems Limited 5.1% $22.87 -15.48% $1.16 16.0% 18
FNV-N Franco Nevada 0.8% $188.35 55.49% $1.52 5.6% 17
FTS-T Fortis Inc. 3.6% $68.35 14.64% $2.46 3.1% 51
GSY-T goeasy Ltd. 2.7% $213.04 27.45% $5.84 24.8% 10
IFC-T Intact Financial 1.9% $275.03 4.59% $5.32 9.9% 20
L-T Loblaw Companies Limited 1.0% $56.09 17.94% $0.55 15.2% 13
MFC-T Manulife Financial 4.2% $42.25 -3.85% $1.76 10.0% 11
MGA-N Magna 4.2% $45.90 9.97% $1.94 2.1% 15
MRU-T Metro Inc. 1.5% $98.44 9.17% $1.48 10.4% 30
RY-T Royal Bank of Canada 3.0% $199.58 15.85% $6.04 7.9% 14
SJ-T Stella-Jones Inc. 1.6% $78.22 7.17% $1.24 10.7% 20
STN-T Stantec Inc. 0.6% $149.28 31.98% $0.89 7.3% 13
T-T Telus 7.2% $22.64 15.33% $1.64 7.0% 21
TD-T TD Bank 4.1% $103.12 34.80% $4.20 2.9% 14
TFII-N TFI International 1.9% $94.81 -28.50% $1.80 12.5% 14
TIH-T Toromont Industries 1.4% $143.59 26.96% $2.08 8.3% 35
TRI-Q Thomson Reuters 1.3% $177.61 9.38% $2.38 10.2% 31
TRP-T TC Energy Corp. 4.8% $71.52 4.84% $3.40 3.3% 24
WCN-N Waste Connections 0.7% $184.81 8.77% $1.26 7.7% 15
Averages 3.1% 11.1% 6.9% 21

Note: Stocks ending in “-N or -Q” declare earnings and dividends in US dollars. To achieve currency consistency between dividends and share price for these stocks, we have shown dividends in US dollars and share price in US dollars (these stocks are listed on a US exchange). The dividends for their Canadian counterparts (-T) would be converted into CDN dollars and would fluctuate with the exchange rate.

PAID subscribers enjoy full access to our enhanced weekly newsletter, premium content, and easy-to-follow trade alerts so they can build DGI portfolios alongside ours. This service provides the resources to develop your DGI business plan confidently. We do the work; you stay in control!

It truly is the subscription that pays dividends!

The greatest investment you can make is in yourself. Are you ready to take that step? 

For more articles and the full newsletter, check us out on magicpants.substack.com.
MP Market Review – August 22, 2025

Last updated by BM on August 26, 2025

Summary


Welcome to this week’s MP Market Review – your go-to source for insights and updates on the Canadian dividend growth companies we track on The List! While we’ve expanded our watchlists to include U.S. companies The List-USA, our Canadian lineup remains the cornerstone of our coaching approach.

Don’t miss out on exclusive newsletters and premium content that will help you sharpen your investing strategy. Explore it all at magicpants.substack.com.

Your journey to dividend growth mastery starts here – let’s dive in!

  • Last week, dividend growth of The List stayed the same with an average return of +6.9% YTD (income).
  • Last week, the price of The List was up from the previous week with an average return of +11.6% YTD (capital).
  • Last week, there were no dividend announcements from companies on The List.
  • Last week, there were no earnings reports from companies on The List.
  • This week, three companies from The List will report on earnings.

DGI Clipboard


“Current yield, using its own historic yield as a guide, is, in my view, a fine valuation measure.”

— Tom Connolly

Two Stocks That Flew Off the Timely Ten—Were You Ready?
Intro


It is becoming almost routine in today’s volatile markets: each month, one or two companies that appeared in the previous Timely Ten fall off the list. The reason is straightforward: when a stock’s price rises, its dividend yield falls back toward its average, sometimes pushing it out of contention. Seeing this happen in just a few weeks is unusual, but it happens more often than you might expect.

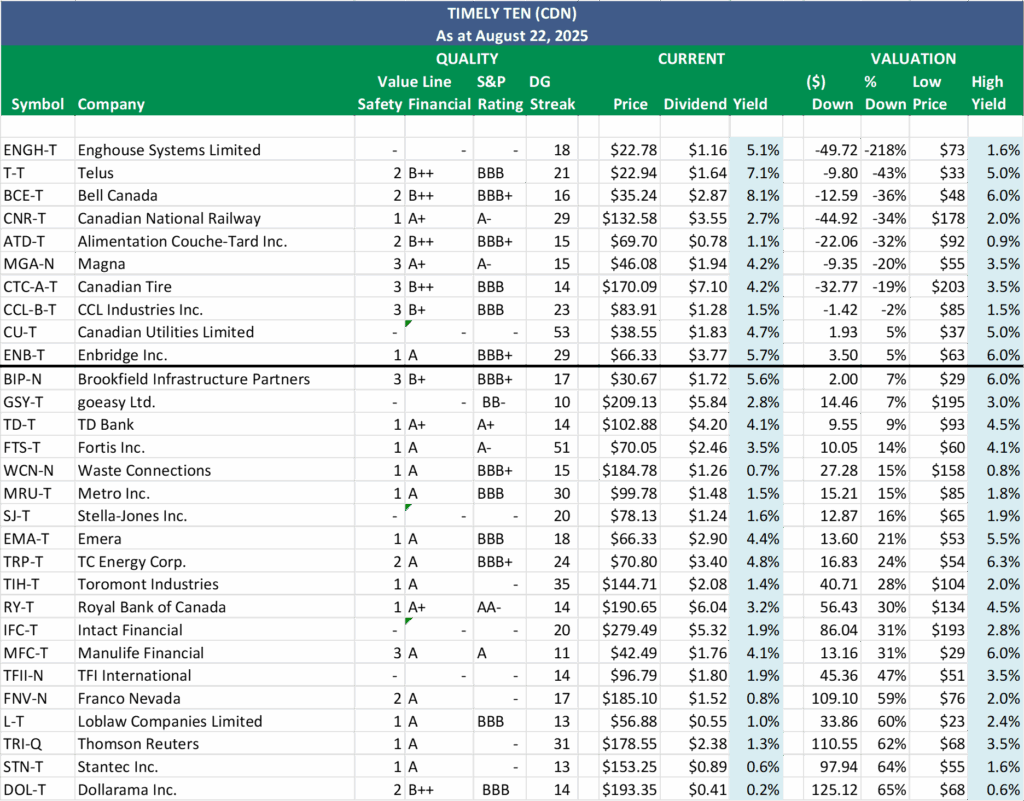
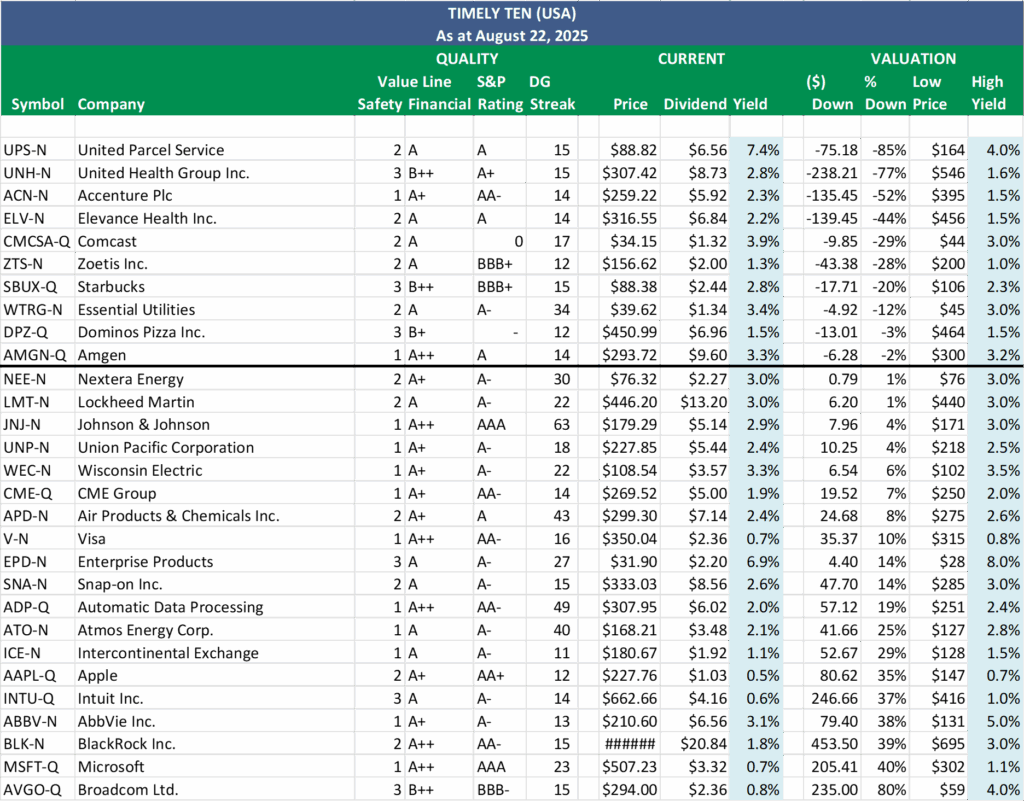
Below are this month’s Canadian and American Timely Ten lists. Two names worth highlighting are goeasy Ltd. (GSY-T) from Canada and Johnson & Johnson (JNJ-N) from the U.S.:

  • goeasy Ltd. was trading at $169 with a 3.4% yield when it last appeared on July 11, ranking seventh in our Canadian Timely Ten. By last Friday, the stock had climbed to $209.13, dropping the yield to 2.8%.
  • Johnson & Johnson entered the American Timely Ten at ninth place last month with a price of $156.90 and a 3.3% yield. By last Friday, it had risen to $179.29, with the yield now at 2.9%.

For two stocks on the Timely Ten to appreciate this much in just over a month is certainly not the historical norm. Still, it reinforces how effective dividend yield theory can be as a valuation tool for identifying candidates that are undervalued and worth further research.

So how did we miss these? In goeasy Lts.’s case, we already owned shares within our Canadian model portfolio and chose patience over adding more. With Johnson & Johnson, the valuation was attractive, but we were already properly weighted in Healthcare with UnitedHealth and Zoetis, both trading below our cost base. Adding JNJ would have pushed us beyond our sector limits, so we passed.

The takeaway is clear: even when companies look attractively priced, they still need to fit within our broader investment process. A disciplined framework may hold you back at times, but it prevents bigger mistakes in the long run. We are happy to see gains in our existing goeasy Ltd. position and would consider adding more on a pullback. As for Johnson & Johnson, we continue to believe UnitedHealth will deliver better long-term returns, so staying balanced in Healthcare is a trade-off we are comfortable making. 

Here’s a recap on how we select our Timely Ten:

Step three in our process involves monitoring our quality dividend growers regularly, which can become quite challenging depending on the number of companies we track. Fortunately, we rely on ‘The List’ instead of the vast array of stocks in the index, which streamlines our task. Nevertheless, we continually seek methods to enhance our efficiency. Through dividend yield theory, we’ve discovered an approach that has proven remarkably effective in aiding us with our efforts over the years.

Dividend yield theory is a simple and intuitive approach to valuing dividend growth stocks. It suggests that the dividend yield of quality dividend growth stocks tends to revert to the mean over time, assuming that the underlying business model remains stable. In practical terms, if a stock pays a dividend yield above its ten-year average annual yield, its price will likely increase to return the yield to its historical average. Knowing that price and yield go in opposite directions, this theory helps us find stocks poised for a favourable price correction.

We have pre-screened our candidates using the criteria we initially laid out in building our watchlists. This helps us considerably narrow the universe of investable stocks.

  1. Dividend growth streak: 10 years or more.
  2. Market cap: Minimum one billion dollars.
  3. Diversification: Limit of five companies per sector, preferably two per industry.
  4. Cyclicality: Exclude REITs and pure-play energy companies due to high cyclicality.

Next, we rank our Canadian and American watchlists based on how far each stock’s price is below its fair value (Low Price), as determined by dividend yield theory. To find fair value, divide the current dividend (Dividend) by the stock’s historical high yield (High Yield).

Since price and yield move in opposite directions, a lower price results in a higher yield, and vice versa. The ten companies above the thick black line have a current price (Price) below fair value (Low Price). Put simply, these stocks have a current dividend yield higher than their historically high yield. According to dividend yield theory, these companies are sensibly priced and have the highest probability of a price increase in the short term. These are our Timely Ten.

Takeaway


History shows the Timely Ten is fertile ground for finding attractive entry points into high-quality dividend growers. Whether or not you act on the names, the list serves its purpose: to surface opportunities when quality meets value.

When making investment decisions, always prioritize a company’s ‘quality’ over a ‘sensible price’. For more details on our quality indicators, download our Free Guide to Finding Quality Dividend Growth Stocks here.

Become a paid partner, and I’ll show you exactly how I do it. With real money. In real stocks. In addition, gain full access to this post and exclusive, subscriber-only content. We do the work; you stay in control. Subscribe today and take your dividend growth investing to the next level!

DGI Scorecard

 
The List (2025)


The Magic Pants 2025 list includes 29 Canadian dividend growth stocks. Here are the criteria to be considered a candidate on ‘The List’:

  1. Dividend growth streak: 10 years or more.
  2. Market cap: Minimum one billion dollars.
  3. Diversification: Limit of five companies per sector, preferably two per industry.
  4. Cyclicality: Exclude REITs and pure-play energy companies due to high cyclicality.

Based on these criteria, companies are added or removed from ‘The List’ annually on January 1. Prices and dividends are updated weekly.

‘The List’ is not a portfolio but a coaching tool that helps us think about ideas and risk manage our model portfolio. We own some but not all the companies on ‘The List’. In other words, we might want to buy these companies when valuation looks attractive.

Our newsletter provides readers with a comprehensive insight into the implementation and advantages of our Canadian dividend growth investing strategy. This evidence-based, unbiased approach empowers DIY investors to outperform both actively managed dividend funds and passively managed indexes and dividend ETFs over longer-term horizons.

Performance of ‘The List’


Last week, dividend growth stayed the same, with an average return of +6.9% YTD (income).

The price of ‘The List’ was up from the previous week, with an average YTD return of +11.6% (capital).

Even though prices may fluctuate, the dependable growth in our income does not. Stay the course. You will be happy you did.

Last week’s best performers on ‘The List’ were TFI International (TFII-N), up +6.75%.; Franco Nevada (FNV-N), up +4.36%; and Stantec Inc. (STN-T) up +4.31%.

Alimentation Couche-Tard Inc. (ATD-T) was the worst performer last week, down -0.46%.

SYMBOL COMPANY YLD PRICE YTD % DIV YTD % STREAK
ATD-T Alimentation Couche-Tard Inc. 1.1% $69.70 -11.83% $0.78 8.3% 15
BCE-T Bell Canada 8.1% $35.24 5.13% $2.87 -28.1% 16
BIP-N Brookfield Infrastructure Partners 5.6% $30.67 -3.74% $1.72 6.2% 17
CCL-B-T CCL Industries Inc. 1.5% $83.91 13.98% $1.28 10.3% 23
CNR-T Canadian National Railway 2.7% $132.58 -9.67% $3.55 5.0% 29
CTC-A-T Canadian Tire 4.2% $170.09 10.66% $7.10 1.4% 14
CU-T Canadian Utilities Limited 4.7% $38.55 10.84% $1.83 1.0% 53
DOL-T Dollarama Inc. 0.2% $193.35 37.91% $0.41 18.1% 14
EMA-T Emera 4.4% $66.33 23.91% $2.90 0.7% 18
ENB-T Enbridge Inc. 5.7% $66.33 7.21% $3.77 3.0% 29
ENGH-T Enghouse Systems Limited 5.1% $22.78 -15.82% $1.16 16.0% 18
FNV-N Franco Nevada 0.8% $185.10 52.81% $1.52 5.6% 17
FTS-T Fortis Inc. 3.5% $70.05 17.49% $2.46 3.1% 51
GSY-T goeasy Ltd. 2.8% $209.13 25.11% $5.84 24.8% 10
IFC-T Intact Financial 1.9% $279.49 6.28% $5.32 9.9% 20
L-T Loblaw Companies Limited 1.0% $56.88 19.60% $0.55 15.2% 13
MFC-T Manulife Financial 4.1% $42.49 -3.30% $1.76 10.0% 11
MGA-N Magna 4.2% $46.08 10.40% $1.94 2.1% 15
MRU-T Metro Inc. 1.5% $99.78 10.66% $1.48 10.4% 30
RY-T Royal Bank of Canada 3.2% $190.65 10.67% $6.04 7.9% 14
SJ-T Stella-Jones Inc. 1.6% $78.13 7.04% $1.24 10.7% 20
STN-T Stantec Inc. 0.6% $153.25 35.49% $0.89 7.3% 13
T-T Telus 7.1% $22.94 16.86% $1.64 7.0% 21
TD-T TD Bank 4.1% $102.88 34.48% $4.20 2.9% 14
TFII-N TFI International 1.9% $96.79 -27.01% $1.80 12.5% 14
TIH-T Toromont Industries 1.4% $144.71 27.95% $2.08 8.3% 35
TRI-Q Thomson Reuters 1.3% $178.55 9.96% $2.38 10.2% 31
TRP-T TC Energy Corp. 4.8% $70.80 3.78% $3.40 3.3% 24
WCN-N Waste Connections 0.7% $184.78 8.75% $1.26 7.7% 15
Averages 3.1% 11.6% 6.9% 21

Note: Stocks ending in “-N or -Q” declare earnings and dividends in US dollars. To achieve currency consistency between dividends and share price for these stocks, we have shown dividends in US dollars and share price in US dollars (these stocks are listed on a US exchange). The dividends for their Canadian counterparts (-T) would be converted into CDN dollars and would fluctuate with the exchange rate.

PAID subscribers enjoy full access to our enhanced weekly newsletter, premium content, and easy-to-follow trade alerts so they can build DGI portfolios alongside ours. This service provides the resources to develop your DGI business plan confidently. We do the work; you stay in control!

It truly is the subscription that pays dividends!

The greatest investment you can make is in yourself. Are you ready to take that step? 

For more articles and the full newsletter, check us out on magicpants.substack.com.
MP Market Review – August 15, 2025

Last updated by BM on August 19, 2025

Summary


Welcome to this week’s MP Market Review – your go-to source for insights and updates on the Canadian dividend growth companies we track on The List! While we’ve expanded our watchlists to include U.S. companies The List-USA, our Canadian lineup remains the cornerstone of our coaching approach.

Don’t miss out on exclusive newsletters and premium content that will help you sharpen your investing strategy. Explore it all at magicpants.substack.com.

Your journey to dividend growth mastery starts here – let’s dive in!

  • Last week, dividend growth of The List stayed the same with an average return of +6.9% YTD (income).
  • Last week, the price of The List was up from the previous week with an average return of +9.7% YTD (capital).
  • Last week, there were no dividend announcements from companies on The List.
  • Last week, there were four earnings reports from companies on The List.
  • This week, no companies from The List will report on earnings.

DGI Clipboard


“Success in investing has two parts: finding edge and fully taking advantage of it through proper position sizing. Almost all investment firms focus on edge, while position sizing generally gets much less attention.”

– Michael J. Mauboussin, Thirty Years: Reflections on the Ten Attributes of Great Investors

Balancing Opportunity and Risk: Position Sizing in the All-Canadian DGI Portfolio
Intro


Last week’s article in the MP Market Review (“The All-Canadian DGI Portfolio”) was a good primer for anyone looking to begin their dividend growth investing (DGI) journey with a lump sum investment.

This week, I decided to make my position sizing analysis available in the Free Subscriber section of the newsletter, rather than restricting it to Paid Subscribers. That said, our DGI Candidate List 2025 – Quality/Category/Sizing document remains exclusive to Paid Subscribers in the Premium Content section of our website. This ensures you’ll always have access to an up-to-date version if you are looking for options to put a lump sum to work using our valuation weighted strategy.

In this follow-up article, I’ll focus on how I might invest that lump sum today, with particular attention to current valuations.

Valuation is the second step in our three-step process. Once we’ve separated the “wheat from the chaff” by identifying quality companies, we turn to valuation.

First, we sort The All-Canadian DGI Portfolio by category (Core and Non-Core) and display our minimum and maximum position sizes for each stock, we now have a clear framework to guide allocation decisions.

We will then use our Dividend Yield Theory (DYT) valuation metric in this example to decide how much of our capital to deploy.

Dividend Yield Theory is a straightforward and intuitive way to value dividend growth stocks. The premise is simple: the dividend yield of quality companies tends to revert to its historical average over time, provided the business model remains stable. In practice, if a stock’s current yield is above its ten-year average, the price is likely undervalued and there is a higher probability it may rise to bring the yield back in line with its historical mean. Since price and yield move in opposite directions, DYT helps us identify stocks with the potential for favorable price appreciation.

When allocating capital, we assign larger position sizes to companies trading closer to their high yield. Conversely, when a stock trades at a lower yield relative to its history, we keep the position closer to our minimum. This approach ensures we stay consistently invested in quality dividend growers while managing risk and valuation discipline.

Takeaway


Position sizes may shift with market sentiment, but this approach provides a conservative way to put 50% of your capital to work today and kick-start your dividend growth investing journey.

Our DGI Alerts will guide you in deploying the remaining capital at sensible prices, while you also start collecting dividends that can be reinvested to accelerate long-term growth.

Become a paid partner, and I’ll show you exactly how I do it. With real money. In real stocks. In addition, gain full access to this post and exclusive, subscriber-only content. We do the work; you stay in control. Subscribe today and take your dividend growth investing to the next level!

DGI Scorecard

 
The List (2025)


The Magic Pants 2025 list includes 29 Canadian dividend growth stocks. Here are the criteria to be considered a candidate on ‘The List’:

  1. Dividend growth streak: 10 years or more.
  2. Market cap: Minimum one billion dollars.
  3. Diversification: Limit of five companies per sector, preferably two per industry.
  4. Cyclicality: Exclude REITs and pure-play energy companies due to high cyclicality.

Based on these criteria, companies are added or removed from ‘The List’ annually on January 1. Prices and dividends are updated weekly.

‘The List’ is not a portfolio but a coaching tool that helps us think about ideas and risk manage our model portfolio. We own some but not all the companies on ‘The List’. In other words, we might want to buy these companies when valuation looks attractive.

Our newsletter provides readers with a comprehensive insight into the implementation and advantages of our Canadian dividend growth investing strategy. This evidence-based, unbiased approach empowers DIY investors to outperform both actively managed dividend funds and passively managed indexes and dividend ETFs over longer-term horizons.

Performance of ‘The List’


Last week, dividend growth stayed the same, with an average return of +6.9% YTD (income).

The price of ‘The List’ was up from the previous week, with an average YTD return of +9.7% (capital).

Even though prices may fluctuate, the dependable growth in our income does not. Stay the course. You will be happy you did.

Last week’s best performers on ‘The List’ were Bell Canada (BCE-T), up +5.55%.; TFI International (TFII-N), up +5.22%; and Magna (MGA-N) up +4.33%.

Thomson Reuters (TRI-Q) was the worst performer last week, down -4.80%.

SYMBOL COMPANY YLD PRICE YTD % DIV YTD % STREAK
ATD-T Alimentation Couche-Tard Inc. 1.1% $70.02 -11.42% $0.78 8.3% 15
BCE-T Bell Canada 8.1% $35.37 5.52% $2.87 -28.1% 16
BIP-N Brookfield Infrastructure Partners 5.8% $29.81 -6.43% $1.72 6.2% 17
CCL-B-T CCL Industries Inc. 1.6% $80.64 9.54% $1.28 10.3% 23
CNR-T Canadian National Railway 2.8% $128.92 -12.17% $3.55 5.0% 29
CTC-A-T Canadian Tire 4.3% $166.48 8.31% $7.10 1.4% 14
CU-T Canadian Utilities Limited 4.8% $38.22 9.89% $1.83 1.0% 53
DOL-T Dollarama Inc. 0.2% $192.31 37.17% $0.41 18.1% 14
EMA-T Emera 4.4% $66.17 23.61% $2.90 0.7% 18
ENB-T Enbridge Inc. 5.8% $65.01 5.08% $3.77 3.0% 29
ENGH-T Enghouse Systems Limited 5.2% $22.17 -18.07% $1.16 16.0% 18
FNV-N Franco Nevada 0.9% $177.37 46.43% $1.52 5.6% 17
FTS-T Fortis Inc. 3.5% $70.15 17.66% $2.46 3.1% 51
GSY-T goeasy Ltd. 2.9% $204.34 22.24% $5.84 24.8% 10
IFC-T Intact Financial 1.9% $279.17 6.16% $5.32 9.9% 20
L-T Loblaw Companies Limited 1.0% $227.35 19.52% $2.21 15.2% 13
MFC-T Manulife Financial 4.2% $42.00 -4.42% $1.76 10.0% 11
MGA-N Magna 4.4% $44.31 6.16% $1.94 2.1% 15
MRU-T Metro Inc. 1.5% $99.12 9.93% $1.48 10.4% 30
RY-T Royal Bank of Canada 3.2% $188.50 9.42% $6.04 7.9% 14
SJ-T Stella-Jones Inc. 1.6% $76.98 5.47% $1.24 10.7% 20
STN-T Stantec Inc. 0.6% $146.92 29.89% $0.89 7.3% 13
T-T Telus 7.2% $22.65 15.38% $1.64 7.0% 21
TD-T TD Bank 4.1% $102.35 33.79% $4.20 2.9% 14
TFII-N TFI International 2.0% $90.67 -31.63% $1.80 12.5% 14
TIH-T Toromont Industries 1.5% $142.07 25.61% $2.08 8.3% 35
TRI-Q Thomson Reuters 1.4% $171.32 5.51% $2.38 10.2% 31
TRP-T TC Energy Corp. 4.8% $70.56 3.43% $3.40 3.3% 24
WCN-N Waste Connections 0.7% $184.77 8.75% $1.26 7.7% 15
Averages 3.1% 9.7% 6.9% 21

Note: Stocks ending in “-N or -Q” declare earnings and dividends in US dollars. To achieve currency consistency between dividends and share price for these stocks, we have shown dividends in US dollars and share price in US dollars (these stocks are listed on a US exchange). The dividends for their Canadian counterparts (-T) would be converted into CDN dollars and would fluctuate with the exchange rate.

PAID subscribers enjoy full access to our enhanced weekly newsletter, premium content, and easy-to-follow trade alerts so they can build DGI portfolios alongside ours. This service provides the resources to develop your DGI business plan confidently. We do the work; you stay in control!

It truly is the subscription that pays dividends!

The greatest investment you can make is in yourself. Are you ready to take that step? 

For more articles and the full newsletter, check us out on magicpants.substack.com.

MP Market Review – August 8, 2025

Last updated by BM on August 12, 2025

Summary


Welcome to this week’s MP Market Review – your go-to source for insights and updates on the Canadian dividend growth companies we track on The List! While we’ve expanded our watchlists to include U.S. companies The List-USA, our Canadian lineup remains the cornerstone of our coaching approach.

Don’t miss out on exclusive newsletters and premium content that will help you sharpen your investing strategy. Explore it all at magicpants.substack.com.

Your journey to dividend growth mastery starts here – let’s dive in!

  • Last week, dividend growth of The List stayed the same with an average return of +6.9% YTD (income).
  • Last week, the price of The List was up from the previous week with an average return of +8.8% YTD (capital).
  • Last week, there were no dividend announcements from companies on The List.
  • Last week, there were seven earnings reports from companies on The List.
  • This week, four companies from The List will report on earnings.

DGI Clipboard


“Usually, a very long list of securities is not a sign of a brilliant investor but one who is not sure of himself.”

– Philip Fisher

The All-Canadian DGI Portfolio
Intro


One question from subscribers has come up more than almost any others:

“How would you invest right now if you were starting from scratch?”

Our dividend growth investing strategy produces such predictable returns that simply buying the highest-quality companies from The List and holding them long term has historically been a winning formula. I’ve called this the “No-Look DGI Portfolio” in past writings.

In light of today’s macro environment, I’m making a few tweaks. The portfolio will shrink from twenty to thirteen stocks, and instead of equal weighting, each position will follow our recommended size based on current valuation.

All companies in this updated portfolio have at least twenty consecutive years of dividend growth, with a few exceptions worth noting. TD Bank and Royal Bank of Canada were forced to pause dividend increases in 2010 during the financial crisis by the federal government, so we are making the assumption that their long-term dividend growth records would have remained intact. Franco-Nevada is the only stock without a two-decade streak, included here because it’s one of my highest-conviction ideas for today’s market. Finally, a few names have been removed from the original No-Look DGI Portfolio due to weaker growth prospects in the current environment.

Here are the ten-year historical performance metrics for our new All-Canadian DGI Portfolio:

A couple of observations stand out immediately. First, the portfolio delivered an annualized total return of 12.5% from January 1, 2015, to December 31, 2024, compared with 8.65% for the TSX Composite Index. That’s an outperformance of more than 40%. I was unable to find a Canadian Dividend ETF or an actively managed Canadian dividend fund that performed better. If you locate one, please send it along.

Second, annualized dividend growth and price growth are remarkably aligned at 8.6% and 8.2% respectively, reinforcing our belief that as dividends grow, so does price.

Finally, the All Canadian DGI Portfolio’s price-only return is keeping pace with the TSX Composite again this year, up 12.2% as of last Friday. Dividend growth is also strong at 7% year-to-date. These are mature companies with decades of history, yet they continue to raise dividends and deliver above-average returns even today.

Takeaway


Later this week, I’ll share the valuation-weighted All-Canadian DGI Portfolio (exclusive to paid subscribers), complete with position sizing columns. With that information, you have the option to invest equally in each company as in the No-Look DGI Portfolio or apply our position sizing strategy to fine-tune your allocations based on today’s valuation.

Become a paid partner, and I’ll show you exactly how I do it. With real money. In real stocks. In addition, gain full access to this post and exclusive, subscriber-only content. We do the work; you stay in control. Subscribe today and take your dividend growth investing to the next level!

DGI Scorecard

 
The List (2025)


The Magic Pants 2025 list includes 29 Canadian dividend growth stocks. Here are the criteria to be considered a candidate on ‘The List’:

  1. Dividend growth streak: 10 years or more.
  2. Market cap: Minimum one billion dollars.
  3. Diversification: Limit of five companies per sector, preferably two per industry.
  4. Cyclicality: Exclude REITs and pure-play energy companies due to high cyclicality.

Based on these criteria, companies are added or removed from ‘The List’ annually on January 1. Prices and dividends are updated weekly.

‘The List’ is not a portfolio but a coaching tool that helps us think about ideas and risk manage our model portfolio. We own some but not all the companies on ‘The List’. In other words, we might want to buy these companies when valuation looks attractive.

Our newsletter provides readers with a comprehensive insight into the implementation and advantages of our Canadian dividend growth investing strategy. This evidence-based, unbiased approach empowers DIY investors to outperform both actively managed dividend funds and passively managed indexes and dividend ETFs over longer-term horizons.

Performance of ‘The List’


Last week, dividend growth stayed the same, with an average return of +6.9% YTD (income).

The price of ‘The List’ was up from the previous week, with an average YTD return of +8.8% (capital).

Even though prices may fluctuate, the dependable growth in our income does not. Stay the course. You will be happy you did.

Last week’s best performers on ‘The List’ were goeasy Ltd. (GSY-T), up +10.66%.; Franco Nevada (FNV-N), up +6.13%; and Emera (EMA-T) up +3.74%.

Canadian Tire (CTC-A-T) was the worst performer last week, down -13.22%.

SYMBOL COMPANY YLD PRICE YTD % DIV YTD % STREAK
ATD-T Alimentation Couche-Tard Inc. 1.1% $69.99 -11.46% $0.78 8.3% 15
BCE-T Bell Canada 8.6% $33.51 -0.03% $2.87 -28.1% 16
BIP-N Brookfield Infrastructure Partners 5.7% $30.10 -5.52% $1.72 6.2% 17
CCL-B-T CCL Industries Inc. 1.6% $78.51 6.64% $1.28 10.3% 23
CNR-T Canadian National Railway 2.8% $127.33 -13.25% $3.55 5.0% 29
CTC-A-T Canadian Tire 4.4% $159.70 3.90% $7.10 1.4% 14
CU-T Canadian Utilities Limited 4.8% $38.13 9.63% $1.83 1.0% 53
DOL-T Dollarama Inc. 0.2% $190.62 35.96% $0.41 18.1% 14
EMA-T Emera 4.3% $66.91 25.00% $2.90 0.7% 18
ENB-T Enbridge Inc. 5.8% $64.69 4.56% $3.77 3.0% 29
ENGH-T Enghouse Systems Limited 5.1% $22.54 -16.70% $1.16 16.0% 18
FNV-N Franco Nevada 0.9% $171.59 41.66% $1.52 5.6% 17
FTS-T Fortis Inc. 3.5% $69.91 17.26% $2.46 3.1% 51
GSY-T goeasy Ltd. 2.9% $200.63 20.02% $5.84 24.8% 10
IFC-T Intact Financial 1.9% $279.00 6.10% $5.32 9.9% 20
L-T Loblaw Companies Limited 1.0% $228.07 19.90% $2.21 15.2% 13
MFC-T Manulife Financial 4.3% $41.41 -5.76% $1.76 10.0% 11
MGA-N Magna 4.6% $42.47 1.75% $1.94 2.1% 15
MRU-T Metro Inc. 1.4% $104.95 16.39% $1.48 10.4% 30
RY-T Royal Bank of Canada 3.3% $182.37 5.86% $6.04 7.9% 14
SJ-T Stella-Jones Inc. 1.6% $77.77 6.55% $1.24 10.7% 20
STN-T Stantec Inc. 0.6% $150.74 33.27% $0.89 7.3% 13
T-T Telus 7.4% $22.10 12.58% $1.64 7.0% 21
TD-T TD Bank 4.2% $100.76 31.71% $4.20 2.9% 14
TFII-N TFI International 2.1% $86.17 -35.02% $1.80 12.5% 14
TIH-T Toromont Industries 1.5% $140.86 24.54% $2.08 8.3% 35
TRI-Q Thomson Reuters 1.3% $179.96 10.83% $2.38 10.2% 31
TRP-T TC Energy Corp. 5.0% $67.97 -0.37% $3.40 3.3% 24
WCN-N Waste Connections 0.7% $187.89 10.58% $1.26 7.7% 15
Averages 3.2% 8.8% 6.9% 21

Note: Stocks ending in “-N or -Q” declare earnings and dividends in US dollars. To achieve currency consistency between dividends and share price for these stocks, we have shown dividends in US dollars and share price in US dollars (these stocks are listed on a US exchange). The dividends for their Canadian counterparts (-T) would be converted into CDN dollars and would fluctuate with the exchange rate.

PAID subscribers enjoy full access to our enhanced weekly newsletter, premium content, and easy-to-follow trade alerts so they can build DGI portfolios alongside ours. This service provides the resources to develop your DGI business plan confidently. We do the work; you stay in control!

It truly is the subscription that pays dividends!

The greatest investment you can make is in yourself. Are you ready to take that step? 

For more articles and the full newsletter, check us out on magicpants.substack.com.

MP Market Review – August 1, 2025

Last updated by BM on August 5, 2025

Summary


Welcome to this week’s MP Market Review – your go-to source for insights and updates on the Canadian dividend growth companies we track on The List! While we’ve expanded our watchlists to include U.S. companies The List-USA, our Canadian lineup remains the cornerstone of our coaching approach.

Don’t miss out on exclusive newsletters and premium content that will help you sharpen your investing strategy. Explore it all at magicpants.substack.com.

Your journey to dividend growth mastery starts here – let’s dive in!

  • Last week, dividend growth of The List stayed the same with an average return of +6.9% YTD (income).
  • Last week, the price of The List was down from the previous week with an average return of +8.5% YTD (capital).
  • Last week, there were no dividend announcements from companies on The List.
  • Last week, there were ten earnings reports from companies on The List.
  • This week, seven companies from The List will report on earnings.

DGI Clipboard


“My life has been a product of compound interest. Nothing more. Nothing less. And nothing brilliant.”

 – Warren Buffett

Don’t try to time the market. Let your cash compound instead.
Intro


The first step in managing anything well is setting a clear goal. The second step is tracking your progress toward that goal. Most investors rely on annualized returns and benchmark comparisons to evaluate their performance. But beyond these basics, there is little consistency in how investors measure success.

Dividend growth investors track a different metric: Yield on Cost (YOC). This is calculated by taking the annual dividend income, dividing it by the original purchase price, and multiplying by 100. We refer to this as Growth Yield because it captures the essence of what makes dividend growth investing so powerful: growth over time.

Growth yield measures not just dividend yield but dividend growth as well. It reflects the impact of both the starting yield and the compounding effect of rising dividends. That is why some low-yielding stocks at the time of purchase can end up delivering far more income than higher-yielding alternatives, simply because they grow faster.

If your goal as a dividend growth investor is to build a rising stream of income, growth yield is one of the most effective ways to track your success.

You can see the power of compounding clearly in the example below. Using last Friday’s closing prices, the average starting yield of the companies on The List is 3.2 percent. So far this year, the average dividend growth has been 6.9 percent. If you invested $10,000 across all stocks on the watchlist, here is what the income would look like over time:

  • With dividend reinvestment (DRIP), your annual income would grow to $848
  • Without DRIP, it would still grow to $583, just from dividends alone

That is before any capital appreciation is included.

Thanks to dividend growth, our initial 3.2 percent yield has risen to 5.8 percent. With reinvested dividends contributing an additional 2.6 percent, the total income yield reaches 8.5 percent. This is the compounding effect in action: steady, powerful, and predictable for those who stay the course.

Takeaway


If the objective of a dividend growth investor is to invest in securities with increasing income over time, the best metric to measure your success in achieving this objective is our growth yield metric, formerly known as yield on cost.

Become a paid partner, and I’ll show you exactly how I do it. With real money. In real stocks. In addition, gain full access to this post and exclusive, subscriber-only content. We do the work; you stay in control. Subscribe today and take your dividend growth investing to the next level!

DGI Scorecard

 
The List (2025)


The Magic Pants 2025 list includes 29 Canadian dividend growth stocks. Here are the criteria to be considered a candidate on ‘The List’:

  1. Dividend growth streak: 10 years or more.
  2. Market cap: Minimum one billion dollars.
  3. Diversification: Limit of five companies per sector, preferably two per industry.
  4. Cyclicality: Exclude REITs and pure-play energy companies due to high cyclicality.

Based on these criteria, companies are added or removed from ‘The List’ annually on January 1. Prices and dividends are updated weekly.

‘The List’ is not a portfolio but a coaching tool that helps us think about ideas and risk manage our model portfolio. We own some but not all the companies on ‘The List’. In other words, we might want to buy these companies when valuation looks attractive.

Our newsletter provides readers with a comprehensive insight into the implementation and advantages of our Canadian dividend growth investing strategy. This evidence-based, unbiased approach empowers DIY investors to outperform both actively managed dividend funds and passively managed indexes and dividend ETFs over longer-term horizons.

Performance of ‘The List’


Last week, dividend growth stayed the same, with an average return of +6.9% YTD (income).

The price of ‘The List’ was down from the previous week, with an average YTD return of +8.5% (capital).

Even though prices may fluctuate, the dependable growth in our income does not. Stay the course. You will be happy you did.

Last week’s best performers on ‘The List’ were Toromont Industries (TIH-T), up +5.35%.; Enbridge Inc. (ENB-T), up +3.34%; and TC Energy Corp. (TRP-T) up +3.12%.

TFI International (TFII-N) was the worst performer last week, down -9.01%.

SYMBOL COMPANY YLD PRICE YTD % DIV YTD % STREAK
ATD-T Alimentation Couche-Tard Inc. 1.1% $70.18 -11.22% $0.78 8.3% 15
BCE-T Bell Canada 8.8% $32.53 -2.95% $2.87 -28.1% 16
BIP-N Brookfield Infrastructure Partners 5.5% $31.14 -2.26% $1.72 6.2% 17
CCL-B-T CCL Industries Inc. 1.7% $76.16 3.45% $1.28 10.3% 23
CNR-T Canadian National Railway 2.8% $128.04 -12.77% $3.55 5.0% 29
CTC-A-T Canadian Tire 3.9% $184.03 19.73% $7.10 1.4% 14
CU-T Canadian Utilities Limited 4.7% $38.73 11.36% $1.83 1.0% 53
DOL-T Dollarama Inc. 0.2% $189.67 35.29% $0.41 18.1% 14
EMA-T Emera 4.5% $64.50 20.49% $2.90 0.7% 18
ENB-T Enbridge Inc. 5.9% $63.73 3.01% $3.77 3.0% 29
ENGH-T Enghouse Systems Limited 5.1% $22.75 -15.93% $1.16 16.0% 18
FNV-N Franco Nevada 0.9% $161.68 33.48% $1.52 5.6% 17
FTS-T Fortis Inc. 3.6% $68.79 15.38% $2.46 3.1% 51
GSY-T goeasy Ltd. 3.2% $181.31 8.46% $5.84 24.8% 10
IFC-T Intact Financial 1.9% $283.07 7.64% $5.32 9.9% 20
L-T Loblaw Companies Limited 1.0% $223.56 17.53% $2.21 15.2% 13
MFC-T Manulife Financial 4.2% $42.02 -4.37% $1.76 10.0% 11
MGA-N Magna 4.7% $41.32 -1.01% $1.94 2.1% 15
MRU-T Metro Inc. 1.4% $105.38 16.87% $1.48 10.4% 30
RY-T Royal Bank of Canada 3.4% $177.48 3.02% $6.04 7.9% 14
SJ-T Stella-Jones Inc. 1.6% $78.81 7.97% $1.24 10.7% 20
STN-T Stantec Inc. 0.6% $149.91 32.53% $0.89 7.3% 13
T-T Telus 7.6% $21.54 9.73% $1.64 7.0% 21
TD-T TD Bank 4.2% $100.09 30.84% $4.20 2.9% 14
TFII-N TFI International 2.1% $85.15 -35.79% $1.80 12.5% 14
TIH-T Toromont Industries 1.5% $140.49 24.22% $2.08 8.3% 35
TRI-Q Thomson Reuters 1.2% $201.08 23.83% $2.38 10.2% 31
TRP-T TC Energy Corp. 5.1% $66.76 -2.14% $3.40 3.3% 24
WCN-N Waste Connections 0.7% $186.57 9.81% $1.26 7.7% 15
Averages 3.2% 8.5% 6.9% 21

Note: Stocks ending in “-N or -Q” declare earnings and dividends in US dollars. To achieve currency consistency between dividends and share price for these stocks, we have shown dividends in US dollars and share price in US dollars (these stocks are listed on a US exchange). The dividends for their Canadian counterparts (-T) would be converted into CDN dollars and would fluctuate with the exchange rate.

PAID subscribers enjoy full access to our enhanced weekly newsletter, premium content, and easy-to-follow trade alerts so they can build DGI portfolios alongside ours. This service provides the resources to develop your DGI business plan confidently. We do the work; you stay in control!

It truly is the subscription that pays dividends!

The greatest investment you can make is in yourself. Are you ready to take that step? 

For more articles and the full newsletter, check us out on magicpants.substack.com.
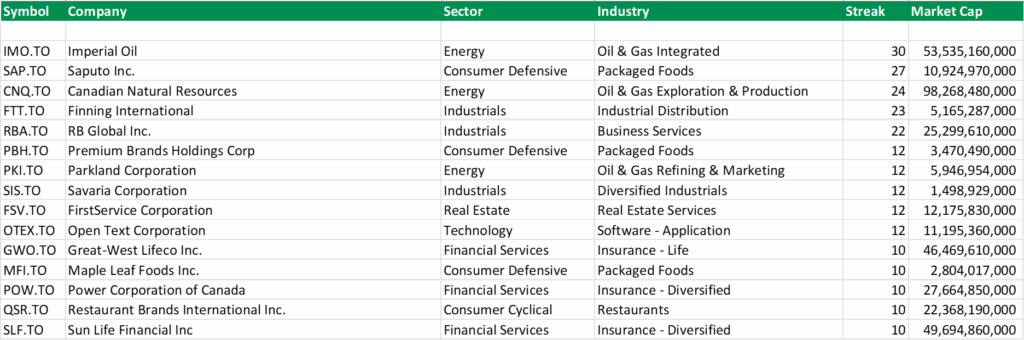
I’ll coach you on how to identify high-quality individual dividend growth stocks when they are sensibly priced, and hold them for the growing income.