“You have a pair of pants. In the left pocket, you have $100. You take $1 out of the left pocket and put in the right pocket. You now have $101. There is no diminution of dollars in your left pocket. That is one magic pair of pants.”

Category: MP Market Reviews

MP Market Review – January 06, 2023

Last updated by BM on January 09, 2023

Summary

  • This article is part of our weekly series (MP Market Review) highlighting the performance and activity from the previous week related to the financial markets and Canadian dividend growth companies we follow on ‘The List’.
  • ‘The List’ ends 2022 with a negative -6.0% price return (capital) and positive +10.6% dividend growth (income). See summary below. We started a new list last week for 2023. We decided to keep ‘The List’ the same for 2023 as all companies increased their dividend again last year.
  • Last week, ‘The List’ began the year with a positive +2.1% YTD price return (capital). The dividend growth of ‘The List’ is off to a fast start at +4.6% YTD, demonstrating the rise in income over the last year.   
  • Last week, there were no dividend increases from companies on ‘The List’.
  • Last week, there were no earnings reports from companies on ‘The List’.
  • No companies on ‘The List’ are due to report earnings this week.
  • Are you looking to build an income portfolio of your own? When you become a premium subscriber, you get exclusive access to the MP Wealth-Builder Model Portfolio (CDN) and subscriber-only content. Start building real wealth today!  Learn More

“Learn to eventually and mentally manage price declines as your dividend grows.”

Happy New Year!  It is that time of year when we reflect on our dividend growth strategy and how it fared in the worst stock market decline since 2008.

We can only imagine the amount of wealth destruction that took place for a lot of people last year. Fortunately, we discovered dividend growth investing after the last major market decline in 2008 and vowed we would not let that happen again. This 2022 summary of ‘The List’ will help demonstrate that even the most passive dividend growth investing strategy can safeguard your capital and provide you with a growing income stream.

At market close on the first trading day of the new year, we publish ‘The List’ of Canadian dividend growth stocks we will follow that year. The companies selected are from various industries, usually no more than four from one industry. We stay away from REITs and pure-play energy companies due to their cyclical nature. Next, we look for ten years of consecutive dividend growth and over one billion market cap. We hold the stocks for the entire year with weekly updates on their performance and insights throughout the year into how the company aligns, or not, as a candidate for your dividend growth portfolio.

Here is a copy of ‘The List’ and its year-to-date (YTD) performance on the last trading day of December 2022.

In 2022, ‘The List’ had an average price return of -6.0% and an average dividend growth rate of +10.6%. These metrics assume investment in an equal amount of shares in all the companies on ‘The List’ at the close of the first trading day of 2022.

To put these metrics in perspective, let’s look at how a few of the most popular market indexes did last year.

As you can see, there were negative price returns across the board from all the major North American indexes. ‘The List’ of Canadian dividend growth stocks we follow did a better job protecting our capital than all four main indexes. Not all indexes contain dividend growth stocks, so we could not compare the income generated. We can, however, safely assume that ‘The List,’ with its generous starting yield last year of 2.7% and dividend growth of +10.6%, was a clear winner on income production as well.

So how did a pseudo dividend growth portfolio like the ‘The List’ protect you from a year like 2022?  By its nature, dividend growth investing forces investors into higher-quality names. After all, for a company’s management to commit to a dividend payout policy, the company needs to generate cash to pay the dividends. As it turns out, high-quality companies are more likely to be profitable and generate cash to pay dividends consistently.

Although it is early, our Magic Pants Wealth-Builder Model Portfolio (CDN) did even better, ending 2022 in positive territory for both price and income returns after its inception in May 2022. This portfolio lets paid subscribers ‘look over our shoulder’ as we build a powerful dividend growth portfolio from scratch. Learn More

As dividend growth investors, we have come to realize that we can’t control economic cycles (markets), but we can control our income. Knowing that, we don’t focus as much on the value of our portfolios in the short-term, only on how much our income is growing. In time, a rising dividend income stream will eventually lead to rising stock prices.

Is 2023 the year you finally learn to mentally manage price declines as your dividend grows?

Note: The companies on ‘The List’ are only a starting point when you decide to build your portfolio. Buying all your stocks in one day, regardless of valuation, is not the approach we discuss in the blog. To learn more about our process and how we build powerful dividend growth portfolios that have easily outperformed all Canadian Dividend ETFs and Mutual Funds for over a decade, click here.

Performance of ‘The List’

At the end of the post is a snapshot of ‘The List’ from last Friday’s close. Feel free to click on the ‘The List’ menu item above for a sortable version.

Last week, ‘The List’ began the year with a positive +2.1% YTD price return (capital). The dividend growth of ‘The List’ is off to a fast start at +4.6% YTD, demonstrating the rise in income over the last year.

The best performers last week on ‘The List’ were Algonquin Power & Utilities (AQN-N), up +10.28%; Magna (MGA-N), up +9.65%; and Canadian Tire (CTC-A-T), up +6.84%.

TD Bank (TD-T) was the worst performer last week, down -1.48%.

Recent News

Why is Algonquin Power rallying? Any news on the dividend is good news (Globe & Mail)

https://www.theglobeandmail.com/investing/markets/inside-the-market/article-why-is-algonquin-power-rallying-any-news-on-the-dividend-is-good-news/

Hands down the worst performer on ‘The List’ last year, Algonquin Power (AQN-N) now yields close to 10%. Investors will know more next week about how the company plans to deal with its dividend. Pay close attention to this one as dividend reductions or cuts are normally not met with enthusiasm by investors.

(AQN-N) got itself in trouble last year when rising rates affected its borrowing costs.

Dividend Increases

Last week, there were no dividend increases from companies on ‘The List’.

Earnings Releases

No companies on ‘The List’ are due to report earnings this week.

Last week, there were no earnings reports from companies on ‘The List’.


Below is a snapshot of ‘The List’ from last Friday’s close. For a sortable version of ‘The List’, please click on The List menu item.

‘The List’ is not intended to be a portfolio others replicate. Rather, its purpose is to provide investment ideas and a real-time illustration of dividend growth investing in action. It is not a ‘Buy List’ nor reflects the composition or returns of our Magic Pants Wealth-Builder (CDN) Portfolios. It is only a starting point for our analysis and discussion of dividend growth investing concepts.


The List (2023)
Last updated by BM on January 06, 2023

*Note: The following graph is wide, you can scroll to the right on your device to see more of the data.

SYMBOL COMPANY YLD PRICE YTD % DIV YTD % STREAK
AQN-N Algonquin Power & Utilities 10.1% $7.19 6.8% $0.72 2.9% 12
ATD-T Alimentation Couche-Tard Inc. 0.9% $61.87 2.9% $0.56 19.1% 13
BCE-T Bell Canada 6.0% $61.62 2.3% $3.68 1.1% 14
BIP-N Brookfield Infrastructure Partners 4.4% $32.95 5.2% $1.44 0.0% 15
CCL-B-T CCL Industries 1.6% $59.22 2.0% $0.96 0.0% 21
CNR-T Canadian National Railway 1.8% $164.44 1.0% $2.93 0.0% 27
CTC-A-T Canadian Tire 4.6% $151.18 3.1% $6.90 17.9% 12
CU-T Canadian Utilities Limited 4.8% $36.98 0.1% $1.78 0.0% 51
DOL-T Dollarama Inc. 0.3% $82.92 3.8% $0.22 2.3% 12
EMA-T Emera 5.3% $52.32 -0.6% $2.76 3.0% 16
ENB-T Enbridge Inc. 6.5% $54.46 2.1% $3.55 3.2% 27
ENGH-T Enghouse Systems Limited 2.0% $37.01 3.6% $0.74 3.5% 16
FNV-N Franco Nevada 0.9% $139.80 1.2% $1.28 0.0% 15
FTS-T Fortis 4.1% $55.16 -0.3% $2.26 4.1% 49
IFC-T Intact Financial 2.0% $199.81 2.1% $4.00 0.0% 18
L-T Loblaws 1.3% $120.21 -0.1% $1.62 5.2% 11
MGA-N Magna 2.9% $61.60 7.1% $1.80 0.0% 13
MRU-T Metro 1.5% $74.81 -0.9% $1.10 0.0% 28
RY-T Royal Bank of Canada 4.0% $130.43 1.9% $5.28 6.5% 12
SJ-T Stella-Jones Inc. 1.6% $50.17 1.2% $0.80 0.0% 18
STN-T Stantec Inc. 1.1% $66.36 1.6% $0.72 2.1% 11
TD-T TD Bank 4.4% $86.37 -1.5% $3.84 7.9% 12
TFII-N TFI International 1.3% $103.73 3.6% $1.40 29.6% 12
TIH-T Toromont Industries 1.5% $102.14 4.5% $1.56 2.6% 33
TRP-T TC Energy Corp. 6.6% $54.24 1.8% $3.60 0.8% 22
T-T Telus 5.2% $27.02 2.7% $1.40 5.4% 19
WCN-N Waste Connections 0.8% $132.81 0.8% $1.02 7.9% 13
Averages 3.2% 2.1% 4.6% 19

MP Market Review – December 30, 2022

Last updated by BM on January 03, 2022

Summary

  • This article is part of our weekly series (MP Market Review) highlighting the performance and activity from the previous week related to the financial markets and Canadian dividend growth companies we follow on ‘The List’.
  • Last week, ‘The List’ was down slightly with a minus -6.0% YTD price return (capital). The dividend growth of ‘The List’ remains at +10.6% YTD, demonstrating the rise in income over the last year.   
  • Last week, there were no dividend increases from companies on ‘The List’.
  • Last week, there were no earnings reports from a company on ‘The List’.
  • No companies on ‘The List’ are due to report earnings this week.
  • Are you looking to build an income portfolio of your own? When you become a premium subscriber, you get exclusive access to the MP Wealth-Builder Model Portfolio (CDN) and subscriber-only content. Start building real wealth today!  Learn More

 “…for a lot of people, generating a portion of their income from lightly taxed – or even negatively taxed – dividends makes a lot of sense.”

– John Heinzl, (Negative tax on dividends? Yup, really), Globe & Mail

DGI Truth #5: Dividend growth investing is a tax-efficient strategy

One of the first things you discover when you begin working is how much money is taken off your pay cheque each week for income tax purposes. Eventually, you discover that the more you make, the higher tax rate applies (increasing marginal tax rate). It is then that you start to ask questions; “How do I hold onto a larger share of my income?”

For those looking to hold onto a larger share, generating dividend income may be part of the answer. Dividend income is taxed at a lower rate than many other forms of income due to the dividend tax credit (DTC). To avoid ‘double-dipping’ by the CRA and account for the tax the corporation issuing the dividend has already paid, the individual receiving the dividend is then entitled to a federal and provincial dividend tax credit.

Let’s look at an excerpt from the 2019 example published in the Globe & Mail by John Heinzl:

How to earn $52,000 tax free – no offshore account required

You are a resident of Ontario and have saved $1.3 million. You decide to retire and invest the money in a portfolio of dividend-growth stocks yielding an average of 4%. Your portfolio would generate an annual dividend income of $52,000, which we’re assuming is all received in a non-registered account.

When it’s time to file your tax return, the $52,000 would be listed on your tax slip as the ‘actual amount of eligible dividends’. To understand how dividend taxation works, however, we need to look at two other important numbers on your tax slip: the ‘taxable amount of eligible dividends’ and the federal ‘dividend tax credit for eligible dividends’.

The taxable amount of dividends is calculated by multiplying the actual amount by a ‘gross-up’ factor of 1.38 (38% is the basic federal corporate tax rate for Canadian-controlled corporations). This produces taxable dividends of $71,760. The purpose of the ‘gross up’ is to roughly estimate the pre-tax income the company (or, in this case, companies) would have to earn to pay you the dividend.

In our example, applying these DTC rates to the grossed-up dividend of $71,760 produces a federal DTC of $10,778 and a provincial DTC of $7,176. These amounts, combined with a federal tax credit of $1,810 (15% of the basic personal amount of $12,069), reduce your taxes to zero.

The reason is that before any credits, $71,760 of income would attract a tax of $16,858 but because you receive more than that in tax credits, you pay no tax on the dividend income.

Due to how the dividend tax credit functions, individuals with lower marginal tax rates receive a comparatively bigger benefit from earning income through dividends than individuals with higher marginal tax rates, but both will benefit from the dividend tax credit.

Will 2023 be the year you consider adding tax-efficient dividend income to your income mix?

Note: It is always a good idea to consult a tax professional to determine the most tax-efficient strategies for your specific situation.

Performance of ‘The List’

At the end of the post is a snapshot of ‘The List’ from last Friday’s close. Feel free to click on the ‘The List’ menu item above for a sortable version.

Last week, ‘The List’ was down slightly with a minus -6.0% YTD price return (capital). The dividend growth of ‘The List’ remains at +10.6% YTD, demonstrating the rise in income over the last year.

The best performers last week on ‘The List’ were Enghouse Systems Limited (ENGH-T), up +3.18%; Stella-Jones Inc. (SJ-T), up +1.36%; and Magna (MGA-N), up +1.32%.

Algonquin Power & Utilities (AQN-N) was the worst performer last week, down -3.55%.

Recent News

First Quantum receives final contract for disputed mine, Panama says (Globe & Mail)

https://www.theglobeandmail.com/business/article-panama-first-quantum-final-contract-mine/

What is going on in Panama has caught our attention on several fronts. First, there is the fact that there are geopolitical risks sometimes when you invest in companies. Always pay attention to where companies do business, as this can affect the safety of their earnings and, ultimately, their ability to pay growing dividends.

Secondly, one of the companies on ‘The List’, Franco Nevada (FNV-N), has a large royalty stream with the mine in question owned by First Quantum; Cobre Panama.

The dispute centres around the government of Panama asking for increased payments from First Quantum to continue mining.

If First Quantum agrees to the payment with the Panama government, its stock and earnings will take a hit, but the royalty stream to Franco Nevada will remain unchanged. This is why we prefer royalty companies over miners.

Dividend Increases

Last week, there were no dividend increases from companies on ‘The List’.

Earnings Releases

No companies on ‘The List’ are due to report earnings this week.

Last week, there were no earnings reports from companies on ‘The List’.


Below is a snapshot of ‘The List’ from last Friday’s close. For a sortable version of ‘The List’, please click on The List menu item.

‘The List’ is not intended to be a portfolio others replicate. Rather, its purpose is to provide investment ideas and a real-time illustration of dividend growth investing in action. It is not a ‘Buy List’ nor reflects the composition or returns of our Magic Pants Wealth-Builder (CDN) Portfolios. It is only a starting point for our analysis and discussion of dividend growth investing concepts.

The List (2022)
Last updated by BM on December 30, 2022

*Note: The following graph is wide, you can scroll to the right on your device to see more of the data.

SYMBOL COMPANY YLD PRICE YTD % DIV YTD % STREAK
AQN-N Algonquin Power & Utilities 10.8% $6.52 -54.6% $0.70 5.4% 11
ATD-T Alimentation Couche-Tard Inc. 0.8% $59.50 14.2% $0.47 26.2% 12
BCE-T Bell Canada 6.1% $59.49 -9.7% $3.64 4.0% 13
BIP-N Brookfield Infrastructure Partners 4.6% $30.99 -23.9% $1.44 5.9% 14
CCL-B-T CCL Industries 1.7% $57.84 -14.7% $0.96 14.3% 20
CNR-T Canadian National Railway 1.8% $160.84 3.8% $2.93 19.1% 26
CTC-A-T Canadian Tire 4.1% $141.50 -22.8% $5.85 21.1% 11
CU-T Canadian Utilities Limited 4.8% $36.65 0.1% $1.78 1.0% 50
DOL-T Dollarama Inc. 0.3% $79.19 24.9% $0.22 9.2% 11
EMA-T Emera 5.2% $51.75 -17.3% $2.68 4.1% 15
ENB-T Enbridge Inc. 6.5% $52.92 6.8% $3.44 3.0% 26
ENGH-T Enghouse Systems Limited 2.0% $35.97 -21.6% $0.72 16.3% 15
FNV-N Franco Nevada 0.9% $136.48 0.3% $1.28 10.3% 14
FTS-T Fortis 4.0% $54.18 -10.4% $2.17 4.3% 48
IFC-T Intact Financial 2.1% $194.91 19.1% $4.00 17.6% 17
L-T Loblaws 1.3% $119.72 16.5% $1.54 12.4% 10
MGA-N Magna 3.2% $56.18 -31.1% $1.80 4.7% 12
MRU-T Metro 1.5% $74.97 11.8% $1.10 12.2% 27
RY-T Royal Bank of Canada 3.9% $127.30 -7.0% $4.96 14.8% 11
SJ-T Stella-Jones Inc. 1.6% $48.52 19.3% $0.80 11.1% 17
STN-T Stantec Inc. 1.1% $64.88 -7.6% $0.71 6.8% 10
TD-T TD Bank 4.1% $87.67 -11.8% $3.56 12.7% 11
TFII-N TFI International 1.1% $100.24 -9.5% $1.08 12.5% 11
TIH-T Toromont Industries 1.6% $97.71 -14.1% $1.52 15.2% 32
TRP-T TC Energy Corp. 6.6% $53.98 -9.6% $3.57 4.4% 21
T-T Telus 5.1% $26.13 -12.2% $1.33 6.2% 18
WCN-N Waste Connections 0.7% $132.56 -1.1% $0.95 11.8% 12
Averages 3.2% -6.0% 10.6% 18

MP Market Review – December 23, 2022

Last updated by BM on December 26, 2022

Summary

  • This article is part of our weekly series (MP Market Review) highlighting the performance and activity from the previous week related to the financial markets and Canadian dividend growth companies we follow on ‘The List’.
  • Last week, ‘The List’ was down slightly with a minus -5.2% YTD price return (capital). Dividend growth of ‘The List’ remains at +10.6% YTD, demonstrating the rise in income over the last year.   
  • Last week, there were no dividend increases from companies on ‘The List’.
  • Last week, there were no earnings reports from a company on ‘The List’.
  • No companies on ‘The List’ are due to report earnings this week.
  • Are you looking to build an income portfolio of your own? When you become a premium subscriber, you get exclusive access to the MP Wealth-Builder Model Portfolio (CDN) and subscriber-only content. Start building real wealth today!  Learn More

“Compounding is mankind’s greatest invention because it allows the reliable, systematic accumulation of wealth.”

– Albert Einstein

DGI Truth #4: The power of compounding with dividend re-investment

Most people are aware of the ‘magic’ (there is that word again) of compound interest; returns balloon over time under the effects of compound interest accumulation. The same effects happen by re-investing your dividends in shares of your quality dividend growers. You not only add to your growing income, but you also add to your capital returns when the stock price goes up because you have more shares than you would have otherwise had.

For those who do not need dividend income to pay the bills or have fun with, dividend re-investment is important. Many of the companies we follow on ‘The List’ offer ‘Dividend Re-Investment Plans’ (DRIPs) that sell you additional shares in amounts equivalent to your dividend distribution at a discount to the current market price. You can automate this in your brokerage account, so there are no fees or trading required.

In the graphics below, let’s look at the same input values (starting principal, dividend yield, dividend/share growth rates, years invested, etc. ) and see the difference that dividend re-investment can mean to your income and portfolio values.

Now let’s change the last variable. Dividend reinvestment (DRIP) is now set to Yes.

By simply reinvesting dividends our portfolio balance, dividend income and yield on cost (growth yield) have all doubled over a twenty-five-year period and are accelerating. We have not made any new contributions except by re-investing the quarterly dividends.

In our Magic Pants portfolios, we believe in dividend re-investment, but we do it a bit differently. We never get caught automatically investing in our quality companies when they are overvalued. We accumulate dividends and re-invest in our quality dividend growers when they are sensibly priced. This approach allows us to supercharge the compounding effect of income and capital returns even more.

Adding dividend re-investment to your dividend growth strategy lets compounding do its magic, and the investor accumulates wealth at a much faster pace.

Performance of ‘The List’

At the end of the post is a snapshot of ‘The List’ from last Friday’s close. Feel free to click on the ‘The List’ menu item above for a sortable version.

Last week, ‘The List’ was down slightly with a minus -5.2% YTD price return (capital). Dividend growth of ‘The List’ remains at +10.6% YTD, demonstrating the rise in income over the last year.

The best performers last week on ‘The List’ were Franco Nevada (FNV-N), up +2.53%; Enbridge Inc. (ENB-T), up +2.19%; and TD Bank (TD-T), up +1.96%.

TFI International (TFII-N) was the worst performer last week, down -3.88%.

Recent News

There are many ways to pick a bank stock. Here’s what worked (and what didn’t) (Globe & Mail)

https://www.theglobeandmail.com/investing/markets/inside-the-market/article-pick-bank-stocks/

Discussed in the article are four strategies.

  • Ignore the stock, buy the dividend: the highest yielders are the best
  • The worst stock is the best stock: buy the stock that had the worst record last year
  • The lowest valuation shines brightest: cheap is good
  • Just buy them all: invest in an ETF of all the bank stocks

Notice that most of the advice is about the short term and how to maximize returns next year. This is typical of the advice you find in the investment news today.

Having a longer-term investment horizon, investing in only the highest quality companies in a given sector/industry and then only purchasing them when they are sensibly priced continues to outperform any strategy we have found.

Dividend Increases

Last week, there were no dividend increases from companies on ‘The List’.

Earnings Releases

No companies on ‘The List’ are due to report earnings this week.

Last week, there were no earnings reports from companies on ‘The List’.


Below is a snapshot of ‘The List’ from last Friday’s close. For a sortable version of ‘The List’, please click on The List menu item.

‘The List’ is not intended to be a portfolio others replicate. Rather, its purpose is to provide investment ideas and a real-time illustration of dividend growth investing in action. It is not a ‘Buy List’ nor reflects the composition or returns of our Magic Pants Wealth-Builder (CDN) Portfolios. It is only a starting point for our analysis and discussion of dividend growth investing concepts.


The List (2022)
Last updated by BM on December 23, 2022

*Note: The following graph is wide, you can scroll to the right on your device to see more of the data.

SYMBOL COMPANY YLD PRICE YTD % DIV YTD % STREAK
AQN-N Algonquin Power & Utilities 10.4% $6.76 -52.9% $0.70 5.4% 11
ATD-T Alimentation Couche-Tard Inc. 0.8% $59.73 14.6% $0.47 26.2% 12
BCE-T Bell Canada 6.1% $60.02 -8.9% $3.64 4.0% 13
BIP-N Brookfield Infrastructure Partners 4.6% $31.33 -23.1% $1.44 5.9% 14
CCL-B-T CCL Industries 1.6% $58.36 -13.9% $0.96 14.3% 20
CNR-T Canadian National Railway 1.8% $163.69 5.7% $2.93 19.1% 26
CTC-A-T Canadian Tire 4.1% $142.19 -22.4% $5.85 21.1% 11
CU-T Canadian Utilities Limited 4.8% $37.07 1.3% $1.78 1.0% 50
DOL-T Dollarama Inc. 0.3% $80.00 26.2% $0.22 9.2% 11
EMA-T Emera 5.1% $52.33 -16.4% $2.68 4.1% 15
ENB-T Enbridge Inc. 6.4% $53.69 8.4% $3.44 3.0% 26
ENGH-T Enghouse Systems Limited 2.1% $34.86 -24.0% $0.72 16.3% 15
FNV-N Franco Nevada 0.9% $135.85 -0.2% $1.28 10.3% 14
FTS-T Fortis 3.9% $55.09 -8.9% $2.17 4.3% 48
IFC-T Intact Financial 2.0% $198.38 21.2% $4.00 17.6% 17
L-T Loblaws 1.2% $123.66 20.4% $1.54 12.4% 10
MGA-N Magna 3.2% $55.45 -32.0% $1.80 4.7% 12
MRU-T Metro 1.4% $76.50 14.1% $1.10 12.2% 27
RY-T Royal Bank of Canada 3.9% $128.28 -6.3% $4.96 14.8% 11
SJ-T Stella-Jones Inc. 1.7% $47.87 17.7% $0.80 11.1% 17
STN-T Stantec Inc. 1.1% $64.04 -8.8% $0.71 6.8% 10
TD-T TD Bank 4.0% $88.33 -11.1% $3.56 12.7% 11
TFII-N TFI International 1.1% $101.44 -8.4% $1.08 12.5% 11
TIH-T Toromont Industries 1.6% $97.45 -14.3% $1.52 15.2% 32
TRP-T TC Energy Corp. 6.4% $55.35 -7.3% $3.57 4.4% 21
T-T Telus 5.0% $26.74 -10.1% $1.33 6.2% 18
WCN-N Waste Connections 0.7% $133.37 -0.5% $0.95 11.8% 12
Averages 3.2% -5.2% 10.6% 18

MP Market Review – December 16, 2022

Last updated by BM on December 19, 2022

Summary

  • This article is part of our weekly series (MP Market Review) highlighting the performance and activity from the previous week related to the financial markets and Canadian dividend growth companies we follow on ‘The List’.
  • Last week, ‘The List’ was down slightly with a minus -4.5% YTD price return (capital). Dividend growth of ‘The List’ remains at +10.6% YTD, demonstrating the rise in income over the last year.  
  • Last week, there were no dividend increases from companies on ‘The List’.
  • Last week, there was one earnings report from a company on ‘The List’.
  • No companies on ‘The List’ are due to report earnings this week.
  • Are you looking to build an income portfolio of your own? When you become a premium subscriber, you get exclusive access to the MP Wealth-Builder Model Portfolio (CDN) and subscriber-only content. Start building real wealth today!  Learn More

“Cash is not a safe investment; it is not a safe place because it will be taxed by inflation.”

– Ray Dalio

DGI Truth #3: Dividend growth investors enjoy inflation-protected income

With annual inflation rates at or below 2% for most of the last decade, there was not a lot of attention paid to ones purchasing power over time. That has changed, with inflation rates in the mid to high single digits. Many investors are now not keeping pace or are falling behind.

Dividend growth investing keeps pace with inflation in two ways. The most obvious is the growth rate of the dividend. If the dividend grows faster than the inflation rate, your income’s purchasing power is protected. The second way is by investing in a portfolio of dividend growth stocks that have the potential to generate price returns that are higher than the rate of inflation over time.

When the central banks talk about inflation in the news, we can quickly look at our dividend growth YTD% and measure how we are doing.  Last we checked, the inflation rate was between 6-7%, and our sample dividend growth portfolio DIV YTD% was up 10.6% (‘The List’).

It is important to point out, though, that our PRICE YTD% column from ‘The List’ did not keep pace with inflation this year. That can sometimes happen in the short term, but I have yet to see it over longer time horizons.

By focusing on the dividend growth rate every year, we have a metric where we can easily see the effects inflation has on our purchasing power. We know from our other DGI Truths that our capital will soon rise above the inflation rate, even if it is not evident in the short term.

Performance of ‘The List’

At the end of the post is a snapshot of ‘The List’ from last Friday’s close. Feel free to click on the ‘The List’ menu item above for a sortable version.

Last week, ‘The List’ was down slightly with a minus -4.5% YTD price return (capital). Dividend growth of ‘The List’ remains at +10.6% YTD, demonstrating the rise in income over the last year.

The best performers last week on ‘The List’ were Enghouse Systems Limited (ENGH-T), up +8.46%; TFI International (TFII-N), up +1.60%; and Canadian Utilities Limited (CU-T), up +0.40%.

Franco Nevada (FNV-N) was the worst performer last week, down -5.90%.

Recent News

TC Energy’s Keystone rupture is bad news. Here’s why investors aren’t concerned (Globe & Mail)

https://www.theglobeandmail.com/investing/markets/inside-the-market/article-keystone-rupture-tc-energy/

“It was one of the largest oil spills in the United States in more than a decade. But the impact on TC Energy’s share price has been muted, to say the least.”

Although the news is a bit alarming, history has shown that these types of spills have a negligible impact on earnings. Smart investors often use such narratives to buy more (TRP-T) on any sign of price weakness. TC Energy is a quality company in an industry that has many barriers to entry, not to mention a dividend growth streak of 22 years and counting.

Rate hikes could cast long shadow as Bank of Canada approaches pause  (Globe & Mail)

https://www.theglobeandmail.com/business/article-bank-of-canada-interest-rate-hikes-pause/

“Economists at Royal Bank of Canada estimate that the average household will have around $3,000 less in purchasing power next year, after accounting for inflation and higher debt costs. RBC is forecasting a “mild” recession next year as consumers spend less.”

Last week’s weakness in the stock markets came about just after the US Federal Reserve announced another 50 basis point interest rate hike. The Fed Chair, Jerome Powell, also said that the US wasn’t finished and expects further rate hikes in 2023.

Although Canada’s central bank has not been as vocal, we would most likely get hurt by anything the U.S. decides to do. If we don’t raise rates alongside the U.S. we could see our loonie go down and further exacerbate Canadian inflation.

At a minimum, it is more probable than not that growth is likely to slow in 2023, impacting earnings for some of the dividend growers we follow.

Dividend Increases

Last week, there were no dividend increases from companies on ‘The List’.

Earnings Releases

No companies on ‘The List’ are due to report earnings this week.

One company, Enghouse Systems Limited (ENGH-T) released its fourth-quarter 2022 results last week on Wednesday, December 15, 2022, after markets closed.

“We have consistently demonstrated, even during adverse economic conditions, that we can generate positive operating cash flows and augment our cash reserves to be deployed for acquisitions and further investment in our business. We believe that our financial discipline, product approach and commitment to customers, partners and employees will continue to drive long-term shareholder value.”

– Chief Executive Officer, Stephen Sadler

Highlights:

Financial and operational highlights for the three and twelve months ended October 31, 2022, compared to the three and twelve months ended October 31, 2021, are as follows:

  • Revenue achieved was $108.1 and $427.6 million, respectively, compared to revenue of $113.1 and $467.2 million;
  • Results from operating activities was $33.1 and $129.7 million, respectively, compared to $39.1 and $155.2 million;
  • Net income was $36.9 and $94.5 million, respectively, compared to $30.2 and $92.8 million;
  • Adjusted EBITDA was $35.8 and $140.6 million, respectively, compared to $42.1 and $168.5 million while Adjusted EBITDA margins were 33.1% and 32.9%, respectively, compared to 37.2% and 36.1%;
  • Cash flows from operating activities excluding changes in working capital was $37.7 and $145.1 million, respectively, compared to $42.4 and $167.8 million;
  • Cash, cash equivalents and short-term investments were $228.1 million as at October 31, 2022 compared to $198.8 million at the end of the prior year.

Outlook:

COVID-19 continues to have a lessened impact on our business each quarter as it recedes from the public and business conscience. With the exclusion of the comparative negative impact to revenue in the first quarter of 2022, it had minimal impact on how we operated when comparing fiscal 2022 to fiscal 2021. We continue to monitor the ongoing situation with most of our offices returning to a hybrid work environment. We are beginning to see customer-related travel become more common but are focused on this cost to ensure it is generating appropriate revenue relative to the expense.

As we see a growing demand for SaaS solutions, as with all our revenue streams, we are careful to ensure that sales are achieved without sacrificing profitability, particularly as we observe some competitors reducing prices in an effort to retain revenue growth without achieving profitability.

As a result, we are also focused on ensuring our pricing is set appropriately to provide adequate margins. In light of future economic uncertainty, we remain cautiously optimistic and will exercise continued diligence on controlling expenses and take a conservative approach towards committing to new expenses. A large portion of our planning focuses on matching revenues with expenses such that we can continue to invest where outlooks are positive and curtail spending where unforeseen economic events may adversely impact our profitability. As always, we maintain our financial discipline when seeking earnings-accretive acquisitions to grow our revenue and further expand both our product suite and geographic reach, while maintaining our commitment to profitable growth. We will continue to operate our business consistent with our value-for-money philosophy that we believe provides shareholder value in the long term.

See the full Earnings Release here


Below is a snapshot of ‘The List’ from last Friday’s close. For a sortable version of ‘The List’, please click on The List menu item.

‘The List’ is not intended to be a portfolio others replicate. Rather, its purpose is to provide investment ideas and a real-time illustration of dividend growth investing in action. It is not a ‘Buy List’ nor reflects the composition or returns of our Magic Pants Wealth-Builder (CDN) Portfolios. It is only a starting point for our analysis and discussion of dividend growth investing concepts.


The List (2022)
Last updated by BM on December 16, 2022

*Note: The following graph is wide, you can scroll to the right on your device to see more of the data.

SYMBOL COMPANY YLD PRICE YTD % DIV YTD % STREAK
AQN-N Algonquin Power & Utilities 10.2% $6.89 -52.0% $0.70 5.4% 11
ATD-T Alimentation Couche-Tard Inc. 0.8% $61.25 17.6% $0.47 26.2% 12
BCE-T Bell Canada 6.0% $60.39 -8.4% $3.64 4.0% 13
BIP-N Brookfield Infrastructure Partners 4.5% $32.01 -21.4% $1.44 5.9% 14
CCL-B-T CCL Industries 1.6% $59.21 -12.7% $0.96 14.3% 20
CNR-T Canadian National Railway 1.8% $166.46 7.5% $2.93 19.1% 26
CTC-A-T Canadian Tire 4.1% $143.29 -21.8% $5.85 21.1% 11
CU-T Canadian Utilities Limited 4.7% $37.47 2.3% $1.78 1.0% 50
DOL-T Dollarama Inc. 0.3% $81.00 27.7% $0.22 9.2% 11
EMA-T Emera 5.1% $52.54 -16.1% $2.68 4.1% 15
ENB-T Enbridge Inc. 6.5% $52.54 6.1% $3.44 3.0% 26
ENGH-T Enghouse Systems Limited 2.0% $35.00 -23.7% $0.72 16.3% 15
FNV-N Franco Nevada 1.0% $132.50 -2.6% $1.28 10.3% 14
FTS-T Fortis 3.9% $55.06 -9.0% $2.17 4.3% 48
IFC-T Intact Financial 2.0% $198.10 21.0% $4.00 17.6% 17
L-T Loblaws 1.3% $122.14 18.9% $1.54 12.4% 10
MGA-N Magna 3.2% $57.11 -30.0% $1.80 4.7% 12
MRU-T Metro 1.4% $76.69 14.4% $1.10 12.2% 27
RY-T Royal Bank of Canada 3.9% $127.96 -6.5% $4.96 14.8% 11
SJ-T Stella-Jones Inc. 1.7% $47.70 17.3% $0.80 11.1% 17
STN-T Stantec Inc. 1.1% $66.12 -5.8% $0.71 6.8% 10
TD-T TD Bank 4.1% $86.63 -12.8% $3.56 12.7% 11
TFII-N TFI International 1.0% $105.53 -4.7% $1.08 12.5% 11
TIH-T Toromont Industries 1.5% $100.45 -11.6% $1.52 15.2% 32
TRP-T TC Energy Corp. 6.5% $55.17 -7.6% $3.57 4.4% 21
T-T Telus 4.9% $27.03 -9.2% $1.33 6.2% 18
WCN-N Waste Connections 0.7% $134.50 0.3% $0.95 11.8% 12
Averages 3.2% -4.5% 10.6% 18

MP Market Review – December 09, 2022

Last updated by BM on December 12, 2022

Summary

  • This article is part of our weekly series (MP Market Review) highlighting the performance and activity from the previous week related to the financial markets and Canadian dividend growth companies we follow on ‘The List’.
  • Last week, ‘The List’ was down slightly with a minus -2.5% YTD price return (capital). Dividend growth of ‘The List’ remains at +10.6% YTD, demonstrating the rise in income over the last year.  
  • Last week, there were no dividend increases from companies on ‘The List’.
  • Last week, there was one earnings report from a company on ‘The List’.
  • One company on ‘The List’ is due to report earnings this week.
  • Are you looking to build an income portfolio of your own? When you become a premium subscriber, you get exclusive access to the MP Wealth-Builder Model Portfolio (CDN) and subscriber-only content. Start building real wealth today!  Learn More

“What is an investment, anyhow, but a body of capital that produces income. The income may be current income, or it may be prospective income, but it is the magnitude of the income, current or prospective, that determines the value of the capital which produces it.”

– Arnold Bernhard, The Evaluation of Common Stocks

DGI Truth #2: A rising dividend income stream will eventually lead to rising stock prices.

Let’s use real estate investing as an example. If you own a rental property in an area where rents have risen by ten percent annually for the past ten years, and someone approaches you to buy the property, the buyer must factor in future rent increases when deciding on a fair offer price. The property is worth more than its present value because of the relatively predictable rising income stream it produces.

Stocks with a long history of dividend growth offer the same type of value proposition, in that future dividend increases, are expected and will produce a growing stream of income that add value to the underlying company’s worth. Without a dividend and its growth, the future price for a stock becomes more speculative.

Now let’s look at a few examples from ‘The List’ to see if this theory holds true.

A railroad, a grocer and a utility. It doesn’t matter which industry our quality dividend growers are in. When you find one that grows both dividends and price in this manner, you begin to discover the magic of our dividend growth investing strategy.

What makes this sometimes hard to see in stocks is the very turbulent price movements that overwhelm income returns in the short term. Once you move beyond shorter-term cycles, the value of the stocks will be linked to the amount of income they produce for their owners.

Next week: DGI Truth #3: Dividends (income) grow faster than inflation.

Performance of ‘The List’

At the end of the post is a snapshot of ‘The List’ from last Friday’s close. Feel free to click on the ‘The List’ menu item above for a sortable version.

Last week, ‘The List’ was down slightly with a minus -2.5% YTD price return (capital). Dividend growth of ‘The List’ remains at +10.6% YTD, demonstrating the rise in income over the last year.

The best performers last week on ‘The List’ were Loblaws (L-T), up +2.67%; Canadian Utilities Limited (CU-T), up +2.53%; and Enghouse Systems Limited (ENGH-T), up +2.02%.

Magna (MGA-N) was the worst performer last week, down -4.99%

Recent News

The odds of your mutual fund consistently beating the market? Slim to none (Globe & Mail)

https://www.theglobeandmail.com/investing/markets/inside-the-market/article-the-odds-of-your-mutual-fund-consistently-beating-the-market-slim-to/

The article starts by asking and answering the billion-dollar question:

“Out of more than 650 Canadian actively managed equity mutual funds, how many of them were able to maintain superior returns over the last five years? Exactly zero.”

We say billion-dollar question because, for many years, investors’ hard-earned capital has been funneled back to wealth managers in the form of fees for returns that simply track the average of the markets or worse. They seem to know this as well (only one taker on the Buffett Bet in 2008).

There are many reasons for this, but my mentor Tom Connolly put it very succinctly in a recent blog article:

“Most professionals can’t win. Can’t. Notice I said ‘can’t’, not don’t win. Why they can’t is a complicated/interesting tale. It boils down to, and believe this, career risk. Professionals can’t afford to lose alone. They must conform.”

For many investors, this might come as shocking news, but for dividend growth investors, we have known this information for decades. It is precisely why we started researching different strategies over a decade ago and landed on dividend growth investing.

The best and worst provinces to live in for dividend investing (Globe & Mail)

https://www.theglobeandmail.com/investing/markets/inside-the-market/article-rob-carrick-the-best-and-worst-provinces-to-live-in-for-dividend/

It is usually a year into your dividend investing journey before you discover another magical aspect of this strategy; you pay fewer taxes on your dividend income than other forms of income.

We say about a year because you notice this deferred benefit when you file your first tax return as a dividend growth investor. As the author points out, the net impact depends on what province you live in.

Paying less tax than you do on regular and interest income means you will have more of your hard-earned capital to invest in dividend growth stocks, and income compounding continues.

Dividend Increases

Last week, there were no dividend increases from companies on ‘The List’.

Earnings Releases

One company on ‘The List’ is due to report earnings this week.

Enghouse Systems Limited (ENGH-T) will release its fourth-quarter 2022 results on Wednesday, December 15, 2022, after markets close.

Last week, one company on ‘The List’, Dollarama (DOL-T), reported their Q3 Fiscal 2023 earnings. 

Dollarama (DOL-T) follows an off-cycle reporting schedule. Their fiscal year ends on October 31 each year. Their fiscal Q3 earnings are among the first on ‘The List’ to report in Q4 2022. The company released its third-quarter 2023 results on Wednesday, December 7, 2022, before markets opened.

“Our strong performance across our key metrics year to date speaks to our commitment to providing the best year-round value on the everyday products we offer, combined with a convenient and consistent shopping experience. As inflationary pressure on the consumer persists, we expect strong demand for consumable products to continue stimulating topline growth through to the end of the fiscal year. We aim to stay true to our compelling value proposition and to meet and exceed the expectations of our customers from coast to coast.”

– President and Chief Executive Officer, Neil Rossy

Highlights:

  • 8% increase in comparable store sales(1) and 14.8% increase in diluted net earnings per share
  • Fiscal 2023 comparable store sales growth assumption increased to between 9.5% and 10.5% and gross margin guidance narrowed to between 43.1% and 43.6% of sales
  • New long-term store target for Dollarcity increased from 600 to 850 stores by 2029

Fiscal 2023 Third Quarter Highlights Compared to Fiscal 2022 Third Quarter Results

  • Sales increased by 14.9% to $1,289.6 million
  • Comparable store sales increased by 10.8%
  • EBITDA increased by 11.3% to $386.2 million, or 29.9% of sales, compared to 30.9%
  • Operating income increased by 11.5% to $302.7 million, or 23.5% of sales, compared to 24.2%
  • Diluted net earnings per common share increased by 14.8% to $0.70 from $0.61
  • 18 net new stores opened, compared to 16 net new stores
  • 972,847 common shares repurchased for cancellation for $76.3 million

Outlook:

In the fourth quarter of Fiscal 2023, the Corporation expects to continue to benefit from strong demand for its affordable, everyday items in the context of inflation, including stronger than historical demand for lower-margin consumable products. As a result, the Corporation has increased its comparable store sales growth assumption for Fiscal 2023 from a range of 6.5% to 7.5% to the range of 9.5% and 10.5%. Based on gross margin performance to date and management’s visibility on open orders and product margins through the remainder of the fiscal year, the Corporation has narrowed its previously disclosed annual gross margin as a percentage of sales from a range of 42.9% to 43.9% to a range of 43.1% to 43.6%. The remainder of the Corporation’s annual guidance and previously disclosed assumptions on which guidance is based for Fiscal 2023 and issued on March 30, 2022, remain unchanged.

As of this date, the Corporation expects the following for Fiscal 2023:

  • To open 60 to 70 net new stores
  • Gross margin as a percentage of sales of between 43.1% and 43.6%
  • SG&A as a percentage of sales of between 13.8% and 14.3%
  • To deploy $160 million to $170 million in capital expenditures
  • To actively repurchase shares under its normal course issuer bid

See the full Earnings Release here


Below is a snapshot of ‘The List’ from last Friday’s close. For a sortable version of ‘The List’, please click on The List menu item.

‘The List’ is not meant to be a template for investors to copy exactly. Instead, its purpose is to provide investment ideas and a real-time illustration of dividend growth investing in action. It is not a ‘Buy List’ nor does it reflect the composition or returns of our Magic Pants Wealth-Builder (CDN) Portfolio. It is only a starting point for our analysis and discussion.


The List (2022)
Last updated by BM on December 09, 2022

*Note: The following graph is wide, you can scroll to the right on your device to see more of the data.

SYMBOL COMPANY YLD PRICE YTD % DIV YTD % STREAK
AQN-N Algonquin Power & Utilities 9.8% $7.19 -49.9% $0.70 5.4% 11
ATD-T Alimentation Couche-Tard Inc. 0.8% $61.78 18.6% $0.47 26.2% 12
BCE-T Bell Canada 5.7% $63.34 -3.9% $3.64 4.0% 13
BIP-N Brookfield Infrastructure Partners 4.2% $34.68 -14.9% $1.44 5.9% 14
CCL-B-T CCL Industries 1.6% $60.59 -10.6% $0.96 14.3% 20
CNR-T Canadian National Railway 1.7% $170.04 9.8% $2.93 19.1% 26
CTC-A-T Canadian Tire 3.9% $149.75 -18.2% $5.85 21.1% 11
CU-T Canadian Utilities Limited 4.8% $37.32 1.9% $1.78 1.0% 50
DOL-T Dollarama Inc. 0.3% $82.43 30.0% $0.22 9.2% 11
EMA-T Emera 5.0% $53.36 -14.7% $2.68 4.1% 15
ENB-T Enbridge Inc. 6.4% $53.39 7.8% $3.44 3.0% 26
ENGH-T Enghouse Systems Limited 2.2% $32.27 -29.6% $0.72 16.3% 15
FNV-N Franco Nevada 0.9% $140.81 3.5% $1.28 10.3% 14
FTS-T Fortis 3.9% $54.98 -9.1% $2.17 4.3% 48
IFC-T Intact Financial 2.0% $203.97 24.6% $4.00 17.6% 17
L-T Loblaws 1.2% $125.55 22.2% $1.54 12.4% 10
MGA-N Magna 3.1% $58.24 -28.6% $1.80 4.7% 12
MRU-T Metro 1.4% $78.38 16.9% $1.10 12.2% 27
RY-T Royal Bank of Canada 3.8% $130.91 -4.3% $4.96 14.8% 11
SJ-T Stella-Jones Inc. 1.6% $48.69 19.7% $0.80 11.1% 17
STN-T Stantec Inc. 1.1% $66.12 -5.8% $0.71 6.8% 10
TD-T TD Bank 3.9% $90.55 -8.9% $3.56 12.7% 11
TFII-N TFI International 1.0% $103.87 -6.2% $1.08 12.5% 11
TIH-T Toromont Industries 1.5% $99.89 -12.1% $1.52 15.2% 32
TRP-T TC Energy Corp. 6.2% $57.74 -3.3% $3.57 4.4% 21
T-T Telus 4.7% $28.10 -5.6% $1.33 6.2% 18
WCN-N Waste Connections 0.7% $139.94 4.4% $0.95 11.8% 12
Averages 3.1% -2.5% 10.6% 18

MP Market Review – December 02, 2022

Last updated by BM on December 05, 2022

Summary

  • This article is part of our weekly series (MP Market Review) highlighting the performance and activity from the previous week related to the financial markets and Canadian dividend growth companies we follow on ‘The List’.
  • Last week, ‘The List’ was up slightly with a minus -1.3% YTD price return (capital). Dividend growth of ‘The List’ remains at +10.6% YTD, demonstrating the rise in income over the last year.  
  • Last week, there were three dividend increases from companies on ‘The List’.
  • Last week, there were two earnings reports from companies on ‘The List’.
  • No companies on ‘The List’ are due to report earnings this week.
  • Are you looking to build an income portfolio of your own? When you become a premium subscriber, you get exclusive access to the MP Wealth-Builder Model Portfolio (CDN) and subscriber-only content. Start building real wealth today!  Learn More

“As Keynes wrote in 1936, “attach your hopes to its prospective yield”. It’s not the dividend that has the magic; it’s the increasing dividends that drive growing wealth. Realize this difference; it’s crucial.”

– Tom Connolly

We have spent some time this fall condensing everything we have read about dividend growth investing (DGI) over the past two decades and are in the process of creating a blog article on what we consider DGI Truths.

One of those truths we discovered is that we can’t control economic cycles (markets), but we can control income.

Nowhere is this more true than in the North American stock markets this year. In 2022 we have seen some amazing swings in market values with the overall trend downward. The markets, at times, have seemed out of control.

On the flipside, we continue to add quality dividend growers to our portfolios, and every one of the companies we own has increased its dividend again in 2022. An example of dividend growth investing in action is shown on ‘The List’ we follow on the blog. Although there is plenty of price volatility in the companies we follow, all have raised their dividend and has posted an average increase of 10.6%! There has been no volatility when it comes to income.

Aside from having good dividend growth records, one of the reasons we have confidence in future income growth is that the dividend growth companies we follow do a good job of communicating dividend payout guidance/policies in their investor presentations. Some have already increased their dividends again (as they said they would) in 2023. See the dividend increases section below for three examples.

In summary, we have learned that dividend growth in quality companies is very predictable year over year and is something we can rely on. Every once in a while, there is a dividend freeze or dividend cut, but overall, our portfolio income grows yearly.

If you are looking for peace of mind and predictability with your investments in 2023, maybe it’s time to change how you keep score. Stop looking at the value of your portfolio and keep your score based on income growth. You will be much happier with your investment decisions.

A second truth, which we will discuss in more detail next week, is that a rising dividend income stream will eventually lead to rising stock prices.

Performance of ‘The List’

At the end of the post is a snapshot of ‘The List’ from last Friday’s close. Feel free to click on the ‘The List’ menu item above for a sortable version.

Last week, ‘The List’ was up slightly with a minus -1.3% YTD price return (capital). Dividend growth of ‘The List’ remains at +10.6% YTD, demonstrating the rise in income over the last year.

The best performers last week on ‘The List’ were Enghouse Systems Limited (ENGH-T), up +4.80%; Loblaws (L-T), up +3.85%; and Dollarama Inc. (DOL-T), up +3.76%.

TC Energy Corp. (TRP-T) was the worst performer last week, down -11.79%.

Recent News

Grocery costs to rise by up to 7% in 2023 as pandemic, Russia’s war fuel increase, report says (Globe & Mail)

https://www.theglobeandmail.com/business/article-food-costs-for-family-of-four-projected-to-increase-by-1000-in-2023/

“Canada’s Food Price Report says the cost of groceries will increase by 5 per cent to 7 per cent in 2023, compounding the financial burden of a year of record-high food inflation that saw prices climb 10.3 per cent between November, 2021, and September, 2022.

By way of comparison, in its October Monetary Policy Report, the Bank of Canada said it expects the consumer price index to fall to about 3 per cent by late 2023.”

Who to believe?

The article says that the Canadian dollar is the critical piece right now as it can impact the cost of imports.

Do you still think that the Bank of Canada has inflation under control, or are more interest rate hikes more probable than not?

Forecasters split on how high Bank of Canada will push next rate hike (Globe & Mail)

https://www.theglobeandmail.com/business/article-looming-bank-of-canada-increase-expected-to-push-rates-near-peak/

“The central bank has raised interest rates six times since March in an effort to tackle the highest inflation in four decades. Higher rates make it more expensive for Canadians to borrow money and service their existing debts, with the goal of curbing demand for goods and services and acting as a brake on price increases.”

The article says forecasters are split on whether we get a 50 basis point hike now or two 25 basis point hikes in the next two months.

We must be careful and not rush into the market or get caught up in all the talk about a ‘fed pivot’. The point is that all agree that interest rates will continue to rise, and this will slow down the economy, which will impact earnings. How much and how fast these rates rise will always be up for debate.

Dividend Increases

Three companies on ‘The List’ announced a dividend increase last week.

Royal Bank (RY-T) on Wednesday said it increased its 2023 quarterly dividend from $1.28 to $1.32 per share, payable February 24, 2023, to shareholders of record on January 26, 2023.

This represents a dividend increase of +3%, marking the 12th straight year of dividend growth for this quality financial institution.

Enbridge Inc. (ENB-T) on Wednesday said it increased its 2023 quarterly dividend from $3.44 to $3.55 per share, payable March 1, 2023, to shareholders of record on February 14, 2023.

This represents a dividend increase of +3.2%, marking the 27th straight year of dividend growth for this oil and gas midstream company.

TD Bank (TD-T) on Thursday said it increased its 2023 quarterly dividend from $0.89 to $0.96 per share, payable January 31, 2023, to shareholders of record on January 6, 2023.

This represents a dividend increase of +7.9%, marking the 12th straight year of dividend growth for this quality financial institution.

Earnings Releases

No companies on ‘The List’ are due to report earnings this week.

Both Royal Bank (RY-T) and TD Bank (TD-T) follow an off-cycle reporting schedule. Their fiscal year ends on October 31 each year. Their fiscal Q4 earnings were reported last week.

Royal Bank of Canada (RY-T) released its fourth-quarter 2022 results on Wednesday, November 30, 2022, before markets opened.

“While market conditions continue to be tough, our 2022 results reflect a resilient bank that is well-positioned to pursue strategic growth and deliver long-term shareholder value. Our premium businesses, strong balance sheet, prudent risk management and diversified business model mean we can deliver advice and services that help our clients navigate all cycles. RBC colleagues remain focused on building more exceptional experiences for our clients and supporting sustainable and prosperous communities.”

– RBC President and Chief Executive Officer, Dave McKay

Highlights:

2022 Full-Year Business Segment Performance

  • 7% earnings growth in Personal & Commercial Banking, primarily attributable to higher net interest income, driven by average volume growth of 9% in both loans and deposits in Canadian Banking, and higher spreads. As a result of the rising interest rate environment (Bank of Canada raised the benchmark interest rate by 350 bps from March to October 2022), we saw higher spreads as compared to the prior year. Higher non-interest income, including higher foreign exchange revenue, card service revenue and service charges driven by increased client activity also contributed to the increase in earnings. These factors were partially offset by higher PCL, and higher staff and technology related costs. Our Canadian Banking franchise generated strong positive operating leverage of 3.8% while continuing to invest in digital initiatives to improve the client experience and deliver personalized advice.
  • 20% earnings growth in Wealth Management, mainly due to higher net interest income driven by average volume growth of 19% in loans and 11% in deposits largely in U.S. Wealth Management (including City National), and higher interest rates. Higher average fee-based client assets primarily reflecting net sales, as well as the impact of a legal provision taken in U.S. Wealth Management (including City National) in the prior year that was partially released in the first quarter of 2022, also contributed to the increase. These factors were partially offset by higher staff-related costs and variable compensation.
  • 4% lower earnings in Insurance, largely due to the impact of lower new longevity reinsurance contracts, partially offset by higher favourable investment-related experience.
  • 17% earnings growth in Investor & Treasury Services, mainly due to higher revenue from client deposits reflecting improved margins, partially offset by higher technology-related costs.
  • 30% lower earnings in Capital Markets, primarily driven by lower revenue in Corporate & Investment Banking, larger releases of provisions on performing assets in the prior year and lower revenue in Global Markets. Global investment banking fee pools were impacted by weakness in credit and equity markets beginning in the second fiscal quarter of 2022, resulting in an approximately 30% decline in global investment banking fee pools9 this fiscal year compared to record levels in fiscal 2021.

Outlook:

“Before I discuss the strategic initiatives that will drive our growth over the coming years, I will provide my perspective on the macro environment. Elevated uncertainty continues to affect asset valuations and market volatility, which in turn is impacting investor sentiment and client activity in both public and private markets.

While strong labour markets paint a favourable picture, and inflation appears to have peaked, we maintain our cautious stance on the outlook for economic growth. This caution stems from elevated housing and energy prices, political and geopolitical instability, a pressured manufacturing sector, and an aggressive monetary policy stance by central banks. Although higher interest rates are needed to preserve long-term economic stability, the lagging impact of monetary policy combined with strong employment and significant liquidity in the system has likely delayed what may end up being a brief and moderate recession.”

– President & Chief Executive Officer, Dave McKay

 See the full Earnings Release here


TD Bank (TD-T) released its fourth-quarter 2022 results on Thursday, December 1, before markets opened.

“I’m extremely pleased with our earnings performance this quarter, which capped off a strong year demonstrating the benefit of our diversified business model and prudent risk and financial management. The strength and resilience of our franchise enabled the Bank to invest in our business and deliver for our shareholders.”

– President & Chief Executive Officer, Bharat Masrani

Highlights:

FOURTH QUARTER FINANCIAL HIGHLIGHTS, compared with the fourth quarter last year:

  • Reported diluted earnings per share were $3.62 compared with $2.04.
  • Adjusted diluted earnings per share were $2.18, compared with $2.09.
  • Reported net income was $6,671 million, compared with $3,781 million.
  • Adjusted net income was $4,065 million, compared with $3,866 million.

FULL YEAR FINANCIAL HIGHLIGHTS, compared with last year:

  • Reported diluted earnings per share were $9.47, compared with $7.72.
  • Adjusted diluted earnings per share were $8.36, compared with $7.91.
  • Reported net income was $17,429 million, compared with $14,298 million.
  • Adjusted net income was $15,425 million, compared with $14,649 million.

Outlook:

For the year ahead, there are both tailwinds (including the interest rate environment and the anticipated closing of the announced acquisitions) and headwinds (including geopolitical tensions, the complex operating environment, and the potential for an economic slowdown). On balance, unless macroeconomic conditions were to shift dramatically, TD expects to meet or exceed its medium-term adjusted EPS growth target range of 7-10% in fiscal 2023.

We enter 2023 from a position of strength, with growing businesses and a powerful purpose-driven brand. While there will be macroeconomic and geopolitical challenges in the year ahead, the progress we made in 2022 gives me great confidence in our future success,” added Masrani. 

See the full Earnings Release here

Below is a snapshot of ‘The List’ from last Friday’s close. For a sortable version of ‘The List’, please click on The List menu item.

‘The List’ is not meant to be a template for investors to copy exactly. Instead, its purpose is to provide investment ideas and a real-time illustration of dividend growth investing in action. It is not a ‘Buy List’ nor does it reflect the composition or returns of our Magic Pants Wealth-Builder (CDN) Portfolio. It is only a starting point for our analysis and discussion.


The List (2022)
Last updated by BM on December 02, 2022

*Note: The following graph is wide, you can scroll to the right on your device to see more of the data.

SYMBOL COMPANY YLD PRICE YTD % DIV YTD % STREAK
AQN-N Algonquin Power & Utilities 9.3% $7.55 -47.4% $0.70 5.4% 11
ATD-T Alimentation Couche-Tard Inc. 0.8% $61.38 17.8% $0.47 26.2% 12
BCE-T Bell Canada 5.7% $63.65 -3.4% $3.64 4.0% 13
BIP-N Brookfield Infrastructure Partners 4.1% $35.35 -13.2% $1.44 5.9% 14
CCL-B-T CCL Industries 1.5% $62.38 -8.0% $0.96 14.3% 20
CNR-T Canadian National Railway 1.7% $172.04 11.1% $2.93 19.1% 26
CTC-A-T Canadian Tire 3.8% $155.49 -15.1% $5.85 21.1% 11
CU-T Canadian Utilities Limited 4.9% $36.40 -0.6% $1.78 1.0% 50
DOL-T Dollarama Inc. 0.3% $83.79 32.1% $0.22 9.2% 11
EMA-T Emera 5.1% $52.33 -16.4% $2.68 4.1% 15
ENB-T Enbridge Inc. 6.3% $54.69 10.4% $3.44 3.0% 26
ENGH-T Enghouse Systems Limited 2.3% $31.63 -31.0% $0.72 16.3% 15
FNV-N Franco Nevada 0.9% $145.54 6.9% $1.28 10.3% 14
FTS-T Fortis 4.0% $54.07 -10.6% $2.17 4.3% 48
IFC-T Intact Financial 2.0% $204.68 25.0% $4.00 17.6% 17
L-T Loblaws 1.3% $122.28 19.0% $1.54 12.4% 10
MGA-N Magna 2.9% $61.30 -24.9% $1.80 4.7% 12
MRU-T Metro 1.4% $77.67 15.9% $1.10 12.2% 27
RY-T Royal Bank of Canada 3.7% $134.21 -1.9% $4.96 14.8% 11
SJ-T Stella-Jones Inc. 1.6% $48.98 20.4% $0.80 11.1% 17
STN-T Stantec Inc. 1.0% $67.61 -3.7% $0.71 6.8% 10
TD-T TD Bank 3.9% $92.36 -7.0% $3.56 12.7% 11
TFII-N TFI International 1.0% $105.82 -4.5% $1.08 12.5% 11
TIH-T Toromont Industries 1.5% $103.48 -9.0% $1.52 15.2% 32
TRP-T TC Energy Corp. 6.1% $58.19 -2.6% $3.57 4.4% 21
T-T Telus 4.7% $28.60 -3.9% $1.33 6.2% 18
WCN-N Waste Connections 0.6% $145.45 8.5% $0.95 11.8% 12
Averages 3.0% -1.3% 10.6% 18

MP Market Review – November 25, 2022

Last updated by BM on November 28, 2022

Summary

  • This article is part of our weekly series (MP Market Review) highlighting the performance and activity from the previous week related to the financial markets and Canadian dividend growth companies we follow on ‘The List’.
  • Last week, ‘The List’ was up again with a minus -1.4% YTD price return (capital). Dividend growth of ‘The List’ continues to grow and is now at +10.6% YTD, demonstrating the rise in income over the last year.
  • Last week, there was one dividend increase from a company on ‘The List’.
  • Last week, there was one earnings report from a company on ‘The List’.
  • Two companies on ‘The List’ are due to report earnings this week.
  • Are you looking to build an income portfolio of your own? When you become a premium subscriber, you get exclusive access to the MP Wealth-Builder Model Portfolio (CDN) and subscriber-only content. Start building real wealth today!  Learn More

“As income investors, our primary concern is not the price of a stock on a given day. We are not sellers, we are always net buyers of stocks. So we want to constantly question whether changing conditions will put our dividends at risk. The good news is that the pressures of this selloff are valuation driven, not driven by the fundamentals. Fundamentally, the companies we are invested in likely have higher earnings this quarter than last quarter. Earnings are climbing, it’s the market’s valuation of those earnings that is declining.”

– Rida Morwa, Seeking Alpha Contributor

Changing conditions have certainly put Algonquin Power & Utilities (AQN-N) dividend at risk. Algonquin’s earnings are not climbing, they are dropping, and higher interest rates have certainly affected their ability to service their floating rate debt. With a cash flow deficit looming and a payout ratio set to exceed 100%, (AQN-N) will likely need to cut its dividend to fund its capital program.

We have never owned (AQN-N) in our portfolios because they did not score high enough on our quality indicators. Most dividend growth ETFs and model portfolios did, however own Algonquin Power & Utilities because they don’t put the same emphasis on quality as we do. They are more interested in yield than quality.

We have updated our post, ‘Finding Quality Dividend Growth Stocks’, from 2021. From time to time, we will update some of our learning material to reflect new research. Keep these indicators nearby whenever you are thinking about entering a position in a dividend growth stock.

Performance of ‘The List’

At the end of the post is a snapshot of ‘The List’ from last Friday’s close. Feel free to click on the ‘The List’ menu item above for a sortable version.

Last week, ‘The List’ was up slightly with a minus -1.4% YTD price return (capital). Dividend growth of ‘The List’ remains at +10.6% YTD, demonstrating the rise in income over the last year.

The best performers last week on ‘The List’ were Loblaws (L-T), up +6.14%; Franco Nevada (FNV-N), up +4.08%; and Dollarama Inc. (DOL-T), up +3.93%.

Alimentation Couche-Tard Inc. (ATD-T) was the worst performer last week, down -1.36%.

Recent News

Couche-Tard shares have had a good year. Here’s why investors shouldn’t shy away from a winner (Globe & Mail)

https://www.theglobeandmail.com/investing/markets/inside-the-market/article-couche-tard-shares-have-had-a-good-year-heres-why-investors-shouldnt/

The author details why Alimentation Couche-Tard Inc. is a good company to own in all markets. Although the valuation could be better, the article makes a good argument for getting in now, as this dividend grower rarely goes on sale. Nice dividend raise last week of 27.3% is a good sign that he may be right.

See the earnings report below for more insight on (ATD-T).

Why I’m buying more of these two dividend-growing utilities (Globe & Mail)

https://www.theglobeandmail.com/investing/education/article-why-im-buying-more-of-these-two-dividend-growing-utilities/

It seems that owning lower-quality dividend growth companies in the model ‘Yield Hog Dividend Growth Portfolio’ has finally caught up to Mr. Heinzl. He decided to sell his Algonquin Power & Utilities holdings and reinvest in higher-quality utilities after Algonquin reported less-than-stellar earnings and a revised outlook in its recent third quarter.

“If there is one lesson Algonquin taught us, however, it’s that even companies with a history of raising their dividends can stumble.”

Mr. Heinzl is right about dividend growers stumbling from time to time. Assessing the quality of our good dividend growers is the first step in our process. We don’t move forward unless several quality indicators are present.

Two companies on ‘The List’ are due to report earnings this week.  

Royal Bank of Canada (RY-T) will release its fourth-quarter 2022 results on Wednesday, November 30, 2022, before markets open.

TD Bank (TD-T) will release its fourth-quarter 2022 results on Thursday, December 1, before markets open.

Dividend Increases

One company on ‘The List’ announced a dividend increase last week.

Alimentation Couche-Tard Inc. (ATD-T) on Wednesday said it increased its 2023 quarterly dividend from $0.11 to $0.14 per share, payable December 15, 2022, to shareholders of record on December 1, 2022.

This represents a dividend increase of +27.3%, marking the 13th straight year of dividend growth for this global convenience-store operator.

Earnings Releases

Alimentation Couche-Tard Inc. (ATD-T) follows an off-cycle reporting schedule. On Wednesday, November 23, 2022, before markets opened, they reported their Q2 Fiscal 2023 earnings.

“We are pleased to report strong results this quarter, especially in the face of the continued challenges of high inflation, energy and fuel prices across the global economy. We had good performance in convenience with favorable same store sales, particularly in our U.S. market, which had strong growth in food, and positive promotional activity. We also continued to generate robust fuel margins across all of our platforms. As always, we remain committed to delivering consistent value both inside our stores and on our forecourts to help make our customers’ lives a little easier every day.”

– President and Chief Executive Officer, Brian Hannasch

Highlights:

  • Net earnings were $810.4 million, or $0.79 per diluted share for the second quarter of fiscal 2023 compared with $694.8 million, or $0.65 per diluted share for the second quarter of fiscal 2022. Adjusted net earnings1 were approximately $838.0 million compared with $693.0 million for the second quarter of fiscal 2022. Adjusted diluted net earnings per share1 were $0.82, representing an increase of 26.2% from $0.65 for the corresponding quarter of last year.
  • Total merchandise and service revenues of $4.1 billion, an increase of 2.3%. Same-store merchandise revenues2 increased by 5.6% in the United States, by 2.9% in Europe and other regions1, and decreased by 1.5% in Canada.
  • Merchandise and service gross margin1 increased by 0.2% in the United States to 34.0%, by 0.9% in Canada to 33.2% and decreased by 0.1% in Europe and other regions to 38.3%.
  • Same-store road transportation fuel volumes decreased by 1.9% in the United States, by 6.3% in Europe and other regions, and by 6.5% in Canada.
  • Road transportation fuel gross margin1 of 49.16¢ per gallon in the United States, an increase of 12.77¢ per gallon, US 9.76¢ per liter in Europe and other regions, a decrease of US 0.81¢ per liter driven by the impact of currency translation, and CA 12.55¢ per liter in Canada, an increase of CA 1.52¢ per liter. Fuel margins remained healthy throughout the network due to favorable market conditions and the continued work on the optimization of the supply chain.
  • The Corporation completed the acquisition of 218 sites within the Wilsons network, consisting of 79 company-owned and operated convenience retail and fuel locations, 2 company-owned and dealer-operated locations, 137 dealer-owned and operated locations, and a fuel terminal in Atlantic Canada. According to the Corporation’s agreement with the competition bureau, a portion of this network will be divested.
  • During the second quarter and first half-year of fiscal 2023, the Corporation repurchased shares for amounts of $205.2 million and $683.2 million, respectively. Subsequent to the end of the quarter, shares were repurchased for an amount of $396.2 million.
  • Sustained healthy financial situation as demonstrated by a leverage ratio1 of 1.20 : 1, and a return on capital employed1 of 16.4%, both driven by strong earnings.
  • 3% increase of the quarterly dividend, from CA 11.0¢ per share, bringing it to CA 14.0¢ per share.

Outlook:

“We are proud of the recent significant milestones that we have achieved especially in innovation and mobility. Over 1,000 units have been deployed so far in the roll out of our easy-to-use, smart checkout technology. We passed one million pay-by-plate fuel transactions on Circle K forecourts in Europe and launched the first-ever public EV-chargers for trucks in Scandinavia. We have also piloted our new loyalty program in the U.S. and new tiered concept in Europe. We are pleased with the early results of those pilots and are preparing for an expansion in the upcoming quarters,” concluded Brian Hannasch..

 See the full Earnings Release here

Below is a snapshot of ‘The List’ from last Friday’s close. For a sortable version of ‘The List’, please click on The List menu item.

‘The List’ is not meant to be a template for investors to copy exactly. Instead, its purpose is to provide investment ideas and a real-time illustration of dividend growth investing in action. It is not a ‘Buy List’ nor does it reflect the composition or returns of our Magic Pants Wealth-Builder (CDN) Portfolio. It is only a starting point for our analysis and discussion.

The List (2022)
Last updated by BM on November 25, 2022

*Note: The following graph is wide, you can scroll to the right on your device to see more of the data.

SYMBOL COMPANY YLD PRICE YTD % DIV YTD % STREAK
AQN-N Algonquin Power & Utilities 9.2% $7.68 -46.5% $0.70 5.4% 11
ATD-T Alimentation Couche-Tard Inc. 0.8% $60.88 16.9% $0.47 26.2% 12
BCE-T Bell Canada 5.7% $64.15 -2.7% $3.64 4.0% 13
BIP-N Brookfield Infrastructure Partners 3.8% $37.76 -7.3% $1.44 5.9% 14
CCL-B-T CCL Industries 1.5% $64.07 -5.5% $0.96 14.3% 20
CNR-T Canadian National Railway 1.7% $169.17 9.2% $2.93 19.1% 26
CTC-A-T Canadian Tire 3.9% $150.08 -18.1% $5.85 21.1% 11
CU-T Canadian Utilities Limited 4.8% $36.84 0.6% $1.78 1.0% 50
DOL-T Dollarama Inc. 0.3% $80.75 27.3% $0.22 9.2% 11
EMA-T Emera 5.1% $52.73 -15.8% $2.68 4.1% 15
ENB-T Enbridge Inc. 6.1% $55.94 12.9% $3.44 3.0% 26
ENGH-T Enghouse Systems Limited 2.4% $30.18 -34.2% $0.72 16.3% 15
FNV-N Franco Nevada 0.9% $144.45 6.1% $1.28 10.3% 14
FTS-T Fortis 4.0% $54.09 -10.6% $2.17 4.3% 48
IFC-T Intact Financial 2.0% $197.71 20.8% $4.00 17.6% 17
L-T Loblaws 1.3% $117.75 14.6% $1.54 12.4% 10
MGA-N Magna 2.9% $61.64 -24.5% $1.80 4.7% 12
MRU-T Metro 1.4% $77.26 15.2% $1.10 12.2% 27
RY-T Royal Bank of Canada 3.7% $134.81 -1.5% $4.96 14.8% 11
SJ-T Stella-Jones Inc. 1.7% $47.31 16.3% $0.80 11.1% 17
STN-T Stantec Inc. 1.0% $67.81 -3.4% $0.71 6.8% 10
TD-T TD Bank 3.9% $91.02 -8.4% $3.56 12.7% 11
TFII-N TFI International 1.0% $106.19 -4.1% $1.08 12.5% 11
TIH-T Toromont Industries 1.5% $102.34 -10.0% $1.52 15.2% 32
TRP-T TC Energy Corp. 5.4% $65.97 10.4% $3.57 4.4% 21
T-T Telus 4.6% $29.04 -2.4% $1.33 6.2% 18
WCN-N Waste Connections 0.7% $142.17 6.0% $0.95 11.8% 12
Averages 3.0% -1.4% 10.6% 18

MP Market Review – November 18, 2022

Last updated by BM on November 21, 2022

Summary

  • This article is part of our weekly series (MP Market Review) highlighting the performance and activity from the previous week related to the financial markets and Canadian dividend growth companies we follow on ‘The List’.
  • Last week, ‘The List’ was down slightly with a minus -3.3% YTD price return (capital). Dividend growth of ‘The List’ remains at +10.3% YTD, demonstrating the rise in income over the last year.  
  • Last week, there were no dividend increases from companies on ‘The List’.
  • Last week, two companies on ‘The List’ reported their earnings.
  • No companies on ‘The List’ are due to report earnings this week.  
  • Are you looking to build an income portfolio of your own? When you become a premium subscriber, you get exclusive access to the MP Wealth-Builder Model Portfolio (CDN) and subscriber-only content. Start building real wealth today!  Learn More

Williams shared many of Graham’s views when it came to drawing a distinction between investing and speculating. Williams defined an investor as “a buyer interested in dividends, or coupons and principal,” and a speculator as “a buyer interested in the resale price” alone.

– John Burr Williams, The Theory of Investment Value

As dividend growth investors, we like to tell the story of the two farmers, the chicken farmer and the egg farmer. Given what we are seeing in markets now, we thought it was a good time to tell the story again.

“Imagine two farms and two farmers. One farmer raises chickens and sells them to grocery stores. We’ll call him a chicken farmer. The other farmer keeps hens in a henhouse and feeds the eggs to his rather large family. The second one is an egg farmer.

The first person, the chicken farmer, is vitally interested in the market value of chickens. The second one, the egg farmer, is vitally interested in the number of eggs that his hens can lay, and in the health of the hens, but he doesn’t care at all about the market value of his hens.

For the chicken farmer, risk means the probability of a decline in the price of chickens. On the other hand, the egg farmer could care less about market values. His risks are foxes, and viruses, and other such threats to the well-being of his hens.”

– Jim Garland,, Memo to the Darcy Family: To Thine Own Self Be True

The ‘chicken farmers’ make up most of the investing world and are still chasing the latest narrative or big idea after losing a substantial amount of their wealth during the volatile markets of 2022.  Many have either panicked and sold their high-flying ETFs and funds because they needed the income to live off or have not yet realized any losses and have re-entered on every bear market bounce to lower their cost base, only to see their lower prices go even lower. For the latter group, you are not alone. Maybe it’s time to take a page out of the ‘egg farmers’ playbook.

The ‘egg farmers’ above are fine as the dividends (eggs) from their chickens continue to grow in both up and down markets.

Our advice to someone who has been in your shoes, stop being a ‘speculator’ and look at dividend growth investing for a portion of your net worth. You won’t be disappointed. A growing dividend and a growing price (eventually) are a powerful combination.

Armed with a strategy that pays us in both up and down markets, we take a patient approach to investing and wait for a sensible price on our good dividend growers. Buying more income at a lower price is our key to wealth-building in today’s chicken-farming world.

Performance of ‘The List’

At the end of the post is a snapshot of ‘The List’ from last Friday’s close. Feel free to click on the ‘The List’ menu item above for a sortable version.

Last week, ‘The List’ was down slightly with a minus -3.3% YTD price return (capital). Dividend growth of ‘The List’ remains at +10.3% YTD, demonstrating the rise in income over the last year.

The best performers last week on ‘The List’ were Metro (MRU-T), up +6.34%; CCL Industries (CCL-B-T), up +5.75%; and Waste Connections (WCN-N), up +2.90%.

Algonquin Power & Utilities (AQN-N) was the worst performer last week, down -17.53%.

Recent News

Falling Q4 profit forecasts another negative for U.S. stocks (Globe & Mail)

“For the Fed to achieve their inflation targets, they’re going to have to push the economy into a recession,” which means 2023 profit estimates “have to come down a lot more,” he said.”

According to the article, persistent inflation means that rates are going to continue to rise, and the economy will therefore continue to slow. This has been our view all along.

Fortunately, good bargains on our dividend growers are still to come.

Boring stocks work better than you think (Globe & Mail)

“A highly volatile asset should be less attractive than a more stable one, everything else being equal. But volatility’s allure makes perfect sense psychologically. What do people want? Huge returns. When do they want them? Now.”

Canadian Railways, Telcos, Utilities, Grocers, Banks and Financials (think of ‘The List’) have put up impressive returns for years, according to the author. His laggards have been technology, precious metal miners, and exploration and production companies in the energy space.

“If there is a lesson here, it is that boring works better than you may think. You may never have the thrill of watching your investments soar overnight. Then again, you are far less likely them to see them abruptly wither. Over the long haul, the race goes to the mundane, not the magic beans.”

No companies on ‘The List’ are due to report earnings this week.

Dividend Increases

Last week, there were no dividend increases from companies on ‘The List’.

Earnings Releases

Last week, two companies on ‘The List’, reported earnings. Grocers got their chance to report last week and they did not disappoint.

Metro (MRU-T) follows an off-cycle reporting schedule. This means its fiscal year ends at the end of September. On Wednesday, November 16, 2022, before markets opened, Metro released its fourth-quarter 2022 results.

“Our 2022 fiscal year ended with a solid performance in the fourth quarter as our teams worked tirelessly to offer products at affordable and competitive prices in the current high inflation environment, which we know is difficult for many consumers. Our diversified business model allowed us to maintain stable gross margins while delivering good value to our customers, as reflected in overall tonnage growth and market share gains in the quarter. We are confident that our dedicated teams, multiple banners, strong private label offering, effective weekly promotions and loyalty programs position us well to continue to meet the needs of our customers as we navigate in this period of turbulence.

– President and Chief Executive Officer, Eric La Fleche

Highlights:

  • Sales of $4,432.6 million, up 8.3%
  • Food same-store sales up 8.0%
  • Pharmacy same-store sales up 7.4%
  • Net earnings of $168.7 million, down 13.0% and adjusted net earnings of $219.4 million, up 9.4%
  • Fully diluted net earnings per share of $0.70, down 11.4%, and adjusted fully diluted net earnings per share of $0.92, up 13.6%
  • Non-cash impairment of a loyalty program totaling $60.0 million

Outlook:

“As we begin our new fiscal year, we continue to face market uncertainties, labour shortages and elevated levels of cost inflation and it is difficult to predict how this macroeconomic environment will evolve.  We remain steadfast in our focus to deliver value to our customers through our robust merchandising programs, our strong private label offer and working with our supply chain partners. We have also decided to exit the UGI purchasing group effective March 11, 2023. This decision will have no significant impact on our financial results.”

– President and Chief Executive Officer, Eric La Fleche

See the full Earnings Release here


Loblaws (L-T) released its third-quarter 2022 results on Wednesday, November 16, 2022, before markets opened.

“In a difficult economic environment, Loblaw is putting the strength of its unique assets to work for Canadians, offering record loyalty rewards, unmatched private-label brands, the best discount stores, and an inflation-fighting price freeze,” said Galen G. Weston, Chairman and President, Loblaw Companies Limited. “Customer expectations for value have never been higher, and we are working hard to meet them.”

– Chairman and President, Galen G. Weston

Highlights:

  • Revenue was $17,388 million, an increase of $1,338 million, or 8.3%.
  • Retail segment sales were $17,130 million, an increase of $1,299 million, or 8.2%.
  • Food Retail (Loblaw) same-stores sales increased by 6.9%.
  • Drug Retail (Shoppers Drug Mart) same-store sales increased by 7.7%.
  • E-commerce sales increased by 3%.
  • Operating income was $991 million, an increase of $128 million, or 14.8%.
  • Adjusted EBITDA was $1,846 million, an increase of $172 million, or 10.3%.
  • Retail segment adjusted gross profit percentage was 30.8%, an increase of 10 basis points.
  • Net earnings available to common shareholders of the Company were $556 million, an increase of $125 million or 29.0%. Diluted net earnings per common share were $1.69, an increase of $0.42, or 33.1%.
  • Adjusted net earnings available to common shareholders of the Company were $663 million, an increase of $123 million, or 22.8%.
  • Adjusted diluted net earnings per common share were $2.01, an increase of $0.42 or 26.4%.
  • Repurchased for cancellation, 3.4 million common shares at a cost of $403 million and invested $432 million in capital expenditures. Retail segment free cash flow was $543 million.

Outlook:

Loblaw will continue to execute on retail excellence in its core grocery and pharmacy businesses while advancing its growth initiatives in 2022. In the third year of the pandemic, the Company’s businesses remain well placed to service the everyday needs of Canadians. However, the Company cannot predict the precise impacts of COVID-19, the related industry volatility and inflationary environment on its 2022 financial results.

On a full year basis, the Company continues to expect:

  • its Retail business to grow earnings faster than sales;
  • to invest approximately $1.4 billion in capital expenditures, net of proceeds from property disposals, reflecting incremental store and distribution network investments; and
  • to return capital to shareholders by allocating a significant portion of free cash flow to share repurchases.

Based on its year to date operating and financial performance and momentum exiting the third quarter, the Company expects full year adjusted net earnings per common share growth in the high teens.

See the full earnings release here

Below is a snapshot of ‘The List’ from last Friday’s close. For a sortable version of ‘The List’, please click on The List menu item.

‘The List’ is not meant to be a template for investors to copy exactly. Instead, its purpose is to provide investment ideas and a real-time illustration of dividend growth investing in action. It is not a ‘Buy List’ nor does it reflect the composition or returns of our Magic Pants Wealth-Builder (CDN) Portfolio. It is only a starting point for our analysis and discussion.


The List (2022)
Last updated by BM on November 18, 2022

*Note: The following graph is wide, you can scroll to the right on your device to see more of the data.

SYMBOL COMPANY YLD PRICE YTD % DIV YTD % STREAK
AQN-N Algonquin Power & Utilities 9.2% $7.67 -46.6% $0.70 5.4% 11
ATD-T Alimentation Couche-Tard Inc. 0.7% $61.72 18.5% $0.44 18.1% 12
BCE-T Bell Canada 5.7% $63.37 -3.9% $3.64 4.0% 13
BIP-N Brookfield Infrastructure Partners 3.9% $37.15 -8.8% $1.44 5.9% 14
CCL-B-T CCL Industries 1.5% $62.37 -8.0% $0.96 14.3% 20
CNR-T Canadian National Railway 1.8% $166.49 7.5% $2.93 19.1% 26
CTC-A-T Canadian Tire 4.0% $147.86 -19.3% $5.85 21.1% 11
CU-T Canadian Utilities Limited 5.0% $35.85 -2.1% $1.78 1.0% 50
DOL-T Dollarama Inc. 0.3% $77.70 22.5% $0.22 9.2% 11
EMA-T Emera 5.2% $51.32 -18.0% $2.68 4.1% 15
ENB-T Enbridge Inc. 6.4% $53.97 8.9% $3.44 3.0% 26
ENGH-T Enghouse Systems Limited 2.4% $29.21 -36.3% $0.72 16.3% 15
FNV-N Franco Nevada 0.9% $138.79 2.0% $1.28 10.3% 14
FTS-T Fortis 4.1% $53.43 -11.7% $2.17 4.3% 48
IFC-T Intact Financial 2.1% $194.26 18.7% $4.00 17.6% 17
L-T Loblaws 1.4% $110.94 8.0% $1.54 12.4% 10
MGA-N Magna 2.9% $62.00 -24.0% $1.80 4.7% 12
MRU-T Metro 1.4% $76.67 14.4% $1.10 12.2% 27
RY-T Royal Bank of Canada 3.7% $132.70 -3.0% $4.96 14.8% 11
SJ-T Stella-Jones Inc. 1.7% $46.62 14.6% $0.80 11.1% 17
STN-T Stantec Inc. 1.1% $66.48 -5.3% $0.71 6.8% 10
TD-T TD Bank 4.0% $89.42 -10.0% $3.56 12.7% 11
TFII-N TFI International 1.0% $104.80 -5.4% $1.08 12.5% 11
TIH-T Toromont Industries 1.5% $99.98 -12.1% $1.52 15.2% 32
TRP-T TC Energy Corp. 5.6% $64.00 7.1% $3.57 4.4% 21
T-T Telus 4.6% $29.17 -2.0% $1.33 6.2% 18
WCN-N Waste Connections 0.7% $140.20 4.6% $0.95 11.8% 12
Averages 3.1% -3.3% 10.3% 18

MP Market Review – November 11, 2022

Last updated by BM on November 14, 2022

Summary

  • This article is part of our weekly series (MP Market Review) highlighting the performance and activity from the previous week related to the financial markets and Canadian dividend growth companies we follow on ‘The List’.
  • Last week, ‘The List’ was up slightly with a minus -3.0% YTD price return (capital). Dividend growth of ‘The List’ remains at +10.3% YTD, demonstrating the rise in income over the last year.  
  • Last week, there was one dividend increase from a company on ‘The List’.
  • Last week, nine companies on ‘The List’ reported their Q3 earnings.
  • Two companies on ‘The List’ are due to report earnings this week.
  • Are you looking to build an income portfolio of your own? When you become a premium subscriber, you get exclusive access to the MP Wealth-Builder Model Portfolio (CDN) and subscriber-only content. Start building real wealth today!  Learn More 

“Try not to worry about short-term price volatility. Volatility just means ‘they’ don’t know what’s going to happen. We don’t know either, but what we do is predictable. Highly predictable. It’s in our data.”

– Tom Connolly

Double-digit gains last week from four companies on ‘The List’ and one double-digit loss. Add Magna International’s (MGA-N) return of +10.79% to our summary of best performers last week, and you would think that we are finally coming out of the bear market that has dogged us for most of the year. That is until Algonquin Power & Utilities (AQN-N) reported their third-quarter earnings and Q4 2022 guidance, and the stock ended down -15.9% on the week. Also of note, five of the nine companies who reported last week missed Analyst estimates on their Q3 earnings reports. Scroll to the bottom of ‘The List’ menu item to see our ‘Q3 2022 Earnings Calendar’. Unfortunately, nothing has changed from a macro standpoint in the economy, yet investors rush into the market in droves every time there is a hint of good news.

Having a process protects our hard-earned capital. Knowing when to add to a position in these volatile markets is important. As a subscriber of the blog, you will have noticed that we do not always add to a position at the absolute market bottom. As ‘incremental’ buyers (more than one trade) at sensible prices, we increase our probability of a successful outcome.

The actual good news in the market is that the dividend income of ‘The List’ in 2022 is once again higher than inflation and continues to grow (+10.3% YTD), with a handful of companies already announcing increases for 2023. As dividend growth investors, we know that the growing dividend will eventually drive the price higher, so we wait patiently to add to our quality companies. As my mentor, Tom Connolly, states above..” what we do is highly predictable.”

Performance of ‘The List’

At the end of the post is a snapshot of ‘The List’ from last Friday’s close. Feel free to click on the ‘The List’ menu item above for a sortable version.

Last week, ‘The List’ was up slightly with a minus -3.0% YTD price return (capital). Dividend growth of ‘The List’ remains at +10.3% YTD, demonstrating the rise in income over the last year.

The best performers last week on ‘The List’ were TFI International (TFII-N), up +12.86%; Stella-Jones Inc. (SJ-T), up +11.78%; and Franco Nevada (FNV-N), up +11.58%.

Algonquin Power & Utilities (AQN-N) was the worst performer last week, down -15.91%.

Recent News

Algonquin Power shares plunge nearly 20% as utility lowers guidance, analysts slash price targets (Globe & Mail)

Not all was well in this season’s earnings reports, and one of the utilities we follow on ‘The List’ reported lower-than-expected earnings and was forced to lower guidance for the rest of the year. The reason was challenging macroeconomic conditions (higher interest rates and inflation).

This should not have surprised most investors as (AQN-N) is highly leveraged, and any hint of bad news will send their stock price spiralling downward. The next shoe to drop could be the company’s dividend record. At a minimum, dividend growth will be slowing.  

Algonquin Power & Utilities has been a favourite of many dividend ETF’s and model portfolios due to its higher-than-average starting yield. Fortunately, (AQN-N) never passed the ‘quality’ test for us, so we stayed away.

Trudeau government’s tax on corporate share buybacks will likely hurt Canada’s economy (Glove & Mail)

“No tax is ever costless to the economy. Owing mainly to reduced productivity, the cost of a tax on share buybacks will likely exceed the modest revenues the tax will raise.”

In another attempt by governments to legislate that large corporations pay their ‘fair share’ of taxes, Canada may end up doing the opposite, as the author points out.

On the positive side, this could also mean that companies use their cash flow to raise dividends even more if they don’t want to pay the tax on buybacks. We have always preferred dividends to share buybacks as we don’t believe buybacks create long-term wealth for shareholders.

We probably will never know how much of this is good policy over good politics as our memories are short-term, and the result of this new tax could take years to play out.

Two companies on ‘The List’ are due to report earnings this week.  

Metro (MRU-T) will release its fourth-quarter 2022 results on Wednesday, November 16, 2022, before markets open.

Loblaws (L-T) will release its third-quarter 2022 results on Wednesday, November 16, 2022, before markets open.

Dividend Increases

One company on ‘The List’ announced a dividend increase last week.

Canadian Tire (CTC-A-T) on Thursday said it increased its 2023 quarterly dividend from $1.625 to $1.725 per share, payable March 1, 2023, to shareholders of record on January 31, 2023.

This represents a dividend increase of +6%, marking the 13th straight year of dividend growth for this quality retailer.

Earnings Releases

Last week, nine companies on ‘The List’ reported their Q3 2022 earnings. Let’s get started with one of our ‘Core’ category companies, Franco-Nevada.

Franco Nevada (FNV-N) released its third-quarter 2022 results on Monday, November 7, 2022, before markets opened.

“Our diversified portfolio performed well in the quarter with declines in precious metal prices partially offset by strong oil and gas prices.”

– Chief Executive Officer, Paul Brink

Highlights:

  • Earned record GEOs, revenue, net income, Adjusted Net Income and Adjusted EBITDA YTD in 2022
  • No debt and $2.0 billion in available capital as at September 30, 2022
  • Generated $232.3 million in operating cash flow for the quarter

Portfolio Additions

  • Financing Package with Argonaut Gold on the Magino Gold Project: On October 27, 2022, we acquired a 2% NSR on Argonaut Gold Inc.’s (“Argonaut”) construction-stage Magino gold project located in Ontario, Canada, for a purchase price of $52.5 million. We also completed a private placement with Argonaut of $10.0 million (C$13.6 million). Argonaut reported that the construction of the project is approximately 70% complete as at September 30, 2022, with first gold pour expected in April 2023.
  • Financing Package with Westhaven Gold Corp. on Spences Bridge Gold Belt Claims: On October 6, 2022, we acquired a 2% NSR on all of Westhaven Gold Corp’s (“Westhaven”) claims across the Spences Bridge Gold Belt in Southern British Columbia, Canada, for $6.0 million and an existing 2.5% NSR from Westhaven on adjoining properties currently owned by Talisker Resources Ltd. for a purchase price of $0.75 million. In addition, we also subscribed for $0.73 million (C$1.0 million) of Westhaven’s common shares.
  • Financing Package with G Mining Ventures on the Tocantinzinho Gold Project: As previously announced on July 18, 2022, we acquired, through our wholly-owned subsidiary, Franco-Nevada (Barbados) Corporation (“FNBC”), a gold stream with reference to production from the Tocantinzinho project, owned by G Mining Ventures Corp. (“G Mining Ventures”) and located in Pará State, Brazil (the Stream”). FNBC will provide a deposit of $250 million. Additionally, through one of our wholly-owned subsidiaries, we agreed to provide G Mining Ventures with a $75.0 million secured term loan (the “Term Loan”). We also subscribed for $27.5 million (C$35.8 million) of G Mining Ventures’ common shares.

Outlook:

“Franco-Nevada has record GEOs, revenue, net income, Adjusted Net Income and Adjusted EBITDA for the three quarters through September 30, 2022 and is on-track to meet full year guidance.

– Chief Executive Officer, Paul Brink 

See the full Earnings Release here


Intact Financial (IFC-T) released its third-quarter 2022 results on Tuesday, November 8, 2022, after markets closed.

“We achieved solid operating performance across the platform despite active weather and ongoing cost pressures. Our people are working hard to get customers back on track after the devastation caused by recent hurricanes. At the same time, our balance sheet remains resilient in the context of volatile capital market conditions which we continue to monitor closely. Finally, we continued to make progress on the integration of RSA, with synergies tracking towards our recently increased target of a $350 million run-rate in 2024.”

– Chief Executive Officer, Charles Brindamour

Highlights:

  • Net operating income per share decreased 6% to $2.70, reflecting a slight increase in operating combined ratio, offset in part by higher investment and distribution income
  • Operating DPW grew 2% as continued solid growth in specialty lines was partially offset by profitability actions, including strategic exits
  • Operating combined ratio was robust at 92.6%, with very strong results in commercial lines and Canada personal auto performing as expected
  • EPS increased 26% to $2.02 with solid operating and non-operating performance, while last year’s results were impacted by an impairment charge on an investment
  • OROE and ROE were strong at 15.0% and 19.1%, respectively, reflecting continued strong performance
  • BVPS was stable year-over-year, as strong earnings were offset by significant mark-to-market losses on investments

Outlook:

  • Over the next twelve months, we expect firm-to-hard insurance market conditions to continue in most lines of business, driven by inflation and climate change.
  • In Canada, we expect firm market conditions to continue in personal property. Personal auto premium growth is expected to be in the midsingle-digit range over the next 12 months, to reflect inflation and evolving driving patterns.
  • In commercial and specialty lines across all geographies, hard market conditions are expected to continue.
  • In the UK&I, we expect the personal property market to firm as it reacts to inflationary pressures and adapts to reform measures. Personal motor has begun to firm and we anticipate this to increase over time.

– Chief Executive Officer, Charles Brindamour 

See the full Earnings Release here


TC Energy (TRP-T) released its third-quarter 2022 results on Wednesday, November 9, 2022, before markets opened.

“Demand for our services across our North American portfolio remains high and we continue to see strong utilization, availability, and overall asset performance. Comparable EBITDA was 10 per cent higher and segmented earnings 16 per cent higher relative to third quarter 2021. As a result, we have increased our 2022 comparable EBITDA outlook which is now expected to be approximately four per cent higher than 2021.”

– Chief Executive Officer, Francois Poirier

Highlights:

  • Revised 2022 comparable EBITDA outlook to be higher than 2021, with an expected year-over-year growth rate of approximately four per cent. 2022 comparable earnings per common share1 are expected to be consistent with 2021
  • Third quarter 2022 results were underpinned by solid utilization, safe operations and availability across our assets during peak demand. The continued need for energy security has placed renewed focus on the long-term role we believe our infrastructure will play in responsibly fulfilling North America’s growing energy demand:
    • Louisiana XPress was phased into service during the quarter and has increased our market share from 25 to approximately 30 per cent of volumes destined for export from third-party U.S. LNG facilities
    • Total NGTL System deliveries averaged 12.4 Bcf/d, up four per cent compared to third quarter 2021
    • S. Natural Gas Pipelines flows averaged 25.8 Bcf/d, up six per cent compared to third quarter 2021
    • Bruce Power provided emission-less power with approximately 95 per cent availability during third quarter 2022
    • The Keystone Pipeline System safely reached a record month in September, delivering approximately 640,000 Bbl/d as we commercialized an incremental 10,000 Bbl/d of contracts from the 2019 Open Season
  • Third quarter 2022 financial results:
    • Net income attributable to common shares of $0.8 billion or $0.84 per common share compared to net income of $0.8 billion or $0.80 per common share in 2021. Comparable earnings1 of $1.1 billion or $1.07 per common share compared to $1.0 billion or $0.99 per common share in 2021
    • Segmented earnings of $1.8 billion compared to segmented earnings of $1.5 billion in 2021 and comparable EBITDA of $2.5 billion compared to $2.2 billion in 2021
    • Net cash provided by operations of $1.7 billion was consistent with 2021 results and comparable funds generated from operations1 was $1.6 billion, consistent with 2021 results
  • Declared a quarterly dividend of $0.90 per common share for the quarter ending December 31, 2022
  • Dividend Reinvestment Plan (DRP) participation rate amongst common shareholders was approximately 38 per cent resulting in $342 million reinvested in common equity from the dividends declared July 27, 2022, subsequently paid on October 31, 2022
  • Continued to execute on our $34 billion secured capital program, with $2.6 billion invested in third quarter 2022 • Placed the Louisiana XPress, Elwood Power and Wisconsin Access projects into commercial service adding approximately 1 Bcf/d of U.S. natural gas capacity
  • Sanctioned the US$0.4 billion Gillis Access project, a 1.5 Bcf/d header system that will connect growing supply from the Haynesville basin to Louisiana markets including the rapidly expanding Louisiana LNG export market. The project has an anticipated in-service date of 2024
  • Sanctioned the $0.6 billion Valhalla North and Berland River (VNBR) project in November 2022 that will use non-emitting electric compression to connect migrating supply to key demand markets on our NGTL System with expected in-service in 2026
  • Executed definitive agreements in July 2022 with LNG Canada that addressed and resolved disputes over certain incurred and anticipated costs of the Coastal GasLink pipeline project
  • Established a strategic alliance with the Comisión Federal de Electricidad (CFE) in August 2022 for the completion and development of natural gas infrastructure in central and southeast Mexico
    • Placed the north section of the Villa de Reyes pipeline (VdR North) and the east section of the Tula pipeline (Tula East) into commercial service during the third quarter of 2022
    • Reached a final investment decision to proceed and build the US$4.5 billion Southeast Gateway pipeline, a 1.3 Bcf/d, 715 km offshore natural gas pipeline to serve the southeast region of Mexico with an expected in-service date by mid-2025
  • Issued common equity for gross proceeds of approximately $1.8 billion in August 2022 to fund costs associated with the construction of the Southeast Gateway pipeline.

Outlook:

  • 2022 comparable EBITDA is expected to be higher than 2021 and 2022 comparable earnings per common share outlook is expected to be consistent with 2021. We continue to monitor the impact of changes in energy markets, our construction projects and regulatory proceedings as well as COVID-19 for any potential effect on our 2022 comparable EBITDA and comparable earnings per share.
  • Our total capital expenditures for 2022 are now expected to be approximately $9.5 billion. The increase from the amount outlined in the 2021 Annual Report is primarily due to 2022 installments of approximately $1.3 billion for partner equity contributions to the Coastal GasLink Pipeline Limited Partnership (Coastal GasLink LP) in accordance with revised agreements with Coastal GasLink LP. In addition, approximately US$0.7 billion in capital expenditures are expected in 2022 related to the construction of the Southeast Gateway pipeline subsequent to the final investment decision (FID) reached with the CFE in August 2022. Refer to the Recent developments section for additional information on Coastal GasLink and the Southeast Gateway pipeline. Finally, higher project costs are expected for the NGTL System reflecting inflationary pressures on labour and materials, additional regulatory conditions and other factors. We continue to monitor developments on construction projects, focus on cost mitigation strategies and assess market conditions as well as the impact of COVID-19 for further changes to our overall 2022 capital program. 

See the full Earnings Release here


Stella-Jones Inc. (SJ-T) released its third-quarter 2022 results on Wednesday, November 9, 2022, before markets opened.

“Stella-Jones delivered strong results this quarter, reflecting the robust growth of our infrastructure-related product sales and the normalization of residential lumber sales,” said Éric Vachon, President and CEO of Stella-Jones. “Our performance demonstrates Stella-Jones’ ability to capitalize on growing utility poles demand, amplified by increased infrastructure spend and broadband network expansion programs. It also highlights the stability of our railway ties business and unique value proposition we deliver to our residential lumber customers. It is this resilience, in the face of inflationary pressures and supply chain constraints, that reaffirms the power of our business model and extensive network.”

–President and Chief Executive Officer, Scott Éric Vachon

Highlights:

  • Sales increased 24% to $842 million, driven by all product categories
  • EBITDA rose by $50 million to $119 million, a margin of 14.1%
  • Net income reached $65 million or $1.07 per share
  • Completed acquisition of wood utility pole manufacturing business of Texas Electric Cooperatives, Inc.
  • Returned $180 million to shareholders in the first nine months of 2022
  • Announced a Normal Course Issuer Bid for 2022-2023

Outlook:

Stella-Jones’ sales are primarily to critical infrastructure-related businesses. While all product categories can be impacted by short-term fluctuations, the business is mostly based on replacement and  maintenance driven requirements, which are rooted in our customers’ long-term planning. Corresponding to this longer-term horizon and to better reflect the expected sales run-rate for residential lumber and reduce the impact of commodity price volatility, in March 2022, the Company provided its financial objectives for 2022 to 2024. Below are key highlights of the 2022-2024 financial objectives with a more comprehensive version, including management assumptions, available in the Company’s MD&A. Management remains confident in the achievement of its three-year strategic guidance.

Key Highlights:

Compound annual sales growth rate in the mid-single digit range from 2019 pre-pandemic levels to 2024;

  • EBITDA margin of approximately 15% for the 2022-2024 period;
  • Capital investment of $90 to $100 million to support the growing demand of its infrastructure-related customer base, in addition to the $50 to $60 million of annual capital expenditures;
  • Residential lumber sales expected to stabilize between 20-25% of total sales while infrastructure-related businesses expected to grow to 75-80% of total sales by 2024;
  • Anticipated returns to shareholders between $500 and $600 million during the three-year period;
  • Leverage ratio of 2.0x-2.5x between 2022-2024, but may temporarily exceed range to pursue acquisitions. 

See the full Earnings Release here


CCL Industries (CCL-B-T) released its third-quarter 2022 results on Wednesday, November 9, 2022, after markets closed.

“In the context of extraordinary inflationary pressures in the developed world, including highly volatile energy markets, plus Covid restrictions in China, I am pleased to report strong third quarter results with a record $0.95 adjusted basic earnings per class B share.”

– Chief Executive Officer, Geoffrey T. Martin

Highlights:

  • Per Class B share: $0.95 adjusted basic earnings up 11.8%; $0.93 basic earnings up 9.4%; currency translation negative $0.01 per share
  • Sales increased 11.4% on 8.8% organic growth, 4.9% acquisition growth partially offset by 2.3% negative currency translation
  • CCL, Avery, Checkpoint and Innovia posted organic sales growth of 13.2%, 0.8%, 5.0% and 1.5%, respectively
  • Operating income improved 11.6%, excluding negative currency translation of 1.4%, with a 14.9% operating margin

Outlook:

“Our fourth quarter outlook is somewhat clouded by the impact of inflation; although the summer speculative European energy hikes subsided and many other commodities moved off highs by some distance, potential for event driven volatility remains. The demand picture is stable but less certain, with ongoing strength in some businesses now offset by slower conditions in others. The economic forecast for 2023 suggests a deterioration of some note over 2022 conditions, but as always, we focus on making progress in both good and challenging times. At today’s Canadian dollar exchange rates, currency translation would be a modest headwind, if sustained, for the fourth quarter of 2022; as weaker European and Asia Pacific currencies more than offset stronger ones in the U.S. and Latin America.”

– Chief Executive Officer, Geoffrey T. Martin 

See the full Earnings Release here


Canadian Tire (CTC-A-T) released its third-quarter 2022 results on Thursday, November 10, 2022, before markets opened.

“In the third quarter, we effectively engaged our loyalty customers, resulting in increased spending per Triangle Member, with total loyalty sales outpacing non-member sales – a trend we expect to continue,” said Greg Hicks, President and CEO, Canadian Tire Corporation. “We remain committed to the strategic growth investments we laid out as part of our Better Connected strategy, and in the near-term, we will face into changing customer demand and a dynamic economic environment with the confidence that our multi-category assortment is well-positioned to meet our customer needs.”

“Throughout its long history, Canadian Tire Corporation has consistently demonstrated the underlying strength and resilience of its business and its ability to deliver steady growth and returns to its shareholders,” said Hicks.

– President and Chief Executive Officer, Greg Hicks

Highlights:

  • Revenue increased 8.1% to $4,228.8 million; Revenue (excluding Petroleum) increased 6.0% over the same period last year, with the Retail and Financial Services segments both contributing to growth; on a year-to-date basis, Revenue was up 11.8%, and Revenue (excluding Petroleum) increased 7.8%
  • Consolidated IBT was $298.6 million, down 19.3% compared to the third quarter of 2021, and $314.5 million, down 19.1%, on a normalized basis
  • Normalized diluted EPS was $3.34, compared to $4.20 in the prior year. Q3 2022 Diluted EPS was $3.14 per share, compared to $3.97 in the prior year.
  • Retail Return on Invested Capital (ROIC) calculated on a trailing twelve-month basis, was 12.5% at the end of the third quarter, compared to 13.2% at the end of the third quarter of 2021, as Average Retail Invested Capital increased over the prior period
  • Refer to the Company’s Q3 2022 Management Discussion and Analysis (MD&A) section 4.1.1 for information on normalizing items and for additional details on events that have impacted the Company in the quarter
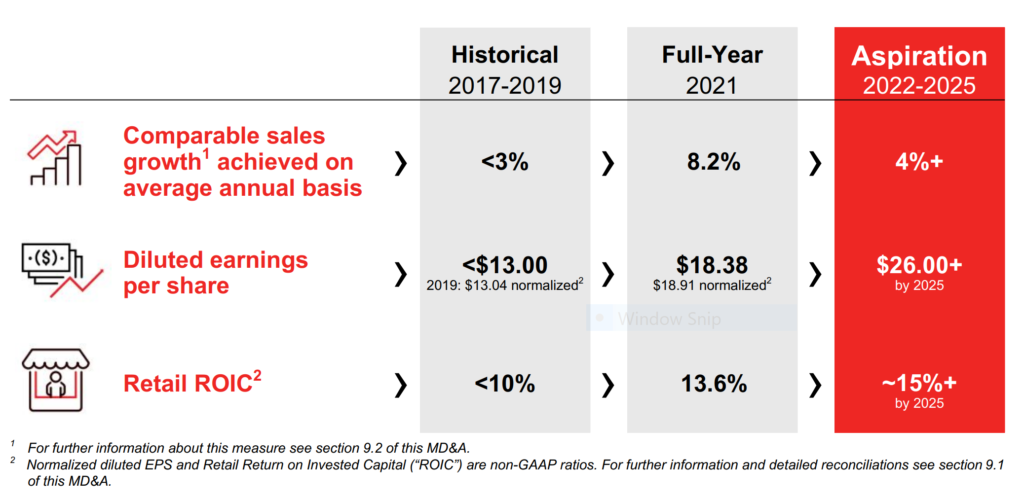
Outlook:

In conjunction with the announcement of its strategic plan, CTC also established the following financial aspirations for fiscal years 2022 to 2025.

See the full Earnings Release here


Stantec  (STN-T) released its third-quarter 2022 results on Thursday, November 10, 2022, after markets closed.

“Our performance in the quarter demonstrates the ongoing strong execution of our strategic plan, while our record backlog reflects the resiliency of our business despite broader economic headwinds,” said Gord Johnston, President and CEO. “As we look ahead to the remainder of the year and into 2023, we continue to see numerous growth opportunities that we are well positioned to capture, bolstering our confidence in our ability to deliver on our strategic plan.”

– President and Chief Executive Officer, Gord Johnston

Highlights:

  • Net revenue of $1.2 billion, up 24.3% over Q3 2021
  • Adjusted diluted EPS1 of $0.86, up 19.4% over Q3 2021
  • Backlog of $6.2 billion, up 20.2% since December 31, 2021

Outlook:

Stantec reaffirms full year 2022 guidance for adjusted diluted EPS growth of 22% to 26% and net revenue growth of 18% to 22%, both compared to 2021, and for adjusted EBITDA margin in the range of 15.3% to 16.3%. Stantec further anticipates delivering adjusted return on invested capital of greater than 10.0% for 2022, compared to earlier guidance of greater than 10.5%. This is largely due to the disruption to cash flows arising from the integration of Cardno, which has resulted in higher than anticipated average debt outstanding for the year. Stantec anticipates cash flows and debt levels normalizing by the end of this year as the financial integration work winds up.

See the full Earnings Release here


Algonquin Power & Utilities (AQN-N) released its third-quarter 2022 results on Friday, November 11, 2022, before markets opened.

“It was a challenging third quarter. Despite year-over-year growth in Adjusted EBITDA, our results for the quarter came in below our expectations and were negatively impacted by increasing interest rates and the timing of tax incentives related to certain renewable energy projects. Our underlying businesses remain strong; however, we are not immune to the macroeconomic environment. Our team is focused on identifying and implementing the necessary adjustments while executing on our three pillars of Growth, Operational Excellence and Sustainability to drive shareholder value over the long-term.”

– President and Chief Executive Officer, Arun Banskota

Highlights:

  • Adjusted EBITDA of $276.1 million, an increase of 10% compared to the third quarter of 2021.
  • Adjusted Net Earnings of $73.5 million, a decrease of 25% compared to the third quarter of 2021. Adjusted Net Earnings was negatively impacted year-over-year by higher interest expense of $23.3 million as a result of borrowings to support growth and higher interest rates. The Company also had lower year-over-year recognition of investment tax credits and production tax credits of $17.1 million, which included revised estimates associated with renewable projects that are now expected to be placed in service in 2023.
  • Adjusted Net Earnings per common share of $0.11, a decrease of 27% compared to the third quarter of 2021.

Outlook:

  • Updated 2022 Adjusted Net Earnings Per Common Share Estimate – In light of challenging macroeconomic conditions (including higher interest rates and inflation), delays in the construction and completion of certain of the Company’s renewable energy projects, and anticipated delays in connection with certain rate decisions, among other factors, the Company is updating its previously-disclosed Adjusted Net Earnings per common share estimate for the 2022 fiscal year from a range of $0.72-$0.77 to a range of $0.66-$0.69. This revised estimate is based on, and should be read in conjunction with, the assumptions set out under “Outlook – Updated 2022 Adjusted Net Earnings Per Common Share Estimate” and “Caution Concerning Forward-Looking Statements and Forward-Looking Information” in AQN’s Management Discussion & Analysis for the three and nine months ended September 30, 2022 (the “Interim MD&A”), which will be available on SEDAR, EDGAR and the Company’s web site. Please also refer to “Caution Regarding Forward-Looking Information” and “Non-GAAP Measures” below.
  • Update on Longer-Term Targets – Given the challenging macroeconomic environment, which is expected to continue into 2023, the Company is evaluating its longer-term targets and financial expectations. The Company intends to provide further details at its upcoming Investor and Analyst Day, expected to be held in early 2023. 

See the full Earnings Release here


Emera Inc. (EMA-T) released its third-quarter 2022 results on Friday, November 11, 2022, before markets opened.

“In the face of the devastating storm impacts and extensive system outages resulting from Hurricanes Fiona and Ian, the restoration efforts of our teams in Nova Scotia and Tampa were remarkable,” said Scott Balfour, President and CEO of Emera Inc. “For the quarter, we continued to invest in meeting our customers needs for cleaner, reliable and cost-effective energy, and in so doing also delivered for our shareholders. Emera’s solid 5% growth in year-to-date earnings per share, and 12% growth in quarterly earnings per share year-over-year was principally driven by continued strong performance from our Florida utilities. Looking forward, continuing strong economic and customer growth in Florida is also supporting our updated $8-$9 billion capital plan and 7- 8% consolidated rate base growth over the 2023 – 2025 period, with approximately 75% of our capital plan expected to be invested in Tampa Electric and Peoples Gas.” 

– President and Chief Executive Officer, Scott Balfour

Highlights:

  • Quarterly adjusted EPS increased $0.08 or 12% to $0.76 compared to $0.68 in Q3 2021. Quarterly reported EPS increased $0.90 to $0.63 in Q3 2022 compared to a net loss per common share of $(0.27) in Q3 2021 due to lower mark-to-market (“MTM”) losses in 2022.
  • Year-to-date, adjusted EPS increased $0.10 or 5% to $2.27 compared to $2.17 in Q3 2021. Year-to-date reported EPS increased by $1.02 to $1.75 from $0.73 in 2021 due to lower MTM losses in 2022.
  • Adjusted EPS contributions from regulated utilities increased 11% for the quarter and 12% year-to-date primarily driven by the impact of favourable weather and new rates at Tampa Electric, as well as from customer growth at both Tampa Electric and People’s Gas (“PGS”). Higher marketing and trading margin increased adjusted EPS1 by $0.05 for the quarter due to higher natural gas prices and volatility, which created profitable opportunities for Emera Energy Services (“EES”). These increases were partially offset by higher corporate costs, and a higher share count.
  • On track to deploy $2.7 billion of capital investment in 2022, principally focused on decarbonization and reliability investments across the portfolio.

Outlook:

The energy and services company said it was on track to deploy $2.7 billion of capital investment in 2022, principally focused on decarbonization and reliability investments across the portfolio.

“Emera’s solid 5% growth in year-to-date earnings per share, and 12% growth in quarterly earnings per share year-over-year was principally driven by continued strong performance from our Florida utilities,” Scott Balfour, President and CEO of Emera.

“Looking forward, continuing strong economic and customer growth in Florida is also supporting our updated $8-$9 billion capital plan and 7-8% consolidated rate base growth over the 2023-2025 period, with approximately 75% of our capital plan expected to be invested in Tampa Electric and Peoples Gas,” he said. 

See the full Earnings Release here

Below is a snapshot of ‘The List’ from last Friday’s close. For a sortable version of ‘The List’, please click on The List menu item.

‘The List’ is not meant to be a template for investors to copy exactly. Instead, its purpose is to provide investment ideas and a real-time illustration of dividend growth investing in action. It is not a ‘Buy List’ nor does it reflect the composition or returns of our Magic Pants Wealth-Builder (CDN) Portfolio. It is only a starting point for our analysis and discussion.

The List (2022)
Last updated by BM on November 11, 2022

*Note: The following graph is wide, you can scroll to the right on your device to see more of the data.

SYMBOL COMPANY YLD PRICE YTD % DIV YTD % STREAK
AQN-N Algonquin Power & Utilities 7.6% $9.30 -35.2% $0.70 5.4% 11
ATD-T Alimentation Couche-Tard Inc. 0.7% $62.90 20.7% $0.44 18.1% 12
BCE-T Bell Canada 5.8% $62.53 -5.1% $3.64 4.0% 13
BIP-N Brookfield Infrastructure Partners 3.8% $37.95 -6.8% $1.44 5.9% 14
CCL-B-T CCL Industries 1.6% $58.98 -13.0% $0.96 14.3% 20
CNR-T Canadian National Railway 1.8% $161.97 4.6% $2.93 19.1% 26
CTC-A-T Canadian Tire 3.7% $156.79 -14.4% $5.85 21.1% 11
CU-T Canadian Utilities Limited 5.0% $35.62 -2.7% $1.78 1.0% 50
DOL-T Dollarama Inc. 0.3% $77.34 22.0% $0.22 9.2% 11
EMA-T Emera 5.2% $51.96 -17.0% $2.68 4.1% 15
ENB-T Enbridge Inc. 6.2% $55.47 12.0% $3.44 3.0% 26
ENGH-T Enghouse Systems Limited 2.3% $31.20 -32.0% $0.72 16.3% 15
FNV-N Franco Nevada 0.9% $141.65 4.1% $1.28 10.3% 14
FTS-T Fortis 4.1% $53.46 -11.6% $2.17 4.3% 48
IFC-T Intact Financial 2.1% $193.74 18.3% $4.00 17.6% 17
L-T Loblaws 1.4% $109.78 6.9% $1.54 12.4% 10
MGA-N Magna 2.9% $62.74 -23.1% $1.80 4.7% 12
MRU-T Metro 1.5% $72.10 7.5% $1.10 12.2% 27
RY-T Royal Bank of Canada 3.8% $131.68 -3.8% $4.96 14.8% 11
SJ-T Stella-Jones Inc. 1.7% $46.41 14.1% $0.80 11.1% 17
STN-T Stantec Inc. 1.1% $65.72 -6.4% $0.71 6.8% 10
TD-T TD Bank 4.0% $88.44 -11.0% $3.56 12.7% 11
TFII-N TFI International 1.0% $103.94 -6.1% $1.08 12.5% 11
TIH-T Toromont Industries 1.5% $102.45 -9.9% $1.52 15.2% 32
TRP-T TC Energy Corp. 5.6% $64.02 7.2% $3.57 4.4% 21
T-T Telus 4.6% $29.02 -2.5% $1.33 6.2% 18
WCN-N Waste Connections 0.7% $136.25 1.6% $0.95 11.8% 12
Averages 3.0% -3.0% 10.3% 18

MP Market Review – November 04, 2022

Last updated by BM on November 07, 2022

Summary

  • This article is part of our weekly series (MP Market Review) highlighting the performance and activity from the previous week related to the financial markets and Canadian dividend growth companies we follow on ‘The List’.
  • Last week, ‘The List’ was essentially flat with a minus -4.6% YTD price return (capital). Dividend growth of ‘The List’ increased to +10.4% YTD, demonstrating the rise in income over the last year.  
  • Last week, there were two dividend increases from companies on ‘The List’.
  • Last week, there were seven earnings reports from companies on ‘The List’.
  • Nine companies on ‘The List’ are due to report earnings this week.
  • Are you looking to build an income portfolio of your own? When you become a premium subscriber, you get exclusive access to the MP Wealth-Builder Model Portfolio (CDN) and subscriber-only content. Start building real wealth today! Learn More

“It is very premature, in my view, to think about or be talking about pausing our rate hikes. We still have some ways to go. And incoming data since our last meeting suggest that the ultimate level of interest rates will be higher than previously expected.”

– Jerome Powell, US Federal Reserve Chair

With that one statement, the markets came back to reality. What had been a one-week equities rally quickly ended during Mr. Powell’s post-announcement new conference.

Below is a summary of the Q3 earnings reports from some companies on ‘The List’ last week. Our good dividend growers seem to be doing well this year, but there are a few mentions of ‘uncertain times’ ahead and a slowing economy, which should make us wary of what lies ahead.

One of the best parts of having a blog is interacting with readers and subscribers to help us become better investors. We wanted to share one such conversation with you this week.

This week, we received an email from a reader who was ready to start putting his hard-earned capital to work. We never know the individual goals of each investor who follow the blog, so we usually hold back on our thoughts about what they choose to invest in. However, we feel that his thoughts can be a coaching moment for others.

The reader is a fan of dividend growth investing but is still learning our process. He wanted to invest in a US company simply because it is undervalued and in a sector he liked. In addition, he wanted to invest in some of the companies on ‘The List’ in the same industry solely because they are quality companies (ignoring valuation). Although valuation and quality are cornerstone principles in what we do, we must be careful in applying these concepts.

Valuation is essential, but it should only be applied to quality companies. Check out our ‘quality indicators’ for a good playbook for determining a quality dividend growth company.

Overvaluing quality companies is not good either, as it will impact your future returns. A large component of the pullback in prices so far this year was due to overvaluation last year. You don’t want to be caught with a quality company whose P/E is well above its average (when you buy) and wondering why the stock price (capital return) remains below the purchase price well into the future, even though the earnings and dividends are growing.

Fortis was a great example of overvaluation back in April of this year. Fortis is one of the highest-quality dividend growth companies in Canada, with a record of 49 straight years of dividend growth, but it was trading far above its sensible price range. An investor in Fortis back in April is now down -17.4%, and it could be a while before they get back to the price they paid earlier this year. The price has retreated closer to its average P/E (blue line).

Remember that return is yield plus dividend growth when purchased at a sensible price. You will need all three to win. Be patient in these ‘uncertain times’.

Performance of ‘The List’

At the end of the post is a snapshot of ‘The List’ from last Friday’s close. Feel free to click on the ‘The List’ menu item above for a sortable version.

Last week, ‘The List’ was essentially flat with a minus -4.6% YTD price return (capital). Dividend growth of ‘The List’ increased to +10.4% YTD, demonstrating the rise in income over the last year.

The best performers last week on ‘The List’ were TFI International (TFII-N), up +3.70%; Waste Connections (WCN-N), up +2.73%; and Enbridge Inc. (ENB-T), up +1.96%.

CCL Industries (CCL-B-T) was the worst performer last week, down -6.35%.

Recent News

We’re heading into a much different world. Investors in stocks, bonds and real estate aren’t going to like it (Globe & Mail)

“In my opinion, financial markets are too optimistic about inflation and interest rates in the long run and the effect they will have on economic growth.”

The author mentions that world events have led to companies bringing production back to North America, where output costs are higher and ill-planned attempts by governments and Central Banks to spend their way out of market downturns only ‘kicks the can down the road’, which will result in higher taxes eventually.

Add the underinvestment in the oil and gas industry in the name of climate change and you have all commodities becoming more expensive at a time when you need them the most (to fund renewable energy and electric vehicle production).

Slower growth and higher inflation from what we have been used to seem almost inevitable.

An industry leader that’s consistently delivered annual double-digit price returns and dividend growth (Globe & Mail)

Nice analysis of Waste Connections Inc. (WCN-N). They are one of the companies on ‘The List’. Although Waste Connections Inc. ticks off a lot of boxes for us as an investment, we are not comfortable with the valuation of the stock. For high-growth, low-yield companies like (WCN-N) it may take time to generate the income you are looking for, but the capital returns can ease the pain. Coming into this year, Waste Connections Inc. delivered a +19.8% compound annual growth rate (CAGR) over the last ten years!

Nine companies on ‘The List’ are due to report earnings this week.  

Franco Nevada (FNV-N) will release its third-quarter 2022 results on Monday, November 7, 2022, before markets open.

Intact Financial (IFC-T) will release its third-quarter 2022 results on Tuesday, November 8, 2022, after markets close. 

TC Energy (TRP-T) will release its third-quarter 2022 results on Wednesday, November 9, 2022, before markets open. 

Stella-Jones Inc. (SJ-T) will release its third-quarter 2022 results on Wednesday, November 9, 2022, before markets open. 

CCL Industries (CCL-B-T) will release its third-quarter 2022 results on Wednesday, November 9, 2022, after markets close. 

Canadian Tire (CTC-A-T) will release its third-quarter 2022 results on Thursday, November 10, 2022, before markets open. 

Stantec  (STN-T) will release its third-quarter 2022 results on Thursday, November 10, 2022, after markets close. 

Algonquin Power & Utilities (AQN-N) will release its third-quarter 2022 results on Friday, November 11, 2022, before markets open. 

Emera Inc. (EMA-T) will release its third-quarter 2022 results on Friday, November 11, 2022, before markets open.

Dividend Increases

Two companies on ‘The List’ announced a dividend increase last week.

Waste Connections (WCN-N) on Thursday said it increased its 2022 quarterly dividend from $0.23 to $0.255 per share, payable December 1, 2022, to shareholders of record on November 16, 2022.

This represents a dividend increase of +11%, marking the 13th straight year of dividend growth for this quality waste management company.

Telus (T-T) on Friday said it increased its 2023 quarterly dividend from $0.339 to $0.3511 per share, payable January 3, 2023, to shareholders of record on December 9, 2022.

This represents a dividend increase of +3.5%, marking the 19th straight year of dividend growth for this quality telco.

Earnings Releases

Last week, there were seven earnings reports from companies on ‘The List’. Let’s get started with Canadian industrial company Toromont Industries.

Toromont Industries (TIH-T) released its third-quarter 2022 results on Tuesday, November 1, 2022, after markets closed.

“The team delivered solid operating and financial performance in the third quarter. The persistent supply constraint pressures, market and economic variables continue to contribute to a fluid and complex operating environment,” stated Scott J. Medhurst, President and Chief Executive Officer of Toromont Industries Ltd. “The Equipment Group reported good utilization activity in rental and positive product support demand, while uncertainties persist in timing of equipment and parts deliveries. CIMCO revenues improved in the quarter on project construction and higher product support activity. Across the organization, we remain committed to our operating disciplines, after-market strategies and customer solutions, as we manage through these uncertain conditions.”

– Chief Executive Officer, Scott Medhurst

Highlights:

  • Revenues increased $142.4 million or 14% in the third quarter. Equipment sales were up 11% compared to prior year, with the Equipment Group up 10% and CIMCO package revenues up 19%, however both groups continue to experience delays in project construction and deliveries due to supply chain constraints in the current year. Product support revenues were 19% higher on increased demand, while rental revenues grew 13% on a larger fleet and higher utilization.
  • Revenues increased $150.1 million (5%) to $3.1 billion for the year-to-date period, as the improved activity in rentals (up 19%) and product support (up 14%) offset reductions in equipment and package revenues (down 5%) against a tough comparable last year, coupled with continuing supply chain issues.
  • Operating income increased 26% in the quarter on higher revenues, a favourable sales mix (higher percentage of rentals and product support revenues to total revenues) and improved gross margins. Expense levels were up 13% reflecting planned increases and higher activity levels, as well as certain inflationary impacts.
  • Operating income increased 26% in the year-to-date period, and was 13.4% of revenues compared to 11.2% in the similar period last year, reflecting the continued favourable sales mix and improved gross margins, offset by a higher expense ratio.
  • Net earnings increased $29.4 million or 31% in the quarter versus a year ago to $123.1 million or $1.50 EPS (basic).
  • For the year-to-date period, net earnings increased $67.2 million or 30% to $294.3 million, or $3.57 EPS (basic).
  • Bookings for the third quarter decreased 23% compared to last year and decreased 24% on a year‑to‑date basis. Both the Equipment Group and CIMCO reported strong bookings in 2021, after a period of lower activity stemming from pandemic restrictions.
  • Backlogs were $1.4 billion at September 30, 2022, compared to $1.1 billion at September 30, 2021, reflecting strong order activity over the past year coupled with ongoing supply constraints.

Outlook:

“Activity remained sound with favourable backlog levels, but supply chains continue to be challenged. Pandemic challenges remain and we continue to measure inflationary pressures and supply-demand dynamics as the economic environment continues to evolve and change.”

– Chief Executive Officer, Scott Medhurst

 See the full Earnings Release here


Brookfield Infrastructure Partners (BIP-N) released its third-quarter 2022 results on Wednesday, November 2, 2022, before markets opened.

“Brookfield Infrastructure had record quarterly results as a function of our high quality asset base, proven risk management approach and execution of our asset rotation strategy. Our strategic and financial principles provide a basis to capitalize on deep value investments when these opportunities arise.”

– Chief Executive Officer, Sam Pollock

Highlights:

  • Brookfield Infrastructure reported net income of $113 million for the three-month period ended September 30, 2022 compared to $413 million in the prior year. Current year results benefited from recent acquisitions and organic growth across our base business, as well as mark-to-market gains on our foreign currency hedging program. Prior year results included a gain of approximately $425 million recognized on the sale of our U.S. district energy business. After removing the impact of disposition gains, net income increased by $125 million relative to the prior year.
  • Funds from operations (FFO) for the third quarter was $525 million, increasing 24% relative to the comparable period. Organic growth for the quarter was robust at 10%, reflecting the benefits of elevated inflation levels impacting tariffs and the commissioning of approximately $1.2 billion of capital projects in the last 12 months. Additionally, approximately $2 billion of capital was deployed in acquisitions over the same period that contributed to results.

Outlook:

“In August, we announced a partnership with Intel Corporation to invest in a $30 billion semiconductor foundry in Arizona. Brookfield will be providing approximately $15 billion over the construction period for a 49% interest in the facility. The majority of our capital commitment has been sourced from non-recourse debt, with base interest rate exposure fully hedged concurrent with signing. Moreover, the majority of the Brookfield’s approximately $2 billion equity investment ($500 million net to BIP) is back-end weighted closer to the operational phase of the project.

This investment is structured to achieve an attractive risk-adjusted return. We draw parallels to other data investments such as hyperscale data centers that are generally contracted on a long-term basis, with highly creditworthy counterparties, where we do not assume technological risk. In this instance, we view Intel to be a creditworthy and market-leading partner. The transaction is expected to close by the end of 2022 and is thematically an example of the large-scale capital required to support the onshoring of critical supply chains.

For the balance of the year, our focus will be on closing the remaining two announced transactions, HomeServe and DFMG, in Q4 2022 and Q1 2023, respectively. Once closed, we will transition our focus to the execution of our growth plans in both businesses.

  • At HomeServe, we are splitting the company’s U.S. and European operations to integrate them with existing portfolio businesses in each geography. We plan to accelerate growth by expanding our residential infrastructure product and service offering to a wider customer base.
  • At DFMG, we are acquiring a marquee portfolio of 36,000 towers in Germany and Austria that also includes a greenfield development portfolio of an additional 5,200 build-to-suit towers. These additional towers are to be constructed over the next five-years and underpinned by the credit quality of Deutsche Telekom. In addition to the built-in organic growth, we plan to use this business as a platform for follow-on opportunities in the fragmented European telecom tower market.

On the capital recycling front, earlier this year, we signed agreements to sell three mature businesses for approximately $600 million of proceeds. These sales were in addition to the sale of our U.S. container terminal that closed earlier this year for approximately $350 million. Of the three secured sales, our New Zealand telecom tower portfolio sale closed November 1st, our Brazilian electricity transmission lines are expected to close in November and the Indian toll roads are on track to close by year end. In addition, several sales processes are underway that, combined, are expected to generate approximately $1.5 billion of proceeds.”

See the full Earnings Release here


Waste Connections (WCN-N) released its third-quarter 2022 results on Wednesday, November 2, 2022, after markets closed.

“Strong execution once again provided for better than expected results, driven in the third quarter by continued acceleration of solid waste pricing to 10.1% and higher E&P waste activity, along with acquisitions closed during the period. Most notably, we overcame 50 basis points in incremental headwinds, primarily from the precipitous decline in recycled commodity values in September, to beat our outlook and expand adjusted EBITDA margin both sequentially and on a year-over-year basis, excluding the dilutive impact from acquisitions completed since the year ago period,” said Worthing F. Jackman, President and Chief Executive Officer.

– President and Chief Executive  Officer, Worthing F. Jackman

Highlights:

  • Increasing solid waste pricing growth, E&P waste activity and acquisition contribution once again drive better than expected quarterly results
  • Revenue of $1.880 billion, up 17.7%
  • Net income of $236.9 million, and adjusted EBITDA(b) of $588.1 million, up 16.3%
  • Adjusted EBITDA margin of 31.3% of revenue, above outlook and up 20 basis points year over year, excluding acquisitions
  • Net income of $0.92 per share, and adjusted net income(b) of $1.10 per share
  • Year to date net cash provided by operating activities of $1.500 billion and adjusted free cash flow of $929.0 million, or 17.4% of revenue
  • Year to date signed or closed acquisitions with approximately $570 million of total annualized revenue
  • Increases regular quarterly dividend by 10.9%

Outlook:

  • Revenue is estimated to be approximately $7.190 billion, as compared to our previously revised revenue outlook of approximately $7.125 billion.
  • Net income is estimated to be approximately $836.7 million, and adjusted EBITDA is estimated to be approximately $2.210 billion, or about 30.7% of revenue, as compared to our previously revised adjusted EBITDA outlook of $2.190 billion or 30.7% of revenue.
  • Capital expenditures are estimated to be approximately $850 million, in line with our original outlook.
  • Net cash provided by operating activities is estimated to be approximately $1.963 billion, and adjusted free cash flow(b) is estimated at approximately $1.160 billion, or about 16.1% of revenue, as compared to our previously revised adjusted free cash flow outlook of $1.160 billion or 16.3% of revenue.

See the full Earnings Release here


Bell Canada (BCE-T) released its third-quarter 2022 results on Thursday, November 3, 2022, before markets opened.

“The Bell team’s continued excellence in executing on our strategy and customer-centric approach, combined with our leading networks has delivered strong results this quarter, firmly placing Bell in a solid competitive position as we head into the end of the year.

We’re seeing clear demand from Canadians for differentiated fibre Internet services and fast, reliable wireless networks. We experienced over 400,000 net activations across our wireline and wireless networks, with our highest-ever number of total mobile phone net additions, and we also gained a significant share of Internet subscriber growth with over 95,000 new net fibre-to-the-home customers this past quarter, up 33% over last year and our best-ever result.”

– President and Chief Executive Officer, Mirko Bibic

Highlights:

  • Leading advanced mobile and fibre networks delivered record 401,132 total broadband net customer activations — 224,343 mobile phone, 49,044 mobile connected devices; 89,652 retail Internet and 38,093 IPTV — up 50.3% y/y
  • 2% consolidated revenue growth delivered 1.2% higher adjusted EBITDA1 as $38 million in storm and inflationary cost pressures2 absorbed in the quarter
  • Net earnings of $771 million, down 5.2%, with net earnings attributable to common shareholders of $715 million, or $0.78 per common share, down 6.0%; adjusted net earnings1 of $801 million generated adjusted EPS1 of $0.88, up 7.3%
  • Excellent wireless operating results: strong revenue and adjusted EBITDA growth of 7.4% and 7.8%, respectively; best-ever mobile phone net subscriber activations of 224,343, up 64.4%; lowest Q3 postpaid churn3 rate of 0.90%; and 2.2% higher mobile phone blended ARPU4
  • Highest retail Internet net activations in 17 years, up 36.3% to 89,652, drove 8% residential Internet revenue growth; on track to complete 80% of broadband Internet buildout plan by end of 2022
  • Bell Media digital revenue5 up 40% contributing to stable total media revenue as advertiser spending slows due to macroeconomic conditions
  • Reconfirming all 2022 financial guidance targets

Outlook:

BCE confirmed its financial guidance targets for 2022, as provided on February 3, 2022, as follows:

For the full-year 2022, we expect growth in adjusted EBITDA, a reduction in contributions to post-employment benefit plans and payments under other post-employment benefit plans, and lower cash income taxes, will drive higher free cash flow.

See the full Earnings Release here

Telus (T-T) released its third-quarter 2022 results on Friday, November 4, 2022, before markets opened.

“In the third quarter, the TELUS team once again demonstrated continued execution excellence, characterized by the potent combination of industry-leading customer growth, resulting in strong operational and financial results across our business. Our robust performance reflects the chemistry of our globally leading broadband

 –  President and Chief Executive Officer, Darren Entwistle

Highlights:

  • Industry-leading total Mobile and Fixed customer growth of 347,000, up 27,000 over last year, and our strongest quarter on record, driven by higher year-over-year customer growth across our portfolio of leading Mobility and Fixed services
  • Strong, high-quality mobile phone net additions of 150,000, a 15,000 increase over the prior year, the best quarterly result since 2010; record high connected device net additions of 124,000, up 14,000 year-over-year
  • Robust wireline customer net additions of 73,000, powered by world-leading customer loyalty in combination with TELUS’ PureFibre network, including sustained momentum on accretive copper-to-fibre migrations as TELUS continues to successfully execute on its accelerated broadband expansion plan
  • Consolidated Revenue, Adjusted EBITDA, Net Income and Earnings Per Share growth of 10 per cent, 11 per cent, 54 per cent and 48 per cent, respectively, reflecting consistent execution excellence; strong Free Cash Flow growth of 63 per cent
  • TELUS International’s strong growth profile to be amplified by the acquisition of WillowTree, significantly enhancing our end-to-end transformation capabilities for customers around the world
  • Quarterly dividend increased to $0.3511, an increase of 7.2 per cent over the same period last year, representing a yield of approximately 5 per cent at current share price, supported by leading Adjusted EBITDA growth and significant expected cash flow expansion beginning in 2023

Outlook:

“The company also said it has “recalibrated” the full-year outlook for 2022 to reflect prolonged macroeconomic uncertainty and expected potential impacts on its business. It now expects revenue in the range of US$2,450 to US$2,490 million, representing growth of 11.7% to 13.5%. It previously expected revenue in the range of US$2,550 to US$2,600 million.

It changed its guidance for adjusted EBITDA margin in the range of 24.4% to 24.6%, from about 24% previously. The company kept its guidance unchanged for adjusted diluted EPS in the range of US$1.18 to US$1.23.”

See the full Earnings Release here

Enbridge Inc. (ENB-T) released its third-quarter 2022 results on Friday, November 4, 2022, before markets opened.

“While global economies and energy markets are experiencing significant volatility, Enbridge’s premium North America franchises, resilient commercial underpinnings, and our increasing inventory of organic opportunities put us in a great position to continue to grow into the future. The fundamentals of our business continue to be positive; it’s clear that the world needs all forms of energy to meet future demand, especially in the context of the energy security, reliability, and affordability challenges that everyone is faced with in today’s environment

– President and Chief Executive Officer, Al Monaco

Highlights:

  • Third quarter GAAP earnings of $1.3 billion or $0.63 per common share, compared with GAAP earnings of $0.7 billion or $0.34 per common share in 2021
  • Adjusted earnings* of $1.4 billion or $0.67 per common share*, compared with $1.2 billion or $0.59 per common share in 2021
  • Adjusted earnings before interest, income taxes and depreciation and amortization (EBITDA)* of $3.8 billion, compared with $3.3 billion in 2021
  • Cash provided by operating activities of $2.1 billion, compared with $2.3 billion in 2021
  • Distributable cash flow (DCF)* of $2.5 billion or $1.24 per common share*, compared with $2.3 billion or $1.13 per common share in 2021
  • Reaffirmed 2022 full year guidance range for EBITDA of $15.0 billion to $15.6 billion and DCF per share of $5.20 to $5.50
  • Secured an expansion of B.C. Pipeline’s T-South section adding 300 million cubic feet per day (MMcf/d) of capacity with an estimated capital cost of up to $3.6 billion
  • Launched a binding open season for a second expansion of B.C. Pipeline’s T-North section adding approximately 500MMcf/d of capacity
  • Formed strategic partnership with 23 First Nation and Métis communities selling a 11.57% non-operating interest in seven Regional Oil Sands pipelines for $1.12 billion
  • Advanced U.S. Gulf Coast oil strategy through increased interest in Gray Oak Pipeline while lowering commodity exposure with reduced interest in DCP Midstream LP; received US$400 million cash
  • Enhanced North American renewable development portfolio with US$270 million acquisition of Tri Global Energy (TGE)
  • Acquired additional 10% ownership interest in Cactus II Pipeline in the Permian bringing Enbridge’s ownership to 30%
  • Sanctioned investment for four additional oil storage tanks at the Enbridge Ingleside Energy Center (EIEC)
  • Secured two new RNG projects in Ontario where Enbridge will invest in gas upgrading and pipeline connections
  • Released Enbridge’s Indigenous Reconciliation Action Plan building on the Company’s growing track record of engagement with Indigenous communities and employees

Outlook:

“We are pleased with our strong third quarter results and year-to-date performance, a testament to the Enbridge team across our four core businesses. We’re tracking to plan and expect to achieve our 2022 EBITDA and DCF per share guidance. Looking forward, our low-risk business model provides us with excellent visibility to growing cash flows and our assets are underpinned by long-term contracts or cost-of-service frameworks that provide built-in inflation protections.”

See the full Earnings Release here


Magna (MGA-N) released its third-quarter 2022 results on Friday, November 4, 2022, before markets opened.

“In the third quarter, we managed through an operating environment that remains challenged by ongoing production schedule volatility and elevated energy costs in Europe. We continue to take steps to address the short-term industry turbulence as well as operating inefficiencies at certain facilities, while remaining focused on our go-forward strategy and value creation.”

– Chief Executive Officer, Swamy Kotagiri

Highlights:

  • Sales increased 17% to $9.3 billion, compared to a global light vehicle production increase of 24%
  • Excluding foreign currency translation and acquisitions net of divestitures, sales increased 27%
  • Diluted earnings per share and adjusted diluted earnings per share increased to $1.00 and $1.07, respectively, compared to $0.04 and $0.56 last year
  • Returned $305 million to shareholders through share repurchases and dividends
  • Reduced outlook mainly reflects expected lower vehicle production in North America and Europe and higher operating inefficiencies

Outlook:

“We first disclose a full-year Outlook annually in February, with quarterly updates. The following Outlook is an update to our previous Outlook in July 2022.”

Below is a snapshot of ‘The List’ from last Friday’s close. For a sortable version of ‘The List’, please click on The List menu item.

‘The List’ is not meant to be a template for investors to copy exactly. Instead, its purpose is to provide investment ideas and a real-time illustration of dividend growth investing in action. It is not a ‘Buy List’ nor does it reflect the composition or returns of our Magic Pants Wealth-Builder (CDN) Portfolio. It is only a starting point for our analysis and discussion.

The List (2022)
Last updated by BM on November 04, 2022

*Note: The following graph is wide, you can scroll to the right on your device to see more of the data.

SYMBOL COMPANY YLD PRICE YTD % DIV YTD % STREAK
AQN-N Algonquin Power & Utilities 6.4% $11.06 -22.9% $0.70 5.4% 11
ATD-T Alimentation Couche-Tard Inc. 0.7% $61.65 18.3% $0.44 18.1% 12
BCE-T Bell Canada 5.9% $61.75 -6.3% $3.64 4.0% 13
BIP-N Brookfield Infrastructure Partners 4.0% $36.19 -11.1% $1.44 5.9% 14
CCL-B-T CCL Industries 1.6% $61.93 -8.6% $0.96 14.3% 20
CNR-T Canadian National Railway 1.8% $160.67 3.7% $2.93 19.1% 26
CTC-A-T Canadian Tire 3.8% $152.15 -16.9% $5.85 24.5% 11
CU-T Canadian Utilities Limited 5.0% $35.28 -3.6% $1.78 1.0% 50
DOL-T Dollarama Inc. 0.3% $79.41 25.2% $0.22 9.2% 11
EMA-T Emera 5.4% $49.82 -20.4% $2.68 4.1% 15
ENB-T Enbridge Inc. 6.4% $54.17 9.3% $3.44 3.0% 26
ENGH-T Enghouse Systems Limited 2.4% $29.29 -36.1% $0.72 16.3% 15
FNV-N Franco Nevada 1.0% $126.95 -6.7% $1.28 10.3% 14
FTS-T Fortis 4.1% $53.35 -11.8% $2.17 4.3% 48
IFC-T Intact Financial 1.9% $207.66 26.8% $4.00 17.6% 17
L-T Loblaws 1.4% $112.36 9.4% $1.54 12.4% 10
MGA-N Magna 3.2% $56.63 -30.6% $1.80 4.7% 12
MRU-T Metro 1.5% $72.21 7.7% $1.10 12.2% 27
RY-T Royal Bank of Canada 3.9% $127.32 -7.0% $4.96 14.8% 11
SJ-T Stella-Jones Inc. 1.9% $41.52 2.1% $0.80 11.1% 17
STN-T Stantec Inc. 1.1% $65.19 -7.1% $0.71 6.8% 10
TD-T TD Bank 4.0% $87.97 -11.5% $3.56 12.7% 11
TFII-N TFI International 1.2% $92.10 -16.8% $1.08 12.5% 11
TIH-T Toromont Industries 1.5% $104.19 -8.4% $1.52 15.2% 32
TRP-T TC Energy Corp. 5.9% $60.06 0.6% $3.57 4.4% 21
T-T Telus 4.6% $28.70 -3.6% $1.33 6.2% 18
WCN-N Waste Connections 0.7% $136.45 1.8% $0.95 11.8% 12
Averages 3.0% -4.6% 10.4% 18

We buy quality individual dividend growth stocks when they are sensibly priced and hold for the growing income.