Last updated by BM on November 07, 2022
Summary
- This article is part of our weekly series (MP Market Review) highlighting the performance and activity from the previous week related to the financial markets and Canadian dividend growth companies we follow on ‘The List’.
- Last week, ‘The List’ was essentially flat with a minus -4.6% YTD price return (capital). Dividend growth of ‘The List’ increased to +10.4% YTD, demonstrating the rise in income over the last year.
- Last week, there were two dividend increases from companies on ‘The List’.
- Last week, there were seven earnings reports from companies on ‘The List’.
- Nine companies on ‘The List’ are due to report earnings this week.
- Are you looking to build an income portfolio of your own? When you become a premium subscriber, you get exclusive access to the MP Wealth-Builder Model Portfolio (CDN) and subscriber-only content. Start building real wealth today! Learn More
“It is very premature, in my view, to think about or be talking about pausing our rate hikes. We still have some ways to go. And incoming data since our last meeting suggest that the ultimate level of interest rates will be higher than previously expected.”
– Jerome Powell, US Federal Reserve Chair
With that one statement, the markets came back to reality. What had been a one-week equities rally quickly ended during Mr. Powell’s post-announcement new conference.
Below is a summary of the Q3 earnings reports from some companies on ‘The List’ last week. Our good dividend growers seem to be doing well this year, but there are a few mentions of ‘uncertain times’ ahead and a slowing economy, which should make us wary of what lies ahead.
One of the best parts of having a blog is interacting with readers and subscribers to help us become better investors. We wanted to share one such conversation with you this week.
This week, we received an email from a reader who was ready to start putting his hard-earned capital to work. We never know the individual goals of each investor who follow the blog, so we usually hold back on our thoughts about what they choose to invest in. However, we feel that his thoughts can be a coaching moment for others.
The reader is a fan of dividend growth investing but is still learning our process. He wanted to invest in a US company simply because it is undervalued and in a sector he liked. In addition, he wanted to invest in some of the companies on ‘The List’ in the same industry solely because they are quality companies (ignoring valuation). Although valuation and quality are cornerstone principles in what we do, we must be careful in applying these concepts.
Valuation is essential, but it should only be applied to quality companies. Check out our ‘quality indicators’ for a good playbook for determining a quality dividend growth company.
Overvaluing quality companies is not good either, as it will impact your future returns. A large component of the pullback in prices so far this year was due to overvaluation last year. You don’t want to be caught with a quality company whose P/E is well above its average (when you buy) and wondering why the stock price (capital return) remains below the purchase price well into the future, even though the earnings and dividends are growing.
Fortis was a great example of overvaluation back in April of this year. Fortis is one of the highest-quality dividend growth companies in Canada, with a record of 49 straight years of dividend growth, but it was trading far above its sensible price range. An investor in Fortis back in April is now down -17.4%, and it could be a while before they get back to the price they paid earlier this year. The price has retreated closer to its average P/E (blue line).
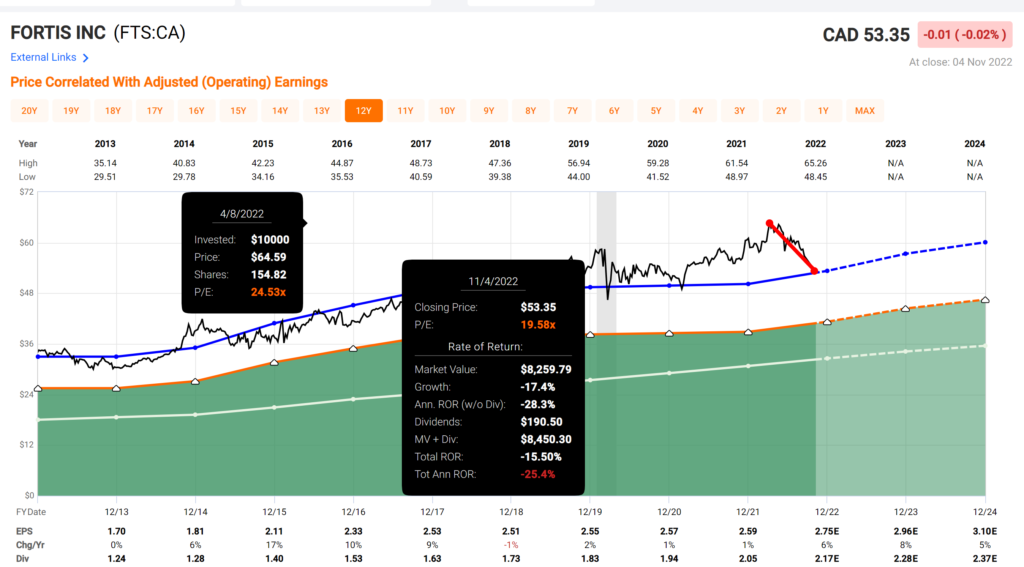
Remember that return is yield plus dividend growth when purchased at a sensible price. You will need all three to win. Be patient in these ‘uncertain times’.
Performance of ‘The List’
At the end of the post is a snapshot of ‘The List’ from last Friday’s close. Feel free to click on the ‘The List’ menu item above for a sortable version.
Last week, ‘The List’ was essentially flat with a minus -4.6% YTD price return (capital). Dividend growth of ‘The List’ increased to +10.4% YTD, demonstrating the rise in income over the last year.
The best performers last week on ‘The List’ were TFI International (TFII-N), up +3.70%; Waste Connections (WCN-N), up +2.73%; and Enbridge Inc. (ENB-T), up +1.96%.
CCL Industries (CCL-B-T) was the worst performer last week, down -6.35%.
Recent News
We’re heading into a much different world. Investors in stocks, bonds and real estate aren’t going to like it (Globe & Mail)
“In my opinion, financial markets are too optimistic about inflation and interest rates in the long run and the effect they will have on economic growth.”
The author mentions that world events have led to companies bringing production back to North America, where output costs are higher and ill-planned attempts by governments and Central Banks to spend their way out of market downturns only ‘kicks the can down the road’, which will result in higher taxes eventually.
Add the underinvestment in the oil and gas industry in the name of climate change and you have all commodities becoming more expensive at a time when you need them the most (to fund renewable energy and electric vehicle production).
Slower growth and higher inflation from what we have been used to seem almost inevitable.
An industry leader that’s consistently delivered annual double-digit price returns and dividend growth (Globe & Mail)
Nice analysis of Waste Connections Inc. (WCN-N). They are one of the companies on ‘The List’. Although Waste Connections Inc. ticks off a lot of boxes for us as an investment, we are not comfortable with the valuation of the stock. For high-growth, low-yield companies like (WCN-N) it may take time to generate the income you are looking for, but the capital returns can ease the pain. Coming into this year, Waste Connections Inc. delivered a +19.8% compound annual growth rate (CAGR) over the last ten years!
Nine companies on ‘The List’ are due to report earnings this week.
Franco Nevada (FNV-N) will release its third-quarter 2022 results on Monday, November 7, 2022, before markets open.
Intact Financial (IFC-T) will release its third-quarter 2022 results on Tuesday, November 8, 2022, after markets close.
TC Energy (TRP-T) will release its third-quarter 2022 results on Wednesday, November 9, 2022, before markets open.
Stella-Jones Inc. (SJ-T) will release its third-quarter 2022 results on Wednesday, November 9, 2022, before markets open.
CCL Industries (CCL-B-T) will release its third-quarter 2022 results on Wednesday, November 9, 2022, after markets close.
Canadian Tire (CTC-A-T) will release its third-quarter 2022 results on Thursday, November 10, 2022, before markets open.
Stantec (STN-T) will release its third-quarter 2022 results on Thursday, November 10, 2022, after markets close.
Algonquin Power & Utilities (AQN-N) will release its third-quarter 2022 results on Friday, November 11, 2022, before markets open.
Emera Inc. (EMA-T) will release its third-quarter 2022 results on Friday, November 11, 2022, before markets open.
Dividend Increases
Two companies on ‘The List’ announced a dividend increase last week.
Waste Connections (WCN-N) on Thursday said it increased its 2022 quarterly dividend from $0.23 to $0.255 per share, payable December 1, 2022, to shareholders of record on November 16, 2022.
This represents a dividend increase of +11%, marking the 13th straight year of dividend growth for this quality waste management company.
Telus (T-T) on Friday said it increased its 2023 quarterly dividend from $0.339 to $0.3511 per share, payable January 3, 2023, to shareholders of record on December 9, 2022.
This represents a dividend increase of +3.5%, marking the 19th straight year of dividend growth for this quality telco.
Earnings Releases
Last week, there were seven earnings reports from companies on ‘The List’. Let’s get started with Canadian industrial company Toromont Industries.
Toromont Industries (TIH-T) released its third-quarter 2022 results on Tuesday, November 1, 2022, after markets closed.
“The team delivered solid operating and financial performance in the third quarter. The persistent supply constraint pressures, market and economic variables continue to contribute to a fluid and complex operating environment,” stated Scott J. Medhurst, President and Chief Executive Officer of Toromont Industries Ltd. “The Equipment Group reported good utilization activity in rental and positive product support demand, while uncertainties persist in timing of equipment and parts deliveries. CIMCO revenues improved in the quarter on project construction and higher product support activity. Across the organization, we remain committed to our operating disciplines, after-market strategies and customer solutions, as we manage through these uncertain conditions.”
– Chief Executive Officer, Scott Medhurst
Highlights:
- Revenues increased $142.4 million or 14% in the third quarter. Equipment sales were up 11% compared to prior year, with the Equipment Group up 10% and CIMCO package revenues up 19%, however both groups continue to experience delays in project construction and deliveries due to supply chain constraints in the current year. Product support revenues were 19% higher on increased demand, while rental revenues grew 13% on a larger fleet and higher utilization.
- Revenues increased $150.1 million (5%) to $3.1 billion for the year-to-date period, as the improved activity in rentals (up 19%) and product support (up 14%) offset reductions in equipment and package revenues (down 5%) against a tough comparable last year, coupled with continuing supply chain issues.
- Operating income increased 26% in the quarter on higher revenues, a favourable sales mix (higher percentage of rentals and product support revenues to total revenues) and improved gross margins. Expense levels were up 13% reflecting planned increases and higher activity levels, as well as certain inflationary impacts.
- Operating income increased 26% in the year-to-date period, and was 13.4% of revenues compared to 11.2% in the similar period last year, reflecting the continued favourable sales mix and improved gross margins, offset by a higher expense ratio.
- Net earnings increased $29.4 million or 31% in the quarter versus a year ago to $123.1 million or $1.50 EPS (basic).
- For the year-to-date period, net earnings increased $67.2 million or 30% to $294.3 million, or $3.57 EPS (basic).
- Bookings for the third quarter decreased 23% compared to last year and decreased 24% on a year‑to‑date basis. Both the Equipment Group and CIMCO reported strong bookings in 2021, after a period of lower activity stemming from pandemic restrictions.
- Backlogs were $1.4 billion at September 30, 2022, compared to $1.1 billion at September 30, 2021, reflecting strong order activity over the past year coupled with ongoing supply constraints.
Outlook:
“Activity remained sound with favourable backlog levels, but supply chains continue to be challenged. Pandemic challenges remain and we continue to measure inflationary pressures and supply-demand dynamics as the economic environment continues to evolve and change.”
– Chief Executive Officer, Scott Medhurst
See the full Earnings Release here
Brookfield Infrastructure Partners (BIP-N) released its third-quarter 2022 results on Wednesday, November 2, 2022, before markets opened.
“Brookfield Infrastructure had record quarterly results as a function of our high quality asset base, proven risk management approach and execution of our asset rotation strategy. Our strategic and financial principles provide a basis to capitalize on deep value investments when these opportunities arise.”
– Chief Executive Officer, Sam Pollock
Highlights:
- Brookfield Infrastructure reported net income of $113 million for the three-month period ended September 30, 2022 compared to $413 million in the prior year. Current year results benefited from recent acquisitions and organic growth across our base business, as well as mark-to-market gains on our foreign currency hedging program. Prior year results included a gain of approximately $425 million recognized on the sale of our U.S. district energy business. After removing the impact of disposition gains, net income increased by $125 million relative to the prior year.
- Funds from operations (FFO) for the third quarter was $525 million, increasing 24% relative to the comparable period. Organic growth for the quarter was robust at 10%, reflecting the benefits of elevated inflation levels impacting tariffs and the commissioning of approximately $1.2 billion of capital projects in the last 12 months. Additionally, approximately $2 billion of capital was deployed in acquisitions over the same period that contributed to results.
Outlook:
“In August, we announced a partnership with Intel Corporation to invest in a $30 billion semiconductor foundry in Arizona. Brookfield will be providing approximately $15 billion over the construction period for a 49% interest in the facility. The majority of our capital commitment has been sourced from non-recourse debt, with base interest rate exposure fully hedged concurrent with signing. Moreover, the majority of the Brookfield’s approximately $2 billion equity investment ($500 million net to BIP) is back-end weighted closer to the operational phase of the project.
This investment is structured to achieve an attractive risk-adjusted return. We draw parallels to other data investments such as hyperscale data centers that are generally contracted on a long-term basis, with highly creditworthy counterparties, where we do not assume technological risk. In this instance, we view Intel to be a creditworthy and market-leading partner. The transaction is expected to close by the end of 2022 and is thematically an example of the large-scale capital required to support the onshoring of critical supply chains.
For the balance of the year, our focus will be on closing the remaining two announced transactions, HomeServe and DFMG, in Q4 2022 and Q1 2023, respectively. Once closed, we will transition our focus to the execution of our growth plans in both businesses.
- At HomeServe, we are splitting the company’s U.S. and European operations to integrate them with existing portfolio businesses in each geography. We plan to accelerate growth by expanding our residential infrastructure product and service offering to a wider customer base.
- At DFMG, we are acquiring a marquee portfolio of 36,000 towers in Germany and Austria that also includes a greenfield development portfolio of an additional 5,200 build-to-suit towers. These additional towers are to be constructed over the next five-years and underpinned by the credit quality of Deutsche Telekom. In addition to the built-in organic growth, we plan to use this business as a platform for follow-on opportunities in the fragmented European telecom tower market.
On the capital recycling front, earlier this year, we signed agreements to sell three mature businesses for approximately $600 million of proceeds. These sales were in addition to the sale of our U.S. container terminal that closed earlier this year for approximately $350 million. Of the three secured sales, our New Zealand telecom tower portfolio sale closed November 1st, our Brazilian electricity transmission lines are expected to close in November and the Indian toll roads are on track to close by year end. In addition, several sales processes are underway that, combined, are expected to generate approximately $1.5 billion of proceeds.”
See the full Earnings Release here
Waste Connections (WCN-N) released its third-quarter 2022 results on Wednesday, November 2, 2022, after markets closed.
“Strong execution once again provided for better than expected results, driven in the third quarter by continued acceleration of solid waste pricing to 10.1% and higher E&P waste activity, along with acquisitions closed during the period. Most notably, we overcame 50 basis points in incremental headwinds, primarily from the precipitous decline in recycled commodity values in September, to beat our outlook and expand adjusted EBITDA margin both sequentially and on a year-over-year basis, excluding the dilutive impact from acquisitions completed since the year ago period,” said Worthing F. Jackman, President and Chief Executive Officer.
– President and Chief Executive Officer, Worthing F. Jackman
Highlights:
- Increasing solid waste pricing growth, E&P waste activity and acquisition contribution once again drive better than expected quarterly results
- Revenue of $1.880 billion, up 17.7%
- Net income of $236.9 million, and adjusted EBITDA(b) of $588.1 million, up 16.3%
- Adjusted EBITDA margin of 31.3% of revenue, above outlook and up 20 basis points year over year, excluding acquisitions
- Net income of $0.92 per share, and adjusted net income(b) of $1.10 per share
- Year to date net cash provided by operating activities of $1.500 billion and adjusted free cash flow of $929.0 million, or 17.4% of revenue
- Year to date signed or closed acquisitions with approximately $570 million of total annualized revenue
- Increases regular quarterly dividend by 10.9%
Outlook:
- Revenue is estimated to be approximately $7.190 billion, as compared to our previously revised revenue outlook of approximately $7.125 billion.
- Net income is estimated to be approximately $836.7 million, and adjusted EBITDA is estimated to be approximately $2.210 billion, or about 30.7% of revenue, as compared to our previously revised adjusted EBITDA outlook of $2.190 billion or 30.7% of revenue.
- Capital expenditures are estimated to be approximately $850 million, in line with our original outlook.
- Net cash provided by operating activities is estimated to be approximately $1.963 billion, and adjusted free cash flow(b) is estimated at approximately $1.160 billion, or about 16.1% of revenue, as compared to our previously revised adjusted free cash flow outlook of $1.160 billion or 16.3% of revenue.
See the full Earnings Release here
Bell Canada (BCE-T) released its third-quarter 2022 results on Thursday, November 3, 2022, before markets opened.
“The Bell team’s continued excellence in executing on our strategy and customer-centric approach, combined with our leading networks has delivered strong results this quarter, firmly placing Bell in a solid competitive position as we head into the end of the year.
We’re seeing clear demand from Canadians for differentiated fibre Internet services and fast, reliable wireless networks. We experienced over 400,000 net activations across our wireline and wireless networks, with our highest-ever number of total mobile phone net additions, and we also gained a significant share of Internet subscriber growth with over 95,000 new net fibre-to-the-home customers this past quarter, up 33% over last year and our best-ever result.”
– President and Chief Executive Officer, Mirko Bibic
Highlights:
- Leading advanced mobile and fibre networks delivered record 401,132 total broadband net customer activations — 224,343 mobile phone, 49,044 mobile connected devices; 89,652 retail Internet and 38,093 IPTV — up 50.3% y/y
- 2% consolidated revenue growth delivered 1.2% higher adjusted EBITDA1 as $38 million in storm and inflationary cost pressures2 absorbed in the quarter
- Net earnings of $771 million, down 5.2%, with net earnings attributable to common shareholders of $715 million, or $0.78 per common share, down 6.0%; adjusted net earnings1 of $801 million generated adjusted EPS1 of $0.88, up 7.3%
- Excellent wireless operating results: strong revenue and adjusted EBITDA growth of 7.4% and 7.8%, respectively; best-ever mobile phone net subscriber activations of 224,343, up 64.4%; lowest Q3 postpaid churn3 rate of 0.90%; and 2.2% higher mobile phone blended ARPU4
- Highest retail Internet net activations in 17 years, up 36.3% to 89,652, drove 8% residential Internet revenue growth; on track to complete 80% of broadband Internet buildout plan by end of 2022
- Bell Media digital revenue5 up 40% contributing to stable total media revenue as advertiser spending slows due to macroeconomic conditions
- Reconfirming all 2022 financial guidance targets
Outlook:
BCE confirmed its financial guidance targets for 2022, as provided on February 3, 2022, as follows:
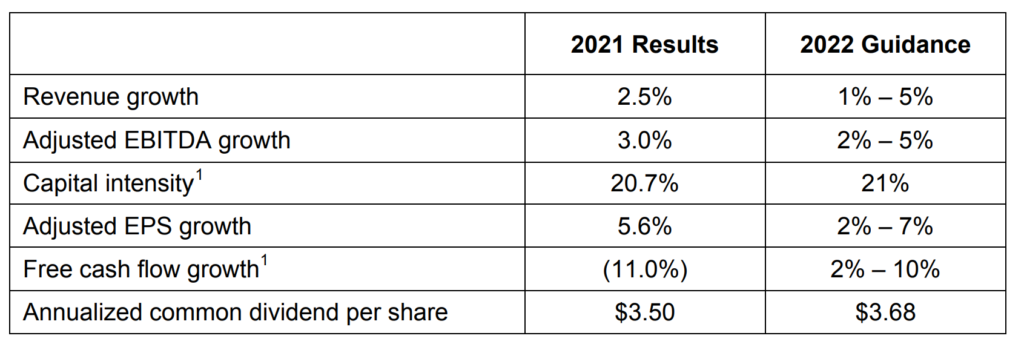
For the full-year 2022, we expect growth in adjusted EBITDA, a reduction in contributions to post-employment benefit plans and payments under other post-employment benefit plans, and lower cash income taxes, will drive higher free cash flow.
See the full Earnings Release here
Telus (T-T) released its third-quarter 2022 results on Friday, November 4, 2022, before markets opened.
“In the third quarter, the TELUS team once again demonstrated continued execution excellence, characterized by the potent combination of industry-leading customer growth, resulting in strong operational and financial results across our business. Our robust performance reflects the chemistry of our globally leading broadband
– President and Chief Executive Officer, Darren Entwistle
Highlights:
- Industry-leading total Mobile and Fixed customer growth of 347,000, up 27,000 over last year, and our strongest quarter on record, driven by higher year-over-year customer growth across our portfolio of leading Mobility and Fixed services
- Strong, high-quality mobile phone net additions of 150,000, a 15,000 increase over the prior year, the best quarterly result since 2010; record high connected device net additions of 124,000, up 14,000 year-over-year
- Robust wireline customer net additions of 73,000, powered by world-leading customer loyalty in combination with TELUS’ PureFibre network, including sustained momentum on accretive copper-to-fibre migrations as TELUS continues to successfully execute on its accelerated broadband expansion plan
- Consolidated Revenue, Adjusted EBITDA, Net Income and Earnings Per Share growth of 10 per cent, 11 per cent, 54 per cent and 48 per cent, respectively, reflecting consistent execution excellence; strong Free Cash Flow growth of 63 per cent
- TELUS International’s strong growth profile to be amplified by the acquisition of WillowTree, significantly enhancing our end-to-end transformation capabilities for customers around the world
- Quarterly dividend increased to $0.3511, an increase of 7.2 per cent over the same period last year, representing a yield of approximately 5 per cent at current share price, supported by leading Adjusted EBITDA growth and significant expected cash flow expansion beginning in 2023
Outlook:
“The company also said it has “recalibrated” the full-year outlook for 2022 to reflect prolonged macroeconomic uncertainty and expected potential impacts on its business. It now expects revenue in the range of US$2,450 to US$2,490 million, representing growth of 11.7% to 13.5%. It previously expected revenue in the range of US$2,550 to US$2,600 million.
It changed its guidance for adjusted EBITDA margin in the range of 24.4% to 24.6%, from about 24% previously. The company kept its guidance unchanged for adjusted diluted EPS in the range of US$1.18 to US$1.23.”
See the full Earnings Release here
Enbridge Inc. (ENB-T) released its third-quarter 2022 results on Friday, November 4, 2022, before markets opened.
“While global economies and energy markets are experiencing significant volatility, Enbridge’s premium North America franchises, resilient commercial underpinnings, and our increasing inventory of organic opportunities put us in a great position to continue to grow into the future. The fundamentals of our business continue to be positive; it’s clear that the world needs all forms of energy to meet future demand, especially in the context of the energy security, reliability, and affordability challenges that everyone is faced with in today’s environment
– President and Chief Executive Officer, Al Monaco
Highlights:
- Third quarter GAAP earnings of $1.3 billion or $0.63 per common share, compared with GAAP earnings of $0.7 billion or $0.34 per common share in 2021
- Adjusted earnings* of $1.4 billion or $0.67 per common share*, compared with $1.2 billion or $0.59 per common share in 2021
- Adjusted earnings before interest, income taxes and depreciation and amortization (EBITDA)* of $3.8 billion, compared with $3.3 billion in 2021
- Cash provided by operating activities of $2.1 billion, compared with $2.3 billion in 2021
- Distributable cash flow (DCF)* of $2.5 billion or $1.24 per common share*, compared with $2.3 billion or $1.13 per common share in 2021
- Reaffirmed 2022 full year guidance range for EBITDA of $15.0 billion to $15.6 billion and DCF per share of $5.20 to $5.50
- Secured an expansion of B.C. Pipeline’s T-South section adding 300 million cubic feet per day (MMcf/d) of capacity with an estimated capital cost of up to $3.6 billion
- Launched a binding open season for a second expansion of B.C. Pipeline’s T-North section adding approximately 500MMcf/d of capacity
- Formed strategic partnership with 23 First Nation and Métis communities selling a 11.57% non-operating interest in seven Regional Oil Sands pipelines for $1.12 billion
- Advanced U.S. Gulf Coast oil strategy through increased interest in Gray Oak Pipeline while lowering commodity exposure with reduced interest in DCP Midstream LP; received US$400 million cash
- Enhanced North American renewable development portfolio with US$270 million acquisition of Tri Global Energy (TGE)
- Acquired additional 10% ownership interest in Cactus II Pipeline in the Permian bringing Enbridge’s ownership to 30%
- Sanctioned investment for four additional oil storage tanks at the Enbridge Ingleside Energy Center (EIEC)
- Secured two new RNG projects in Ontario where Enbridge will invest in gas upgrading and pipeline connections
- Released Enbridge’s Indigenous Reconciliation Action Plan building on the Company’s growing track record of engagement with Indigenous communities and employees
Outlook:
“We are pleased with our strong third quarter results and year-to-date performance, a testament to the Enbridge team across our four core businesses. We’re tracking to plan and expect to achieve our 2022 EBITDA and DCF per share guidance. Looking forward, our low-risk business model provides us with excellent visibility to growing cash flows and our assets are underpinned by long-term contracts or cost-of-service frameworks that provide built-in inflation protections.”
See the full Earnings Release here
Magna (MGA-N) released its third-quarter 2022 results on Friday, November 4, 2022, before markets opened.
“In the third quarter, we managed through an operating environment that remains challenged by ongoing production schedule volatility and elevated energy costs in Europe. We continue to take steps to address the short-term industry turbulence as well as operating inefficiencies at certain facilities, while remaining focused on our go-forward strategy and value creation.”
– Chief Executive Officer, Swamy Kotagiri
Highlights:
- Sales increased 17% to $9.3 billion, compared to a global light vehicle production increase of 24%
- Excluding foreign currency translation and acquisitions net of divestitures, sales increased 27%
- Diluted earnings per share and adjusted diluted earnings per share increased to $1.00 and $1.07, respectively, compared to $0.04 and $0.56 last year
- Returned $305 million to shareholders through share repurchases and dividends
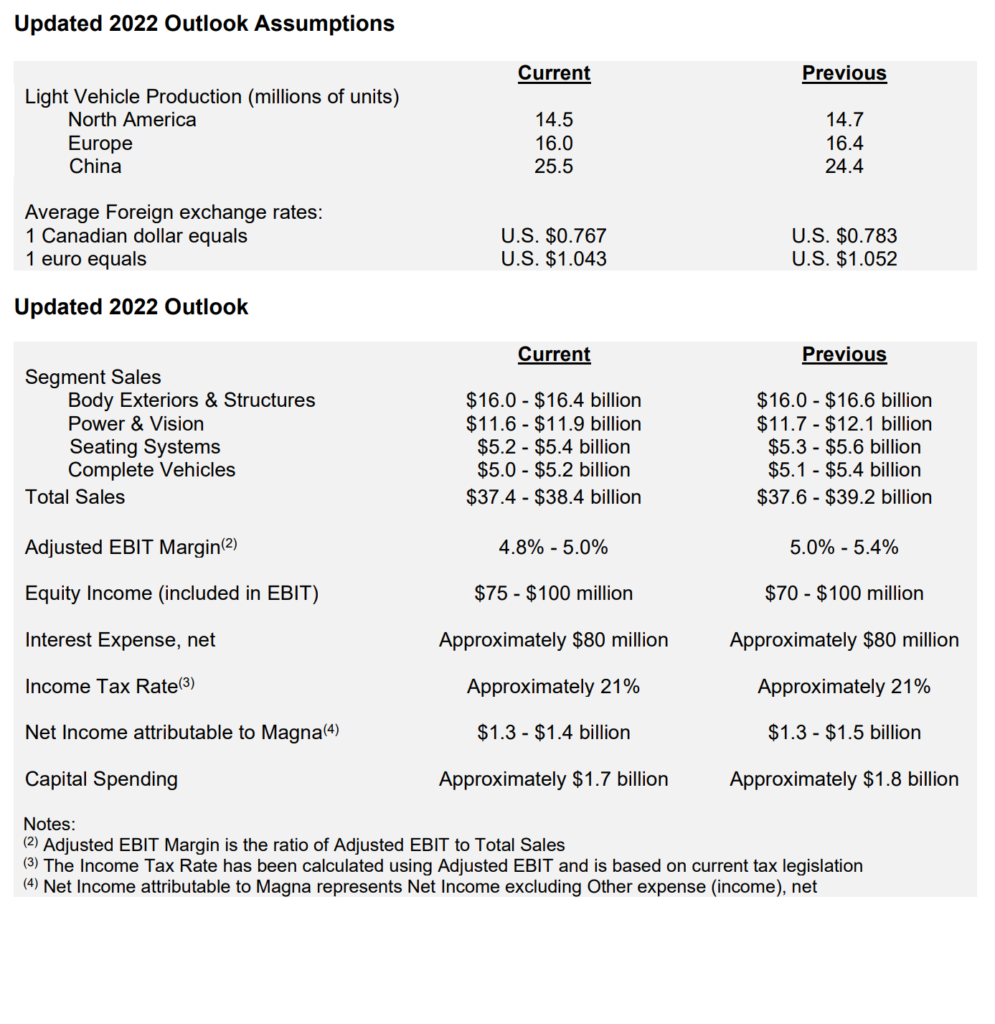
- Reduced outlook mainly reflects expected lower vehicle production in North America and Europe and higher operating inefficiencies
Outlook:
“We first disclose a full-year Outlook annually in February, with quarterly updates. The following Outlook is an update to our previous Outlook in July 2022.”
Below is a snapshot of ‘The List’ from last Friday’s close. For a sortable version of ‘The List’, please click on The List menu item.
‘The List’ is not meant to be a template for investors to copy exactly. Instead, its purpose is to provide investment ideas and a real-time illustration of dividend growth investing in action. It is not a ‘Buy List’ nor does it reflect the composition or returns of our Magic Pants Wealth-Builder (CDN) Portfolio. It is only a starting point for our analysis and discussion.
The List (2022)
Last updated by BM on November 04, 2022
*Note: The following graph is wide, you can scroll to the right on your device to see more of the data.
| SYMBOL | COMPANY | YLD | PRICE | YTD % | DIV | YTD % | STREAK |
|---|---|---|---|---|---|---|---|
| AQN-N | Algonquin Power & Utilities | 6.4% | $11.06 | -22.9% | $0.70 | 5.4% | 11 |
| ATD-T | Alimentation Couche-Tard Inc. | 0.7% | $61.65 | 18.3% | $0.44 | 18.1% | 12 |
| BCE-T | Bell Canada | 5.9% | $61.75 | -6.3% | $3.64 | 4.0% | 13 |
| BIP-N | Brookfield Infrastructure Partners | 4.0% | $36.19 | -11.1% | $1.44 | 5.9% | 14 |
| CCL-B-T | CCL Industries | 1.6% | $61.93 | -8.6% | $0.96 | 14.3% | 20 |
| CNR-T | Canadian National Railway | 1.8% | $160.67 | 3.7% | $2.93 | 19.1% | 26 |
| CTC-A-T | Canadian Tire | 3.8% | $152.15 | -16.9% | $5.85 | 24.5% | 11 |
| CU-T | Canadian Utilities Limited | 5.0% | $35.28 | -3.6% | $1.78 | 1.0% | 50 |
| DOL-T | Dollarama Inc. | 0.3% | $79.41 | 25.2% | $0.22 | 9.2% | 11 |
| EMA-T | Emera | 5.4% | $49.82 | -20.4% | $2.68 | 4.1% | 15 |
| ENB-T | Enbridge Inc. | 6.4% | $54.17 | 9.3% | $3.44 | 3.0% | 26 |
| ENGH-T | Enghouse Systems Limited | 2.4% | $29.29 | -36.1% | $0.72 | 16.3% | 15 |
| FNV-N | Franco Nevada | 1.0% | $126.95 | -6.7% | $1.28 | 10.3% | 14 |
| FTS-T | Fortis | 4.1% | $53.35 | -11.8% | $2.17 | 4.3% | 48 |
| IFC-T | Intact Financial | 1.9% | $207.66 | 26.8% | $4.00 | 17.6% | 17 |
| L-T | Loblaws | 1.4% | $112.36 | 9.4% | $1.54 | 12.4% | 10 |
| MGA-N | Magna | 3.2% | $56.63 | -30.6% | $1.80 | 4.7% | 12 |
| MRU-T | Metro | 1.5% | $72.21 | 7.7% | $1.10 | 12.2% | 27 |
| RY-T | Royal Bank of Canada | 3.9% | $127.32 | -7.0% | $4.96 | 14.8% | 11 |
| SJ-T | Stella-Jones Inc. | 1.9% | $41.52 | 2.1% | $0.80 | 11.1% | 17 |
| STN-T | Stantec Inc. | 1.1% | $65.19 | -7.1% | $0.71 | 6.8% | 10 |
| TD-T | TD Bank | 4.0% | $87.97 | -11.5% | $3.56 | 12.7% | 11 |
| TFII-N | TFI International | 1.2% | $92.10 | -16.8% | $1.08 | 12.5% | 11 |
| TIH-T | Toromont Industries | 1.5% | $104.19 | -8.4% | $1.52 | 15.2% | 32 |
| TRP-T | TC Energy Corp. | 5.9% | $60.06 | 0.6% | $3.57 | 4.4% | 21 |
| T-T | Telus | 4.6% | $28.70 | -3.6% | $1.33 | 6.2% | 18 |
| WCN-N | Waste Connections | 0.7% | $136.45 | 1.8% | $0.95 | 11.8% | 12 |
| Averages | 3.0% | -4.6% | 10.4% | 18 |
