MP Market Review – October 13, 2023
Last updated by BM on October 16, 2023
Summary
- This is a weekly installment of our MP Market Review series, which provides updates on the financial markets and Canadian dividend growth companies we monitor on ‘The List’.
- Last week, ‘The List’ was down with a YTD price return of -1.1% (capital). Dividend growth is at +8.6% YTD, highlighting growth in income over the past year.
- Last week, no dividend increases from companies on ‘The List’.
- Last week, no earnings reports from companies on ‘The List’.
- No companies on ‘The List’ are due to report earnings this week.
- If you’re interested in creating your own dividend growth income portfolio, consider subscribing to our premium service, which grants you access to the MP Wealth-Builder Model Portfolio (CDN) and exclusive subscriber-only content. Learn More

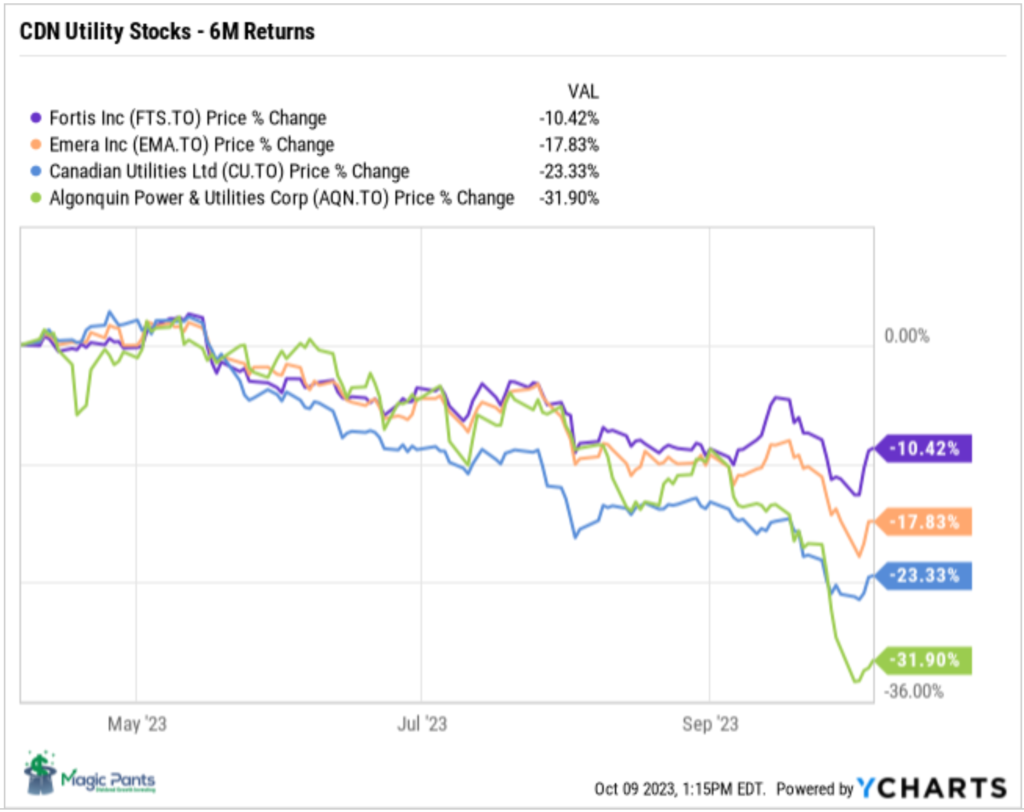
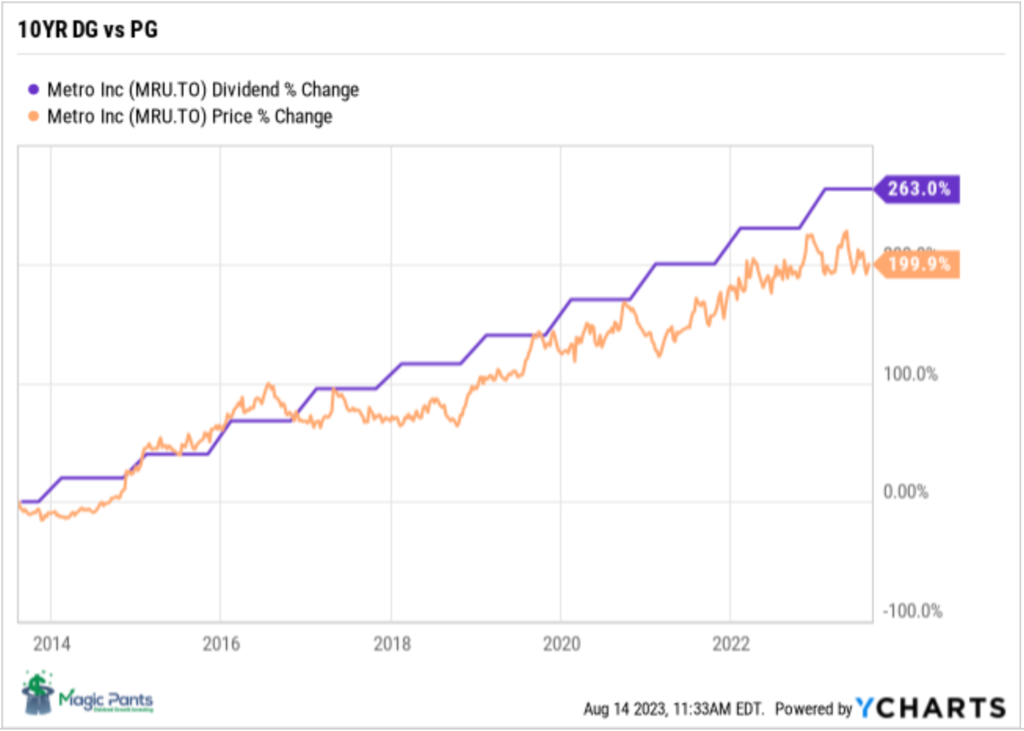
Identifying companies whose dividend growth aligns closely with price growth can considerably enhance the predictability of future returns. Dividend growth investors know that the dividend drives the price in a predictable way, not the other way around. Fortis Inc. (FTS-T) is another company on ‘The List’ that aligns very closely with this dividend growth vs price growth pattern we like to see.
Introduction
“You have a pair of pants. In the left pocket, you have $100. You take $1 out of the left pocket and put it in the right pocket. You now have $101. There is no diminution of dollars in your left pocket. That is one magic pair of pants.”
This ‘magic pants’ analogy was from a Seeking Alpha article on dividend investing I read about a decade ago and was one of the catalysts for me to take a closer look at this type of investing and see if it truly was magical.
After conducting additional research, I have shifted towards utilizing a dividend growth investing (DGI) strategy as my primary investment approach. While I maintain portfolios consisting of high-quality dividend growers from both the United States and Canada, I have opted to concentrate on Canadian (CDN) dividend growth companies in this blog. This is due to several reasons, including a smaller pool of DGI companies to track, a lack of coverage for the DGI strategy by the North American investment media, and a tendency for those who do cover DGI to narrowly focus on only a handful of sectors (Energy and Financials).
While ‘The List’ is not a portfolio in itself, it serves as an excellent initial reference for individuals seeking to diversify their investments and attain higher returns in the Canadian stock market. Through our blog, we provide weekly updates on ‘The List’ and offer valuable perspectives and real-life examples of the dividend growth investing strategy in practice. This helps readers gain a deeper understanding of how to implement and benefit from this investment approach.
DGI Thoughts
“It’s far better to buy a wonderful company at a fair price than a fair company at a wonderful price.”
– Warren Buffett
Quality vs Value
While we are always hunting for attractive investment opportunities, we must remember that the pursuit of bargains shouldn’t overshadow the importance of quality. This is a snapshot of ‘The List’ as of Friday, October 13, 2023, sorted by valuation according to the dividend yield theory (valuation measure).
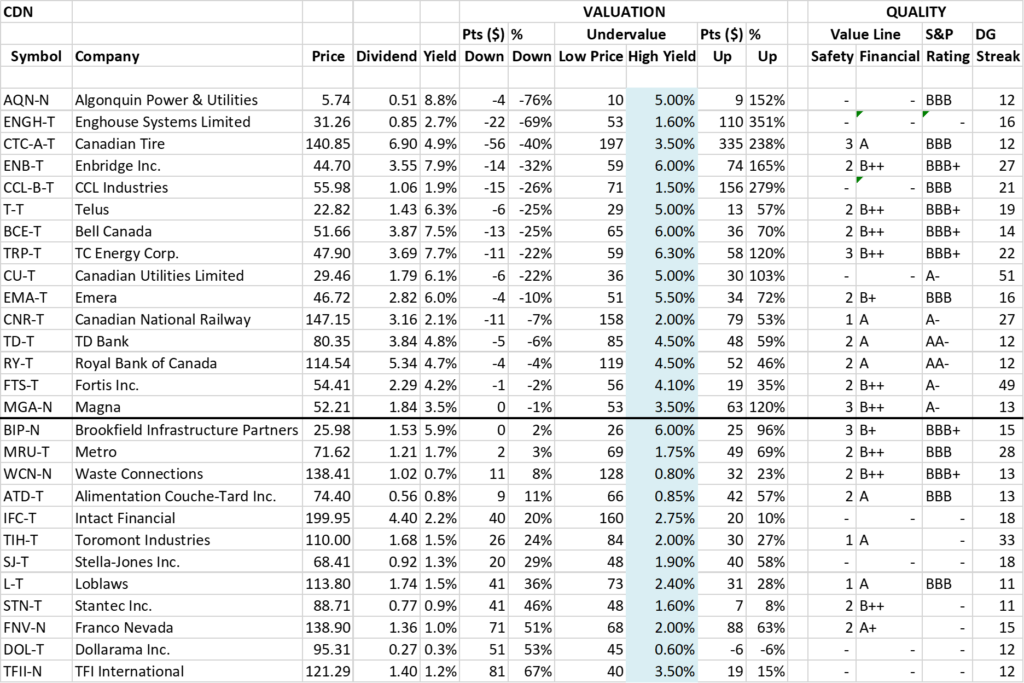
At present, half of ‘The List’ is deemed undervalued based on dividend yield theory. However, a different perspective emerges when we sort this list using some of our ‘quality indicators’ like Value Line Safety and Financial ratings, S&P Rating, and Dividend Growth Streak.
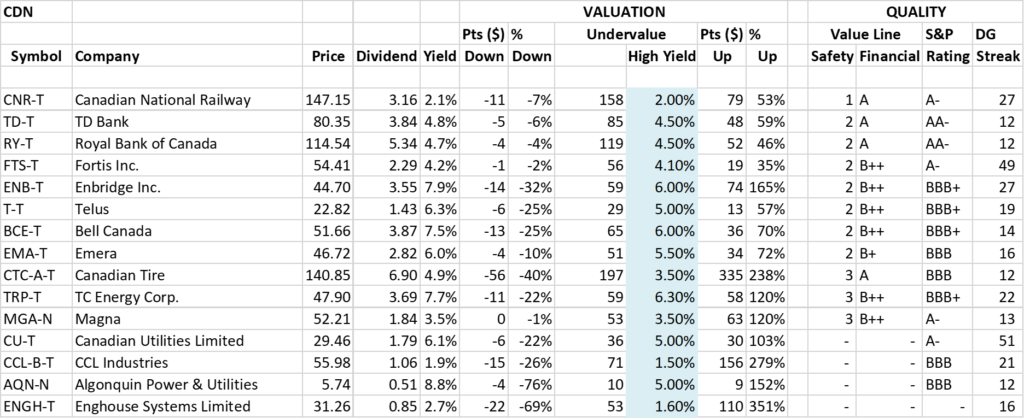
As Warren Buffett rightly advises, any investment strategy should prioritize acquiring companies positioned near the top of this list – those considered ‘wonderful companies’ – when they are reasonably priced. This approach, rather than focusing solely on valuation, promises a more favorable outcome.
If you have not yet joined as a paid subscriber of the blog to receive DGI Alerts on the activity and content related to our model portfolio, it’s not too late. Click Here.
Recent News
BMO strategist reiterates importance of a dividend growth portfolio in current environment (Globe & Mail)
“BMO chief investment strategist Brian Belski reiterated his belief that dividend growth is the correct strategy for income-oriented investors.”
The author discusses the limitations of ‘yield-focused strategies’ in this article. For many investors, the key distinction lies in separating high-yield dividend investing from investing in quality dividend growth companies that consistently increase their cash flow each year. It is not the initial high yield that wins; rather, it is the combination of yield plus growth over time.
I would argue that dividend growth investing is important in any environment but then again, I am a little biased.
The carnage in dividend-land is an epic buying opportunity, if you have time to wait (Globe & Mail)
“Prices will rise, yields will come down. Investors who bought dividend stocks when they were beaten down will be rewarded in three ways:
- Potential price rebounds: Some blue-chip dividend stocks have fallen so hard lately that their share prices are down or flat over the past five years.
- Dividend growth: Bond interest is locked in, but many dividend stocks have a history of annual dividend increases.
- Tax: In a non-registered account, the dividend tax credit means you pay less tax on dividends from a corporation than you do on bond interest.”
I’m pleased to see a growing number of articles about dividend growth investing in the financial media. When traditional index and growth-focused approaches no longer deliver the desired results, you can always rely on the time-tested strategy of dividend growth investing.
The List (2023)
Last updated by BM on October 13, 2023
The Magic Pants List contains 27 Canadian dividend growth stocks. ‘The List’ contains Canadian companies that have raised their dividend yearly for at least the last ten years and have a market cap of over a billion dollars. Below is each stock’s symbol, name, current yield, current price, price return year-to-date, current dividend, dividend growth year-to-date and current dividend growth streak. Companies on ‘The List’ are added or subtracted once a year, on January 1. After that, ‘The List’ is set for the next twelve months. Prices and dividends are updated weekly.
| SYMBOL | COMPANY | YLD | PRICE | YTD % | DIV | YTD % | STREAK |
|---|---|---|---|---|---|---|---|
| AQN-N | Algonquin Power & Utilities | 8.8% | $5.74 | -14.7% | $0.51 | -29.0% | 12 |
| ATD-T | Alimentation Couche-Tard Inc. | 0.8% | $74.40 | 23.7% | $0.56 | 19.1% | 13 |
| BCE-T | Bell Canada | 7.5% | $51.66 | -14.2% | $3.87 | 5.2% | 14 |
| BIP-N | Brookfield Infrastructure Partners | 4.4% | $25.98 | -17.7% | $1.44 | 6.3% | 15 |
| CCL-B-T | CCL Industries | 1.9% | $55.98 | -3.6% | $1.06 | 10.4% | 21 |
| CNR-T | Canadian National Railway | 2.1% | $147.15 | -9.7% | $3.16 | 7.8% | 27 |
| CTC-A-T | Canadian Tire | 4.9% | $140.85 | -3.9% | $6.90 | 17.9% | 12 |
| CU-T | Canadian Utilities Limited | 6.1% | $29.46 | -20.2% | $1.79 | 1.0% | 51 |
| DOL-T | Dollarama Inc. | 0.3% | $95.31 | 19.3% | $0.27 | 23.8% | 12 |
| EMA-T | Emera | 6.0% | $46.72 | -11.2% | $2.82 | 5.0% | 16 |
| ENB-T | Enbridge Inc. | 7.9% | $44.70 | -16.2% | $3.55 | 3.2% | 27 |
| ENGH-T | Enghouse Systems Limited | 2.7% | $31.26 | -12.5% | $0.85 | 18.2% | 16 |
| FNV-N | Franco Nevada | 1.0% | $138.90 | 0.5% | $1.36 | 6.3% | 15 |
| FTS-T | Fortis Inc. | 4.2% | $54.41 | -1.7% | $2.29 | 5.3% | 49 |
| IFC-T | Intact Financial | 2.2% | $199.95 | 2.1% | $4.40 | 10.0% | 18 |
| L-T | Loblaws | 1.5% | $113.80 | -5.4% | $1.74 | 13.2% | 11 |
| MGA-N | Magna | 3.5% | $52.21 | -9.2% | $1.84 | 2.2% | 13 |
| MRU-T | Metro | 1.7% | $71.62 | -5.1% | $1.21 | 10.0% | 28 |
| RY-T | Royal Bank of Canada | 4.7% | $114.54 | -10.5% | $5.34 | 7.7% | 12 |
| SJ-T | Stella-Jones Inc. | 1.3% | $68.41 | 38.0% | $0.92 | 15.0% | 18 |
| STN-T | Stantec Inc. | 0.9% | $88.71 | 35.8% | $0.77 | 8.5% | 11 |
| TD-T | TD Bank | 4.8% | $80.35 | -8.3% | $3.84 | 7.9% | 12 |
| TFII-N | TFI International | 1.2% | $121.29 | 21.1% | $1.40 | 29.6% | 12 |
| TIH-T | Toromont Industries | 1.5% | $110.00 | 12.6% | $1.68 | 10.5% | 33 |
| TRP-T | TC Energy Corp. | 7.7% | $47.90 | -10.1% | $3.69 | 3.4% | 22 |
| T-T | Telus Corp. | 6.3% | $22.82 | -13.3% | $1.43 | 7.4% | 19 |
| WCN-N | Waste Connections | 0.7% | $138.41 | 5.1% | $1.02 | 7.4% | 13 |
| Averages | 3.6% | -1.1% | 8.6% | 19 |
Six Canadian stocks on ‘The List’ declare earnings and dividends in US dollars and are inter-listed on a US exchange in US dollars. The simplest way to display dividend and price metrics for these stocks is to show their US exchange symbols along with their US dividends and price. The stocks I am referring to have a -N at the end of their symbols. You can still buy their Canadian counterparts (-T), but your dividends will be converted into CDN dollars and will fluctuate based on the exchange rate.
Note: When the dividend and share price currency match, the calculation is straightforward. But it’s not so simple when the dividend is declared in one currency, and the share price is quoted in another. Dividing the former by the latter would produce a meaningless result because it’s a case of apples and oranges. To calculate the yield properly, you must express the dividend and share price in the same currency.
Performance of ‘The List’
Feel free to click on this link, ‘The List’ for a sortable version from our website.
Last week, ‘The List’ was down with a YTD price return of -1.1% (capital). Dividend growth is now at +8.6% YTD, highlighting growth in income over the past year.
The best performers last week on ‘The List’ were Stella-Jones Inc. (SJ-T), up +5.80%; Franco Nevada (FNV-N), up +5.11%; and TC Energy Corp. (TRP-T), up +4.75%.
Brookfield Infrastructure Partners (BIP-N) was the worst performer again last week, down -7.31%.
Dividend Increases
“The growth of dividend paying ability is of significance in the determination of a stock’s quality, or general safety…”
– Arnold Bernhard (the founder of Value Line)
“As a dividend increase is a positive sign of a company’s financial strength, the safest purchase, after research, is a stock with a recent dividend increase.”
– Tom Connolly (the founder of dividendgrowth.ca)
Last week, no dividend increases from companies on ‘The List’.
Earnings Releases
Benjamin Graham once remarked that earnings are the principal factor driving stock prices.
Each quarter we will provide readers with weekly earnings updates of stocks on ‘The List’ during the calendar earnings season.
The updated earnings calendar can be found here.
Earnings growth and dividend growth tend to go hand in hand, so this information can tell us a lot about the future dividend growth of our quality companies. Monitoring our dividend growers periodically is part of the process, and reading the quarterly earnings releases is a good place to start.
No earnings reports from companies on ‘The List’ this week
Last week, no companies on ‘The List’ reported earnings.