“You have a pair of pants. In the left pocket, you have $100. You take $1 out of the left pocket and put in the right pocket. You now have $101. There is no diminution of dollars in your left pocket. That is one magic pair of pants.”

Category: Valuation

Toronto-Dominion Bank: Time To Supercharge Your Dividend Growth Investing (DGI) Returns

Last updated by BM on April 13, 2023

Summary 

  • The banking crisis of 2023 has now spread to global banks.
  • Are Canadian banks such as Toronto-Dominion Bank vulnerable?
  • How does Toronto-Dominion’s pending acquisition of First Horizon Corporation (FHN-N) impact our decision?
  • Our DGI process is simple and intuitive. We review ‘quality’ indicators and ‘valuation’ metrics that are readily available and easy to understand.
  • In this article, we make the case that an investment in Toronto-Dominion Bank today will help ‘supercharge’ your investment returns in the future. 

Background

In mid-March, we sent out a DGI-Alert to all our paid subscribers confirming a transaction. As you may recall, the banking sector faced significant turmoil after Silicon Valley Bank in the United States and Credit Suisse in Europe encountered some issues. We utilize such circumstances to guide our readers through our methodology, ensuring a more rational approach to opportunities when they arise.

This article substantiates our quality and valuation analysis of Toronto-Dominion Bank at that time. We also wanted to give all our readers the inside scoop on our process in action. We used the closing price of $79.65 from last week for our analysis here.

Always be sure that any purchase you make meets your own personal objectives and risk tolerances.

If you have not yet joined as a subscriber of the blog to receive DGI Alerts on the activity in our model portfolio, it’s not too late. Click Here.

Intro

“Be fearful when others are greedy and greedy when others are fearful.”

– Warren Buffett

As we grow older, we tend to accumulate a wealth of experience that we can draw upon. During the first decade of our journey as dividend growth investors, we experienced the ups and downs that are typical of the market. However, we were fortunate to learn from our mistakes and document five valuable lessons in our post, MP Wealth-Builder Portfolio (CDN); The First Ten Years. Recently, we put one of these lessons into practice by purchasing Toronto-Dominion Bank’s stock for our model portfolio.

Lesson #5

Supercharge your returns by having the confidence in a market sell-off to purchase the quality companies on your list. We had a few opportunities over the last ten years to either initiate or add to our core positions at a steep discount. We ended up being too conservative when the opportunities presented themselves and our returns were not as good as they could have been. Have a chat with yourself prior to a sell-off on what your strategy would be and try and eliminate the emotion for when the time comes. Trust the process.

Investment Thesis

Toronto-Dominion Bank’s stock has been impacted by the recent barrage of negative news surrounding the banking industry, credit delinquencies and concerns over the First Horizon Corporation acquisition. In our opinion, Canadian banks are distinct from other banks worldwide. Canadian banks are well-capitalized and enjoy oligopoly power in Canada, with dominant positions in deposit-taking, lending, investment banking, insurance and wealth management.

We also believe that the acquisition or non-acquisition of First Horizon Corporation is only a short-term issue. If the bank can renegotiate the deal to more favourable terms, this could be seen as a positive development and could potentially boost investor confidence in the company. On the other hand, if the bank decides to walk away from the deal entirely, this could also be seen as a positive development if investors believe it will be in the company’s best interest in the long run. Either way, the share price should regain support.

Given the current price, we believe that (TD-T) stock is being unjustly penalized, presenting an excellent opportunity to purchase this quality dividend grower at a discount.

About

Toronto-Dominion Bank is one of Canada’s two largest banks and operates three business segments: Canadian retail banking, U.S. retail banking, and wholesale banking. The bank’s U.S. operations span from Maine to Florida, with a strong presence in the Northeast. It also has a 13% ownership stake in Charles Schwab.

Not only is The Toronto-Dominion the biggest bank in Canada in terms of assets and deposits, but it also ranks as the sixth largest bank in North America in terms of assets and the fifth largest in terms of market capitalization.

TD operates as a global bank, with 60% of its operations in Canada, 37% in the United States, and the remaining 3% overseas. It has a significant presence with 2,220 retail locations in Canada and the U.S. and 16 offices worldwide.

Our Process

The process we use is a ‘rules-based’ process. It is a repeatable process in all markets that tilts the odds of making a good investment decision in our favour. We will review the first two rules in our process to see if now is the time to add Toronto-Dominion Bank to our DGI portfolios.

  1. Quality; only buy large-cap companies with a long dividend growth streak and good financial safety metrics in an industry that is stable and growing.
  2. Valuation; look to buy a company that is sensibly priced or undervalued by looking at a company’s track record. Undervaluation introduces a margin of safety. You are in essence, tilting the odds in your favour that future price movements will be upwards.
  3. Monitor; keep an eye on your dividend growers, especially the current yield; fluctuations in yields send signals. The consistency of a firm’s dividend growth is the best measure of management’s confidence in the long-term growth outlook for a company.

Quality

To assess the quality in the dividend growth stocks we follow, we look at several indicators. A company we invest in rarely satisfies all of our criteria, but the more ‘indicators’ we check off, the higher the quality of the business.

Dividend Growth Streak

We begin assessing quality with a streak of dividend increases of at least 10 years. The longer streak, the higher the ‘quality’.

Toronto-Dominion Bank had a dividend growth streak of 12 years coming into 2022. An increase already in this fiscal year (2023) means the streak will continue.

Growth Yield

Growth yield refers to the yield on cost of a stock, which takes into account the current annualized dividend payments in relation to the original cost basis of the investment. We like the term growth yield better as it proves that growth (a key part of our strategy) has indeed happened and highlights the yield you are now making on dividends alone. The magic of growth yield is typically lost in all statements and conversations about investing. Knowing the subtle difference between a good yield and growing yield is fundamental in what we do.

According to our experience, creating a stock portfolio with an average estimated growth yield and historical growth yield of greater than 7% after ten years has proven to be a reliable indicator of quality.

Historical growth yield calculation for Toronto-Dominion Bank:

Current Dividend / Price Jan. 1, 2013, = Historical Growth Yield

$3.84/$41.60 = 9.2%

Estimated growth yield calculation for Toronto-Dominion Bank:

Current Yield * Average Annual Forward Dividend Growth Rate ^ Period = Estimated Growth Yield

4.9% * 1.08 ^ 10 = 10.6%

In this instance, the Toronto-Dominion Bank satisfies our minimum growth yield criteria regarding historical and projected figures. The historical growth yield was based on a tangible value from an investment in TD Bank ten years ago, whereas the estimated growth yield is a forecasted figure for the next ten years.

Dividend Growth Rates (5YR and 10YR) 

We are looking for consistent dividend increases. The lower the starting yield, the higher the growth rate and time horizon required to achieve our income goals.

Toronto-Dominion Bank has a good dividend growth rate for an above-average yielding stock. Toronto-Dominion Bank has a 10YR average annual growth rate of 9.5% and a 5YR average of 8.7%

Recent Dividend Increase

This is a positive statement by management that they have confidence in the business going forward.

The Toronto-Dominion Bank has declared a dividend boost of +7.87% for the year 2023, signifying the bank’s 13th uninterrupted year of increasing dividends and 166th year of maintaining a consistent dividend payment record.

Source: TD Bank Q1 2023 Investor Presentation (March 2, 2023)

Dividend Growth and Price Growth Alignment

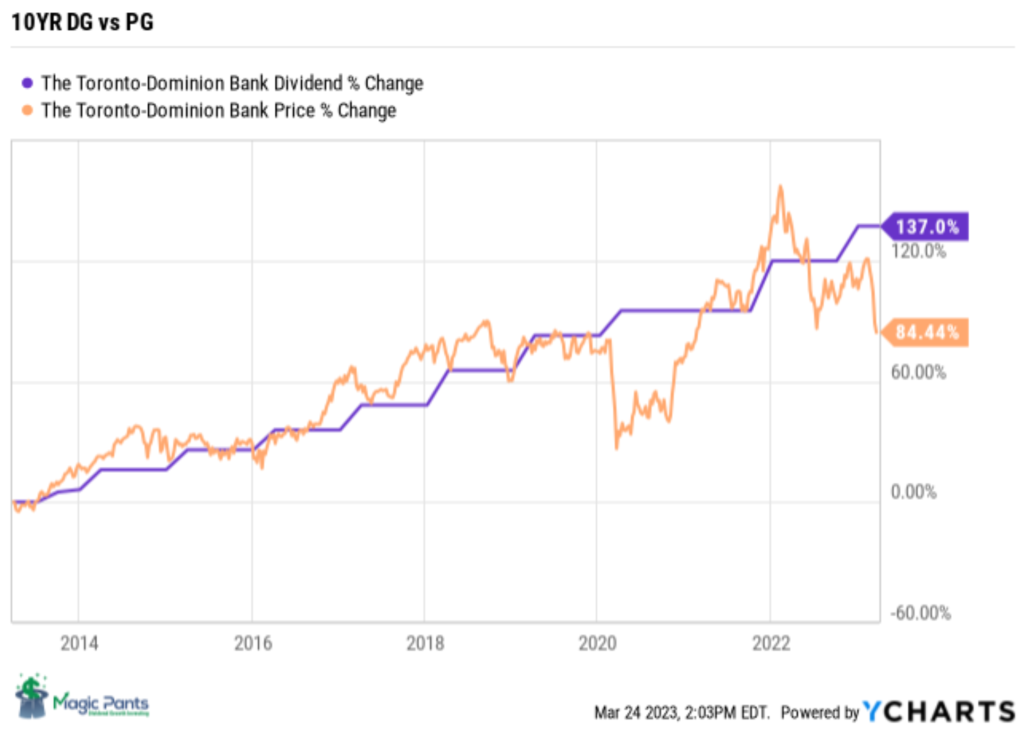
Identifying companies whose dividend growth aligns closely with price growth can considerably enhance the predictability of future returns. With the exception of a few abnormalities, such as the pandemic in 2020 and banking concerns in early 2023, the dividend growth of Toronto-Dominion Bank closely corresponds with its price growth. Moreover, the dip in price in 2020 turned out to be a favourable buying opportunity. Toronto-Dominion’s dividend continues to grow. Dividend growth investors know that the dividend drives the price in a predictable way, not the other way around.
Source: YCHARTS

Payout Ratio (Dividends vs Earnings)

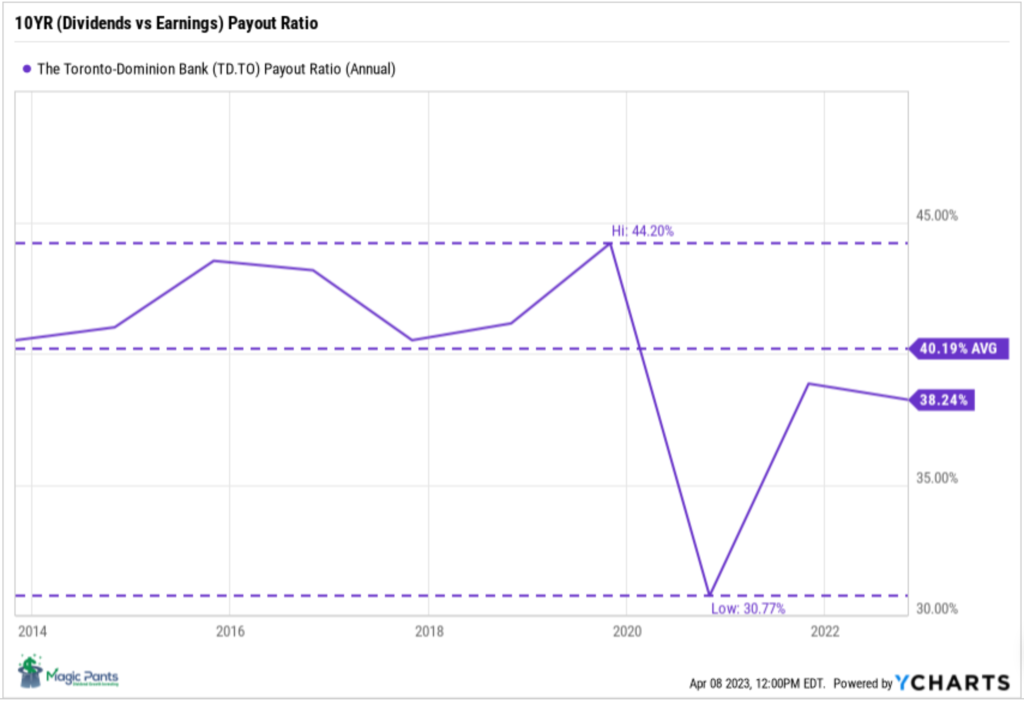
Low-payout dividend payers have traditionally done better than companies with high or negative payout ratios. Figure out the industry and company averages and measure against them. Low payout ratios protect your dividend.
Source: YCHARTS

With payout ratios below historical averages, there is ample room for further dividend growth at Toronto-Dominion Bank without adversely affecting financial health even if earnings are impacted in the short term, as its payout ratio currently sits comfortably below its ten-year average.

Independent Research

Although we review the above indicators as they are readily available for all the stocks we invest in, we find the independent research from services that sell information for a living to be the most informative. Value Line (VL) and S&P ratings can typically be found with a little digging.

Value Line’s Safety Rank

Measures the total risk of a stock relative to approximately 1,700 other stocks covered by Value Line. The safest stocks are assigned a rank of 1, whereas the riskiest stocks are assigned a rank of 5.

Toronto-Dominion Bank has a VL Safety Rank of 2.

Value Line Financial Strength

Ratings, from A++ to C in nine steps. The lowest rating is reserved for companies in serious financial difficulty. Factors considered in assigning ratings include balance sheet strength, corporate performance, market capitalization, and stability of returns.

Toronto-Dominion Bank has a VL Financial Strength Rating of A.

S&P Credit Ratings

Help investors determine investment risks. Ratings are either investment grade (AAA through BBB–) or speculative (BB+ through D).

Toronto-Dominion Bank has an S&P Credit Rating of AA-.

Market Cap

Market capitalization is also an important indicator to consider when evaluating a company’s quality. It represents the total value of a company’s outstanding shares of stock and is calculated by multiplying the number of outstanding shares by the current market price per share. Companies with larger market capitalizations generally have more resources, a more established track record, and less volatility than smaller companies. Toronto-Dominion Bank has a market cap of $145 billion dollars making it the second-largest company in Canada.

Quality Summary

Toronto-Dominion Bank is one of Canada’s highest-quality dividend growth companies, ranking highly on almost every quality indicator we use. Quality companies have historically been good investments when purchased at a sensible price.

Valuation

Irrespective of the superior quality of our dividend growers, we exercise caution and do not initiate or augment a position unless the stock is ‘sensibly priced’. To evaluate valuation, we utilize a few different metrics.

Historical Fundamentals
Source: FAST Graphs

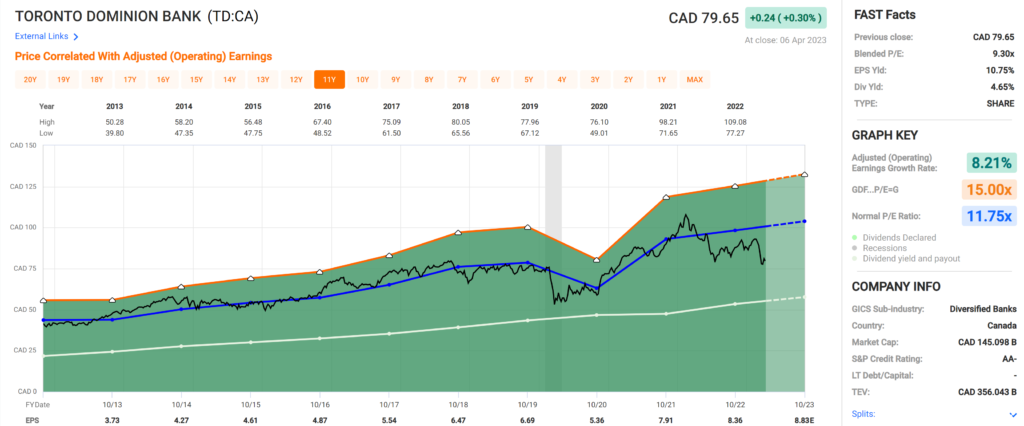
When we review the fundamentals FAST Graphs chart of Toronto-Dominion Bank, we notice that Price (Black Line) has historically followed its Normal P/E (Blue Line). Recent price weakness has it separating from its normal trading range. A narrow valuation corridor (a stock price that follows a path that rarely deviates from its trading range ie P/E ratio in this case) shows the predictability of this stock’s price movements.

We are below the Normal P/E of 11.75, which points to undervaluation at the current price. The current level is now ~ 30% below this level, which gives us the margin of safety we are looking for in this market.

Dividend Yield Theory

The dividend yield theory is a simple and intuitive approach to valuing dividend growth stocks. It suggests that the dividend yield of quality dividend growth stocks tends to revert to the mean over time, assuming that the underlying business model remains stable.

In practical terms, this means that if a stock is currently paying a dividend yield above its ten-year average annual yield, there is a higher probability that its price will increase to bring the yield back to its historical average.
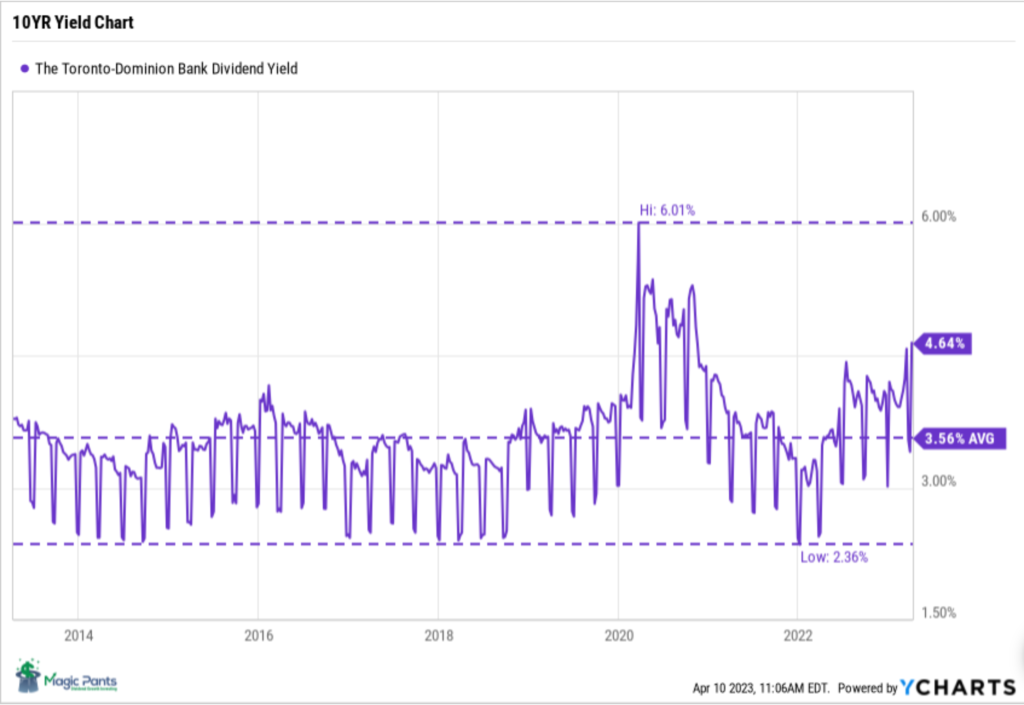
Source: YCHARTS

CAPE

The cyclically adjusted price-to-earnings CAPE ratio can assist investors in determining whether a stock is appropriately valued (sensibly priced). By averaging earnings over a longer period, such as ten years, the CAPE ratio helps smooth out short-term fluctuations. It provides a more reliable individual measure of a company’s earnings potential. When the CAPE ratio is low, it may suggest that the stock is undervalued and could be a good investment opportunity. Conversely, when the CAPE ratio is high, it may indicate that the stock is overvalued and could be a potential risk for investors. It is also important to consider the specific industry and market conditions that may affect a company’s earnings potential.

We typically look for stocks with a cyclically adjusted price-to-earnings ratio CAPE under 20. We calculate the CAPE by taking the average of the last ten years of a company’s earnings and dividing it by the current price.

Toronto-Dominion Bank’s CAPE ratio is ~13.8, representing undervaluation at today’s price.

Graham Value

The Graham number is a formula developed by Benjamin Graham, the father of value investing, to determine the intrinsic value of a stock. The formula uses a combination of a company’s earnings per share (EPS) and book value per share (BVPS) to calculate the fair value of a stock.

The Graham value/price we use: square root of (( average of last three years earnings per share * book value per share) * 22.5). The multiplier 22.5 is what Graham believed was appropriate for a company with a price-to-earnings (P/E) ratio of 15 and a price-to-book ratio of 1.5.

According to Graham’s theory, any stock price below the calculated Graham number is considered undervalued and thus worth investing in.

When we compute Toronto-Dominion Bank’s Graham number, we arrive at a price of $94.85. Given last Friday’s price of $79.65, we have a margin of safety here of ~19%, according to Graham, for this quality dividend grower.

Valuation Summary

Purchasing stocks at a ‘sensible price’ is as important as selecting quality companies in what we do. There is no one metric we rely on completely. The primary valuation indicators we use (Dividend Yield Theory, CAPE and Graham Value) all point to the undervaluation of Toronto-Dominion’s stock price at current levels. The historical fundamentals chart from FAST Graphs provides support for our hypothesis.

Forecast

“You can learn from the past, but you make money on the future.”

– Chuck Carnevale
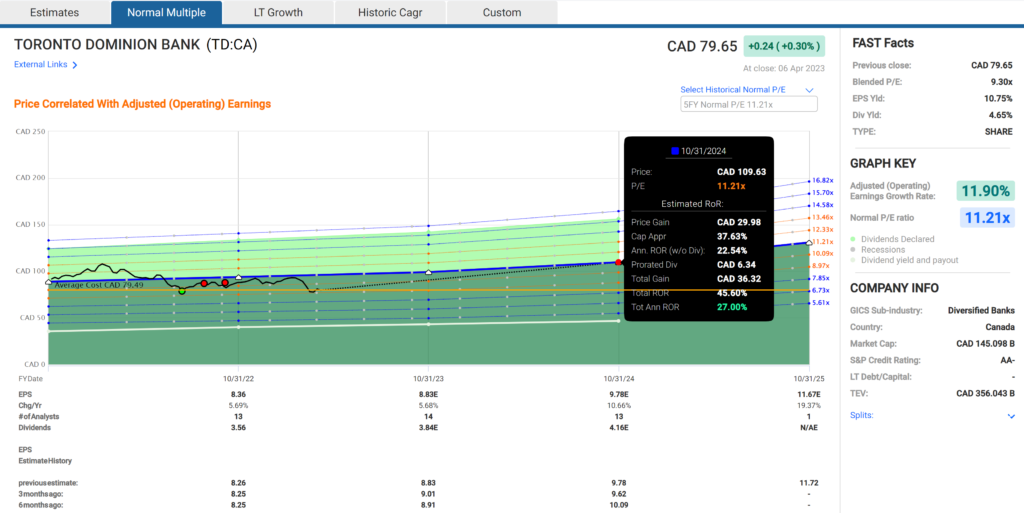
Source: FAST Graphs

Using the “Normal Multiple’ estimating tool from FAST Graphs, we see a normal P/E average over the last five years of 11.21. Based on analyst forecasts for eighteen months out, we estimate an annualized return, based on today’s price, of 27.0% should Toronto-Dominion Bank trade at its five-year normal P/E.

Analyst Scorecard
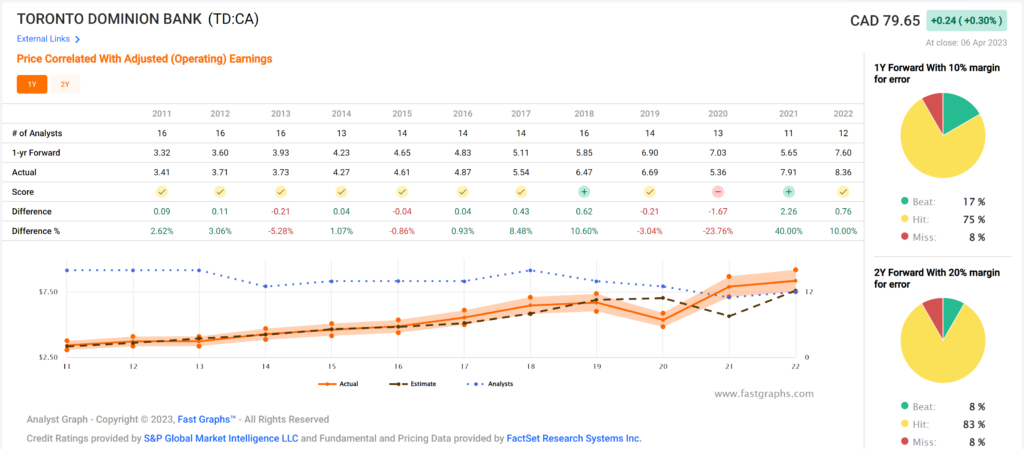
Source: FAST Graphs

To provide weight to the estimated earnings component of our analysis, we review the analysts’ historical track record covering this stock. You can see from the data that analysts have an above-average record of predicting earnings both one year (1Y) and two years (2Y) out. They have beaten or hit estimates on 1Y estimates 82% of the time and 91% on 2Y timeframes.

Forecast Summary

Due to the predictive power of dividend growth, its narrow historical valuation corridor, its historical track record of analysts’ forward earnings estimates and the conservative assumption that Toronto-Dominion Bank will trade again at its normal (P/E), we believe we have a high probability of above-average returns eighteen months out and beyond on an investment today.

News

TORONTO, March 2, 2023 – TD Bank Group (“TD” or the “Bank”) today announced its financial results for the first quarter January 31, 2023. Reported earnings were $1.6 billion, down 58% compared with the first quarter last year, and adjusted earnings were $4.2 billion, up 8%.

“TD had a strong start to 2023 with Canadian and U.S. retail businesses delivering robust revenue growth and record earnings, demonstrating the benefits of our diversified business mix,” said Bharat Masrani, Group President and Chief Executive Officer, TD Bank Group. “We continued to invest to strengthen our businesses and deliver the legendary customer experiences our customers and clients have come to expect from TD.”

“Yesterday, we announced the close of the Cowen Inc. acquisition, an important step forward in the expansion of our global dealer. TD Securities now has 6,500 colleagues in 40 cities around the world and is able to serve clients with an even broader product and services offering,” added Masrani.

Acquisition of Cowen Inc.

On March 1, 2023, the Bank completed the acquisition of Cowen Inc. (“Cowen”). The results of the acquired business will be consolidated by the Bank from the closing date and primarily reported in the Wholesale Banking segment.

Pending Acquisition of First Horizon Corporation

On February 28, 2022, the Bank and First Horizon Corporation (ׅ“First Horizon”) announced a definitive agreement for the Bank to acquire First Horizon in an all cash transaction valued at US$13.4 billion, or US$25.00 for each common share of First Horizon.

On February 9, 2023, the parties announced they had mutually agreed to extend the outside date to May 27, 2023, in accordance with the terms of the merger agreement. The closing of the transaction is subject to customary closing conditions, including approvals from U.S. and Canadian regulatory authorities, which now are not expected to be obtained prior to May 27, 2023. Regulatory approvals are not within the Bank’s control. If the merger does not close by May 27, 2023, then an amendment to the merger agreement would be required to further extend the outside date. TD and First Horizon are discussing a potential further extension.

Source: TD Earnings Release Q1 2023 (March 2, 2023)

The recent challenges facing the global banking system and the pending acquisition of First Horizon Corporation have harmed Toronto-Dominion Bank’s investors in recent weeks. Although there is an increased likelihood of additional banks being affected by these challenges, we remain confident that Toronto-Dominion Bank will weather the current financial storm and make prudent decisions for investors regarding the First Horizon Corp. acquisition. The bank’s successful track record of sound financial management over three centuries provides us with additional reassurance.

Conclusion

Utilizing our quality indicators and valuation metrics while drawing from our experience as dividend growth investors over the past decade, we have learned the significance of utilizing market sell-offs to acquire high-quality companies at reduced prices. Accumulating this high-quality, sensibly priced dividend grower today is an opportunity that will end up supercharging your DGI returns for years to come.

Dividend Yield Theory

Posted by BM on November 29, 2021 

“A stock is not a purchase until it’s yield reaches the buy range established by the stock’s own unique dividend yield history.”

– Anthony Spare, Relative Dividend Yield

How to identify value (sensible price) to maximize the return on our investment is key to our process. How do we know what a sensible price looks like? Dividend yields can help paint a picture for us.

Popularized by Investment Quality Trends (IQT) in the 1960’s, ‘Dividend Yield Theory’ is simple and intuitive. It basically says that for quality dividend growth stocks, meaning those with stable business models that don’t significantly change over time, dividend yields tend to revert to the mean.

What makes ‘Dividend Yield Theory’ simple to understand is that if the current yield is above the ‘historical yield’ (its mean), then the stock is likely undervalued and if it is below, it is likely overvalued.

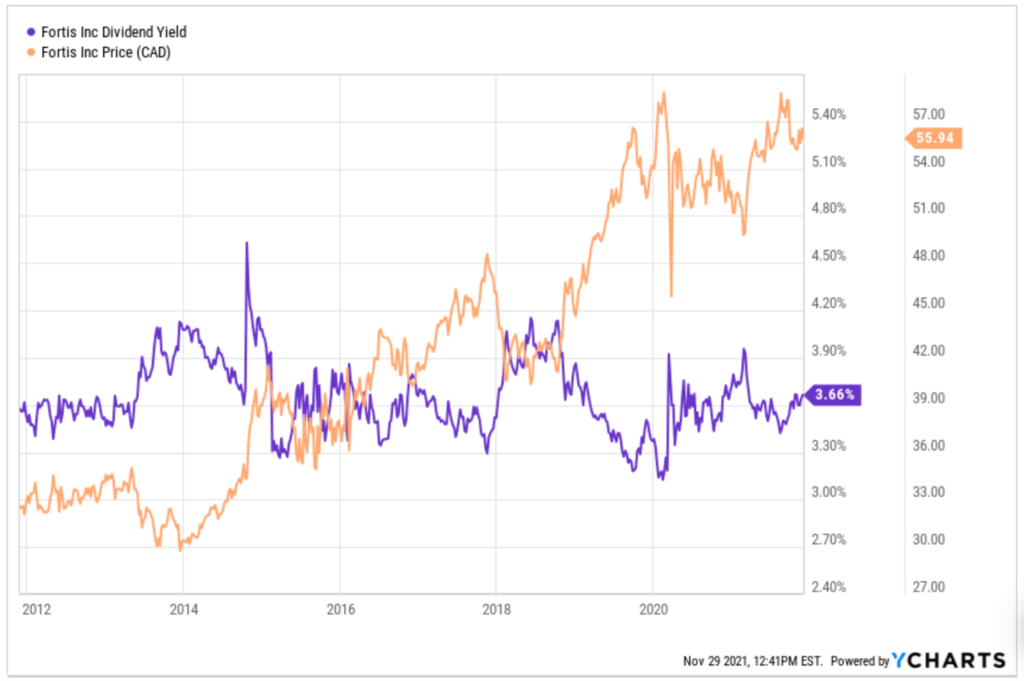
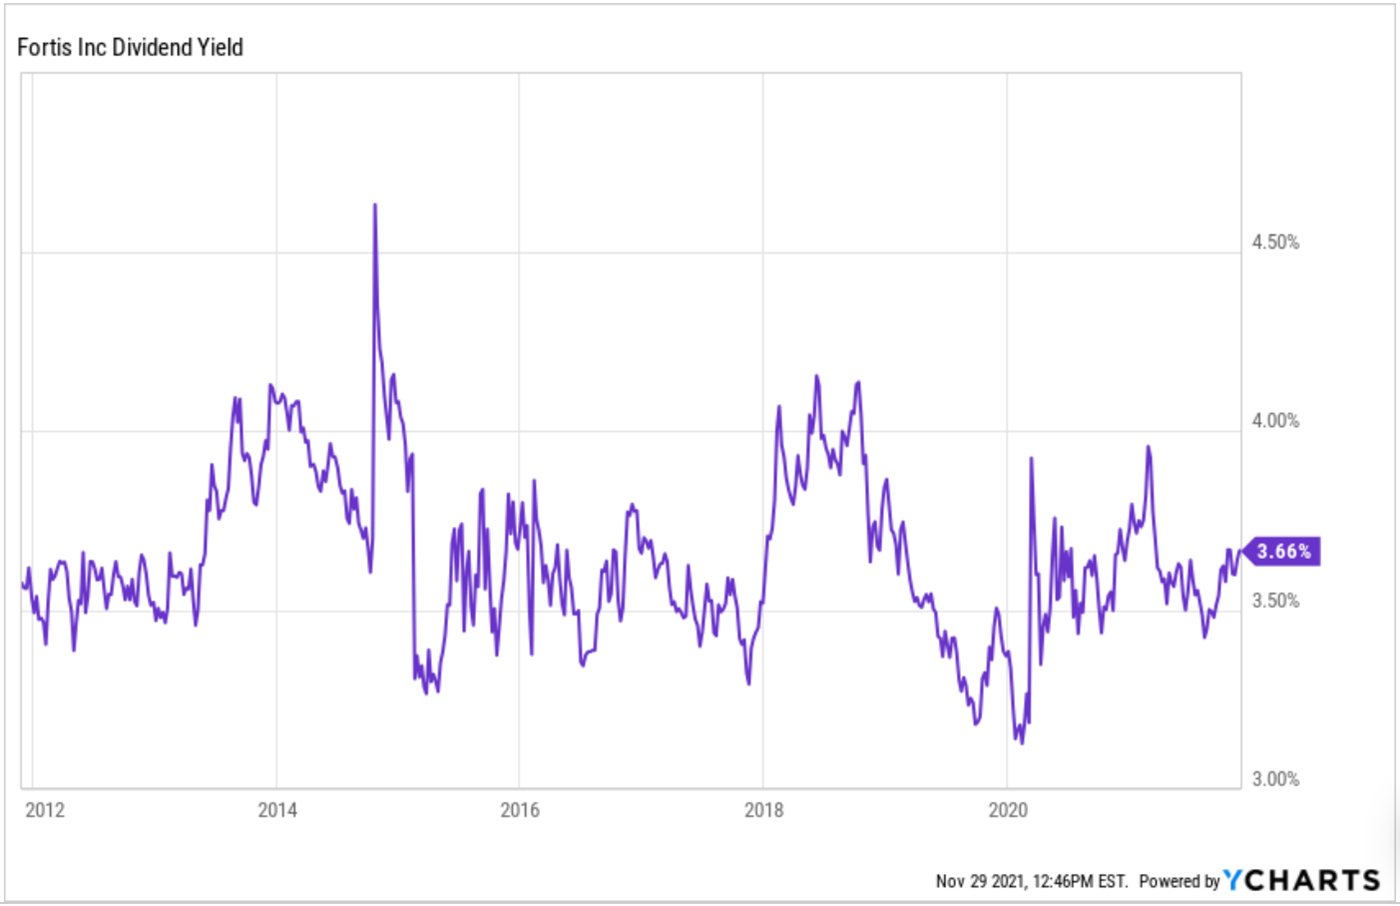
To explain, let’s begin with a yield chart of one of the stock’s on ‘The List’, Fortis Inc. (FTS.TO).

Reviewing a 10 Year Yield Chart is one of the first things we do when we are assessing valuation. We want to know what the stocks yield history looks like and try and determine if there are any repetitive patterns, we should be aware of.

Now let’s add price data to the chart.

Fortis Yield vs Price

First it should be noted that yield and price move in opposite directions. A rising price sends the yield lower, and a falling price sends the yield higher.

Reviewing the yield chart, we can see that Fortis tends to trade between a 3% and 4% dividend yield with very few exceptions. If we were to add an undervalue line it would be at a price when the yield goes above a 4% yield and an overvalue line would be at a price below a 3% yield. Knowing this, you can time your purchases when Fortis approaches or exceeds the undervalue historical yield of 4%.

Another observation from this chart and of ‘Dividend Yield Theory’ in general is that the yield acts as a ‘floor of safety’ with respect to the price. Once the high end of our historical yield is met, investors jump back in looking for the higher yield and the stock’s price reverts from its downward trend and begins to move higher. This is one of the good things about dividend growth stocks in a bear market, they don’t tend to drop as much as the rest of the market and recover faster, primarily because of their yield.

IQT has been successful for almost sixty years using ‘Dividend Yield Theory’ as the cornerstone of their investing methodology. Buy at undervalue, hold through the rising trend, sell at overvalue, rinse, and repeat. They also use similar qualitative characteristics to what we use to screen for only the highest quality companies. Of all the investing newsletters it tracks, Hulbert Financial Digest lists IQT on its Honour Roll, outperforming the S&P 500 index in all time periods.

As dividend growth investors we use ‘Dividend Yield Theory’ as a valuation tool to ensure we purchase at a sensible price and then hold for the growing income. If extreme overvaluation occurs, we may look at trimming our position using ‘Dividend Yield Theory’ as well.

Fortis has a very consistent yield history, so it is a good example of ‘Dividend Yield Theory’ in action. Excessively higher than average yields or yields that stay inflated for long periods of time could point to a problem with the company so be careful about applying ‘Dividend Yield Theory’ to all dividend paying stocks unilaterally. As Anthony Spare’s quote at the top so eloquently points out, “…stocks have their own unique dividend yield history.”

P.S. If Fortis’ yield is similar today to what it was in 2011 and the price has almost doubled what do you think has happened to its dividend?

Hint: Dividend/Price = Yield

Yield on Cost: Getting the Respect it Deserves

Posted by BM on August 27, 2021 

“We believe yield on cost (the indicated dividend divided by the per share purchase price) may be a more accurate measure of the long-term value of a dividend.”

-Standard and Poors Outlook, September 8, 2004

Yield on Cost (YOC) is a much-maligned term because it is not really the yield that the stock is trading at today. Many investors believe the only yield that really matters is the yield today.

Our two mentors use a different term for YOC. Tom Connolly calls it Greater Dividend Return and Chuck Carnevale calls it Growth Yield. Both agree that it clearly singles out the growing cash flow of our quality dividend growers and is therefore useful as a metric. Imagine beating the index from dividends alone after less than a decade of holding a good dividend grower.

“Some people who do not ‘believe’ in YOC argue that what happened ten or 15 years ago is not always a good indicator of the future. That’s true. I’m not saying that YOC is a good indicator of the future. However, if the dividend has grown since purchase, YOC is a good indicator the company is doing well. If a company has a ‘culture’ of increasing its dividend the pattern could easily continue. If folks are not using YOC to measure because it is rooted in the past, how do they measure their returns? Do they not use a past-connected number also? Growing yield is the essence of what the dividend growth strategy is about. Growing yield drives returns. If the yield does not grow, essentially, you have a bond.”

-Tom Connolly

Whenever we analyze decade long returns of our quality dividend growers, we usually show a column for Yield on Cost (YOC). We use historical dividend growth rates to help estimate, based on a starting yield today, what return we can realistically expect to receive in the future from dividends alone. This is important for retirees who require a certain income in their retirement.

‘The List’ YOCs below (over the last decade) tell you a lot about the historical dividend growth of the underlying companies. 10YR_YOC-The List-01-01-2021

If you look closely at the data in the file you will find six companies that now return more than 10% on dividends alone. If you combine capital appreciation and dividends, you end up with a total return of ~15.5% annually over the past decade. I wonder what their fifteen- and twenty-year Greater Dividend Returns/Growth Yields will look like?

In addition to good total returns over time, one of the biggest benefits of the YOC metric is that by focusing on dividend growth returns alone an investor can navigate the short-term price volatility often found in the stock market and focus on building a sound income producing plan for their retirement.

Estimating Future Returns

Posted by BM on June 14, 2021 

We spend a lot of time reviewing historical returns and metrics as dividend growth investors. This is important as it gives you a better idea of the nature of the company you are investing in (cyclical or not) and when historically has been a good time to purchase the stock. Trying to estimate the future however tends to more difficult.

In previous posts we looked at the FASTgraphs ‘Estimating’ tab for a comprehensive approach to predicting the future growth of our stocks. If you are looking for something quicker or confirmation on what you learned from your FASTgraphs analysis, here are a couple of other options.

A lot of dividend growth investors use the simple Yield + Growth formula to quickly arrive at a decision on whether to enter a position. If starting yield is 4% and growth is 6% then you can reasonably expect to make a 10% return on your investment. Where this formula fails, at least in the short run, is when the current valuation is abnormally high. A stock, with the above metrics, that trades at a current valuation of a 20 P/E when it’s average is 15 is more likely than not to generate a lower annual return over the next few years simply because it’s current valuation is too high. The market will eventually price the stock closer to its average P/E and your short-term returns will suffer.

John Bogle, the founder of the Vanguard Group, has a better methodology for estimating future returns. What I like about Bogle’s formula is that it back tests well and seems to align with the dividend growth stocks we invest in.

Jack Bogle’s expected return formula:

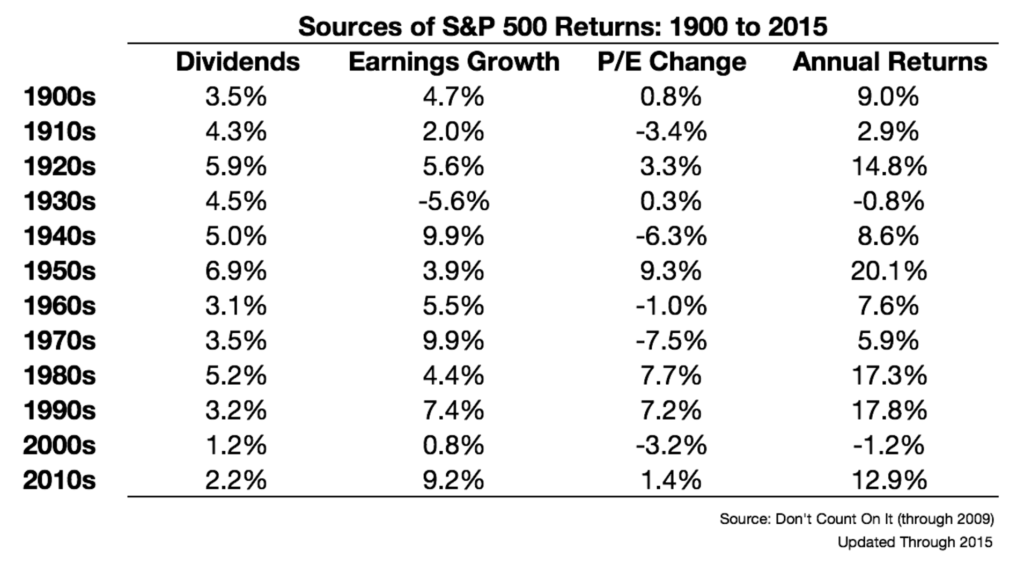
Future Market Returns = Dividend Yield + Earnings Growth +/- Change in P/E Ratio

Bogle calls the first two components, Yield + Growth, investment aspects of the investment return and the last component, +/- Change in P/E Ratio, the speculative return – what will people pay for a dollar’s worth of earnings. 

In his book ‘Don’t Count On It’ Bogle provides a long-term look at how this formula has played out by decade going all the way back to 1900.

This data is quite interesting because it gets to the core of what we do as dividend growth investors. Yield and Growth are stalwarts in our dividend growth philosophy and have done well over the years. The data then suggests that if we hold long enough or buy when P/E’s are more reasonable we can avoid most of the sub-par annual returns in Bogle’s chart.

Tom Connolly calls the speculative return component (P/E Change) the ‘Excitement Factor’. A high P/E means people are excited about stocks and a lower P/E the opposite. The most important takeaway in Bogle’s chart is just how much the ‘Excitement Factor’ affects annual returns. Paying attention to this key component can make the difference between average and above average returns going forward, especially in the short term.

Total Dividends Paid Over the Last Decade

Posted by BM on June 7, 2021 

‘The List’ attached is sorted by total dividends paid over ten years. Invest $10,000 in each stock in ‘The List’ on January 1, 2011 and you can see how much you would have received in total dividends alone over the past decade. The average is a little over 50% of your initial investment ($5,139). Starting yield (YLD ’11) has a big impact on dividends paid in the first ten years but some of our low yield high growth stocks are gaining fast. It will be interesting to run this report in another ten years’ time to see how things have changed.

By looking in the 2011 column and comparing it to 2020, you will notice that most doubled their dividend in the past decade. Growing income in our retirement is why we invest in dividend growth stocks.

Which stocks are best? High yield low growth or low yield high growth. Each investor is a little bit different. Maybe a hybrid approach will work best for most.

Here is ‘The List’ in total dividends paid order: 10YR_DIV_PAID.PDF

FASTgraphs as a Valuation Tool – Part 3

Posted by BM on May 28, 2021 

Reviewing historical information is a good way to see how a stock has performed over time but critics of this approach in valuation will often accuse you of looking backward. They have a point, so FASTgraphs has added an ‘Estimates’ tab to its arsenal. Before I buy, sell or hold a stock I want some expectation of what the return in the future might look like. We simply do not buy a stock and hope for a return. With FASTgraphs we have five ways to view the future thanks to the Analysts who follow the stock. I will use the ‘Normal Multiple’ approach.

TRP has traded at a ‘Normal Multiple’ over the past five years of 16.84 (P/E). We will use that multiple combined with the Analyst’s (19 of them) estimated earnings and dividend growth to arrive at a reasonable expectation of return. We are also only going to use the information out to the end of 2022 as after that the number of Analysts providing estimates drops off quickly.

The ‘Black Line’ is the price line and shows the stock price going back to the beginning of 2020 until now. The dotted black line represents a projection of the stock price at the end of 2022. The box on the right side of the graph shows the data that helps you decide. The data shows you the projected stock price ($73.80) and how much of your return is made up from capital appreciation and the dividend paid. Over the next year and a half Analysts predict you will make ~17% total annualized rate of return (ROR) on a purchase at today’s price. This projection assumes that the Analysts are correct in their earnings estimates and that the stock trades at its normal multiple at the end of 2022. We can always do projections both assuming a higher P/E and a lower P/E than the norm to see a range of results. We call this our valuation corridor.

Source: FASTgraphs

Another nice feature of the FASTgraphs tool is it’s ‘Analyst Scorecard’ feature. What you are trying to determine here, is how accurate have Analysts been with their past projections.

If you scroll across the ‘2-yr Forward’ row you will see the past predictions of Analysts and right below the ‘Actual’ earnings numbers. Over the last five years, the Analysts have underestimated Actual earnings every time. Their summarized historical record can be found in the ‘Summary’ tab on this Analyst Scorecard view. Actual earnings have either hit or beat Analysts two-year projections 83% of the time over the last twelve years (assuming a 20% margin of error). Their record recently has been much better. This should give you a comfort feeling when it comes to trusting the Analysts who cover TRP as they have recently been conservative in their projections tending to underestimate as opposed to overestimate earnings (Difference % row).

Source: FASTgraphs

Forecasting is not an exact science but with a little research you can set reasonable expectations of what the future may look like.

This ends our three-part series on the FASTgraphs tool. Although we do not use FASTgraphs exclusively to make our investment decisions it certainly helps you feel comfortable when you do decide on an action (buy, sell, hold).

FASTgraphs as a Valuation Tool – Part 2

Posted by BM on May 25, 2021 

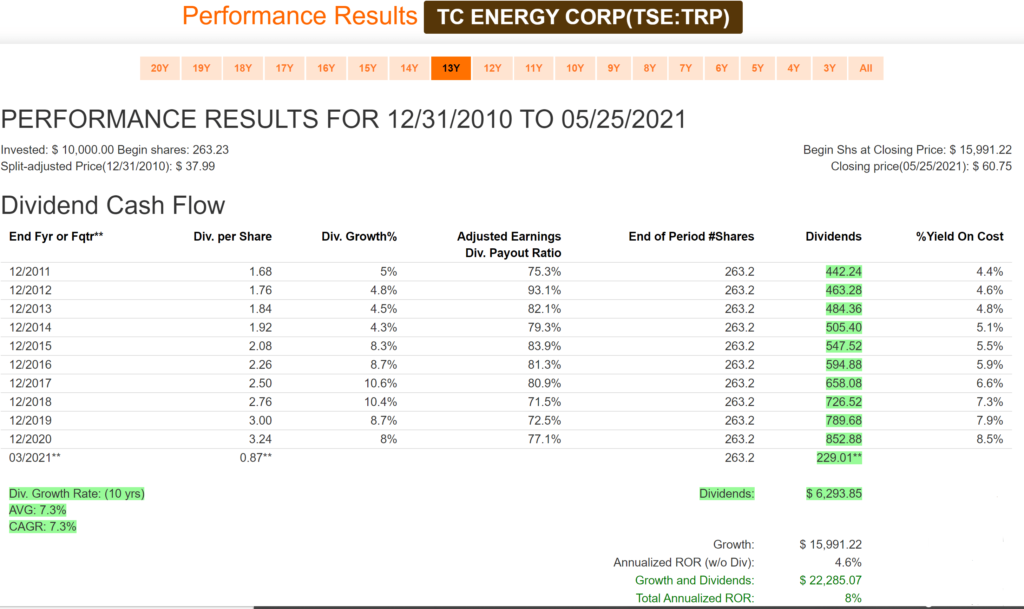
Once we identify that a company is worth digging into deeper, we use FASTgraphs to look at a few dividend performance metrics. The image below is for the previous ten years and we can see that TRP has had an average annual dividend growth rate of 7.3% and a consistent payout ratio in the 75% range. We can also see that TRP has generated over $6000 (on a 10K investment) in income alone. TRP looks like a great income stock with a safe and growing dividend but what about capital growth?

TRP Performance
Source: FASTgraphs

If we take a little closer look at the metrics, we notice that TRP’s annualized Rate of Return (ROR) was 8%. Notice that only 4.6% of that return came from capital growth with the rest coming from the dividend and its growth. With a starting yield of 4.4% and dividend growth of 7.3% you would expect a ROR of close to 12%.

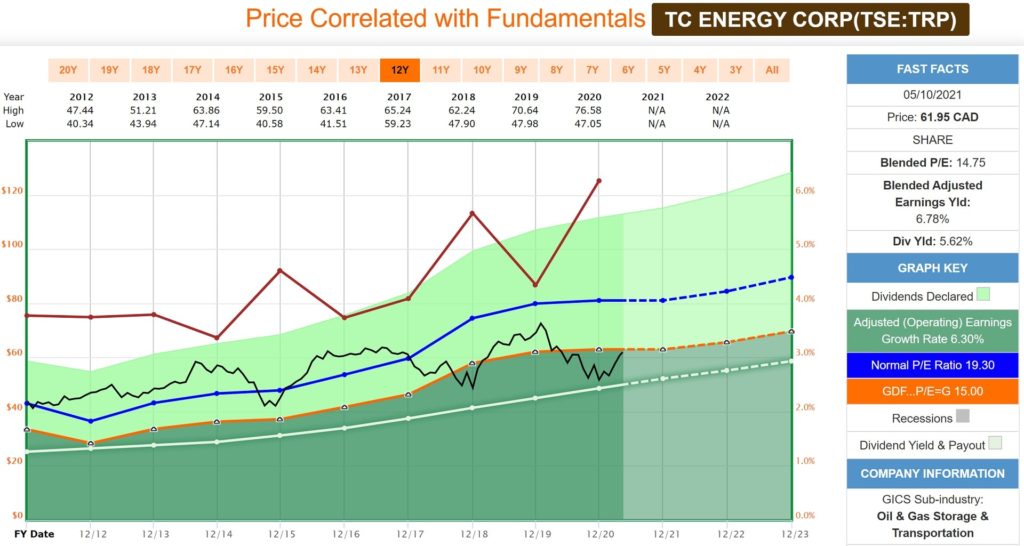
If you look at the Price Chart below (found in Part 1 of this series) you will see that TRP was valued at ~19 P/E in 2012 (near the Blue Line) where today it is close to the Orange Line with a P/E of 15. Had TRP been valued in 2012 at a P/E of 15 then our annualized ROR would be almost 4% higher (50% more). The change in P/E was responsible for the sub-par capital growth.

TRP was overvalued in 2012 and thus future capital/price returns were less going forward. The numbers unravel the mystery.

TRP FastGraphs
Source: FASTgraphs

From the information we have so far, we are getting a clearer picture of when TRP is fairly-valued. We also know the impact on our future returns if we purchase TRP when it is over-valued.

In Part 3 of this series we will use FASTgraphs to estimate future earnings, dividends and their growth rates to see if the future will be the same or better than the past.

FASTgraphs as a Valuation Tool – Part 1

Posted by BM on May 10, 2021 

I have written three articles on value indicators over the past month, and each have their merits when it comes to screening for fairly valued dividend growth stocks. I will now use a tool that combines all of these indicators into one graphical representation of valuation. That tool is the Fundamental Analysis Software Tool (FASTgraphs).

One of my mentors, Chuck Carnevale, is the inventor of this tool and I highly recommend a subscription to any serious investor. In this article, I will use FASTgraphs to quickly screen for fairly valued stocks on ‘The List’ so that we can take a deeper look into fundamentals.

We use earnings yield as our initial screen. Earnings yield is the annual earnings of a stock, individual company, or market index compared to the price. Earnings Yield = Annual Earnings Per Share / Stock Price. Another way to think of it is that for every dollar you invest in a stock you would expect to get a return equal to the earnings yield. Earnings yield is good for evaluating potential returns across companies with similar characteristics (dividend growth companies) and other forms of investments. For example, a bond paying 6% would be similar to a stock with an earnings yield of 6% at the time of purchase.

Our screen at the time of writing this article brings up seven companies with an earnings yield of at least 6.5% which we will set as the minimum return we are looking for.


Source: FASTgraphs

For the purposes of this article I am going to review TC Energy (TRP). The same valuation process could be used on any stock in our list.


Source: FASTgraphs

When we look at a FASTgraph for one of our stocks we can select what we want to see. Here I have selected five fundamentals. Dividend Payout Ratio (White Line), Graham Valuation P/E of 15 (Orange Line), Normal P/E (Blue Line), Price (Black Line) and Dividend Yield (Red Line). I have also selected a ten-year time period with two years of future estimates to help give us a more complete picture of how this company performs over a longer time horizon.

So what do we see that will help us with understanding this stocks historical valuation and whether it is fairly valued now?

The first thing we notice is that the earnings have been growing over the last decade. We can see this from the upward sloping Orange and Blue lines. The Dividend Payout Ratio (White Line) has also been increasing at a similar rate to earnings growth. This is important as you do not want a company paying dividends from money they don’t have.

We also see that the Black Line (Price) can fluctuate quite a bit. Buying this stock when it is above its Normal P/E (Blue Line) will not get you the same return as if you bought below the Orange Line. As dividend growth investors we know that dividends alone can provide us with good returns be we are always looking to maximize our Price growth as well. Buying at fair value is the best way to do this.

Finally, we will look at the historical Dividend Yield (Red Line). As can be expected, when the price of the stock falls, it’s dividend yield will rise. Buying when yields are above their historical averages means you are purchasing more income for less money (Dividend Yield Theory). TRP’s dividend yield is currently near its highest level in the last decade.

Our initial FASTgraphs review highlights TC Energy as a good candidate to analyze further as it trades below its historical 10-year average P/E (Blue Line) and has a dividend yield that is above its historical average (Red Line). The stock also appears to be close to its Graham Price as shown by its proximity to the Orange Line.

In subsequent articles we will delve even deeper into fundamentals using our FASTgraphs tool before we will decide to enter or add to our TC Energy position.

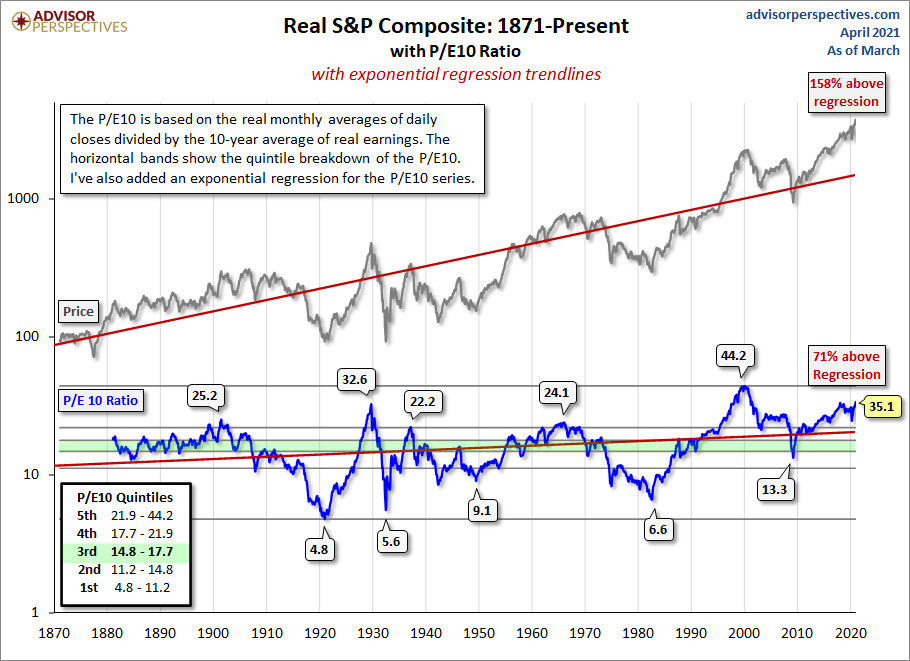
The P/E 10 Ratio (CAPE) as a value indicator

Posted by BM on April 30, 2021 

CAPE is the current price of a stock divided by the average of the last ten years of earnings. We think it is a truer P/E as it smooths out profits…the effects of economic cycles. Ben Graham liked a longer-term trailing P/E as well. Like all our value indicators we are looking for expensiveness. Lower CAPE is better.

“The P/E 10 ratio is a valuation measure generally applied to broad equity indices that use real per-share earnings over 10 years. The P/E 10 ratio also uses smoothed real earnings to eliminate the fluctuations in net income caused by variations in profit margins over a typical business cycle.

Conventional short-term Price to Earnings (P/E) ratios can sometimes be useless as a value indicator in periods of extreme market volatility. This happens when earnings fall faster than price.

Legendary economist and value investor Benjamin Graham noticed the same bizarre P/E behavior during the Roaring Twenties and subsequent market crash. Graham collaborated with David Dodd to devise a more accurate way to calculate the market’s value, which they discussed in their 1934 classic book, Security Analysis. They attributed the illogical P/E ratios to temporary and sometimes extreme fluctuations in the business cycle. Their solution was to divide the price by a multi-year average of earnings and suggested 5, 7 or 10-years. Yale professor and Nobel laureate Robert Shiller, the author of Irrational Exuberance, has popularized the concept to a wider audience of investors and has selected the 10-year average of “real” (inflation-adjusted) earnings as the denominator. Shiller refers to this ratio as the Cyclically Adjusted Price Earnings Ratio, abbreviated as CAPE, or the more precise P/E10, which is our preferred abbreviation.

Having metrics (CAPE) and graphical representations such as above helps us as investors quickly grasp the expensiveness of markets in general or businesses within the market. 

One of the great quotes I hear all the time is from one of my mentors, Chuck Carnevale, who often precedes many of his ‘valuation’ videos with the phrase “It’s a market of stocks not a stock market.”

We can review the CAPE of ‘The List’ (our ‘market of stocks’) and see if we can find any ideas. CAPE-The List-04-23-2021

There is always value to be found in the market by seeking out and analyzing individual stocks. It is however prudent to remember that when the market’s CAPE is extremely high, those opportunities may not be as plentiful and an investor should be more cautious.

In my next post on valuation, I will use the FASTgraphs tool (developed by Chuck Carnevale) to quickly analyze our dividend growth stocks. All of our ‘value indicators’ (Yield Difference, Graham Number and CAPE) are ‘graphically displayed’ to give us a quick understanding of the businesses fundamentals and valuation.

The Graham Number as a value indicator

Posted by BM on April 26, 2021 

We use the Graham Number to aid in our selection process and decide which businesses make good candidates for further research.

The Graham Number is a figure that measures a stock’s fundamental value by considering the company’s earnings per share and book value per share. The Graham Number is the upper bound of the price range that a defensive investor should pay for the stock. According to the theory, any stock price below the Graham Number is considered undervalued and thus worth investing in. The formula is as follows:

The Graham value/price we use is a modified version: square root of ((average of last three years earning per share * book value per share) * 22.5).

Source: Tom Connolly

The term is also sometimes referred to as Benjamin Graham’s Number.

Understanding the Graham Number

The Graham Number is named after the “father of value investing,” Benjamin Graham. It is used as a general test when trying to identify stocks that are currently selling for a good price. The 22.5 is included in the calculation to account for Graham’s belief that the price to earnings ratio should not be over 15 and the price to book ratio should not be over 1.5 (15 x 1.5 = 22.5).

The 7 Filters for Using the Graham Value:

  1. Seek Safety with Large Predictable companies.
    1. Look for stocks with at least $100m in sales (back in 1970’s). Adjusted for inflation, that number should be around $465 million. We use $1 Billion for our Canadian dividend growth companies.
  2. Strong Financial Condition to Prevent Bankruptcy.
    1. Current ratio > 2
    2. Long term debt < working capital
  3. Earnings Stability.
    1. No losses over the past 10 years. Companies that can maintain positive earnings are more stable.
  4. Consistent Dividends.
    1. The company should have a history of paying dividends without problems for the past 20 years. Check the payout ratio here. There are very few Canadian dividend growth companies with a record of 20 years (only 7). We use 10 years of dividend growth instead
  5. Earnings Growth.
    1. Net income per share should have increased by at least a 1/3 in the past 10 years.
  6. Price to Earnings Ratio Below 15.
  7. Price to Book below 1.5.

You can see that points number 6 and 7 make up the Graham Number.

Combine criteria 1 through 5 and you have got the full Graham Number methodology.

But there are limitations you must know.

  1. Only works for companies with positive earnings and positive tangible book value.
  2. Graham Number does not take growth into account. Therefore, it underestimates the values of the companies that have good earnings growth. We feel that if the earnings per share grows more than 10% a year, Graham Number underestimates the value.
  3. Graham Number punishes the companies that have temporarily low earnings. Therefore, an average of earnings makes more sense in the calculation of Graham Number.
  4. Underestimates stocks with little tangible assets or companies that are book ‘light’. Industries like software, service and information will not make the list.

In general, the Graham Number is a very conservative way of valuing a stock. It cannot be applied to companies with negative book values.

Source: Old School Value website

https://www.oldschoolvalue.com/stock-valuation/graham-number/

We do a sort on ‘The List’ list using the Graham Number to compare with a stock’s current price. If the current price is significantly higher, we do not investigate further. On the other hand, a positive percent difference between the Graham Number (GRAHAM $) and the current price (PRICE $) tells us to look closer.  I generally review stocks with a current price within 20% of the GRAHAM $ to be sure I don’t miss a good BUY signal.

Here is ‘The List’ with comments, sorted in G%D order as of April 23, 2021.  GRAHAM-The List-04-23-2021.PDF

We buy quality individual dividend growth stocks when they are sensibly priced and hold for the growing income.